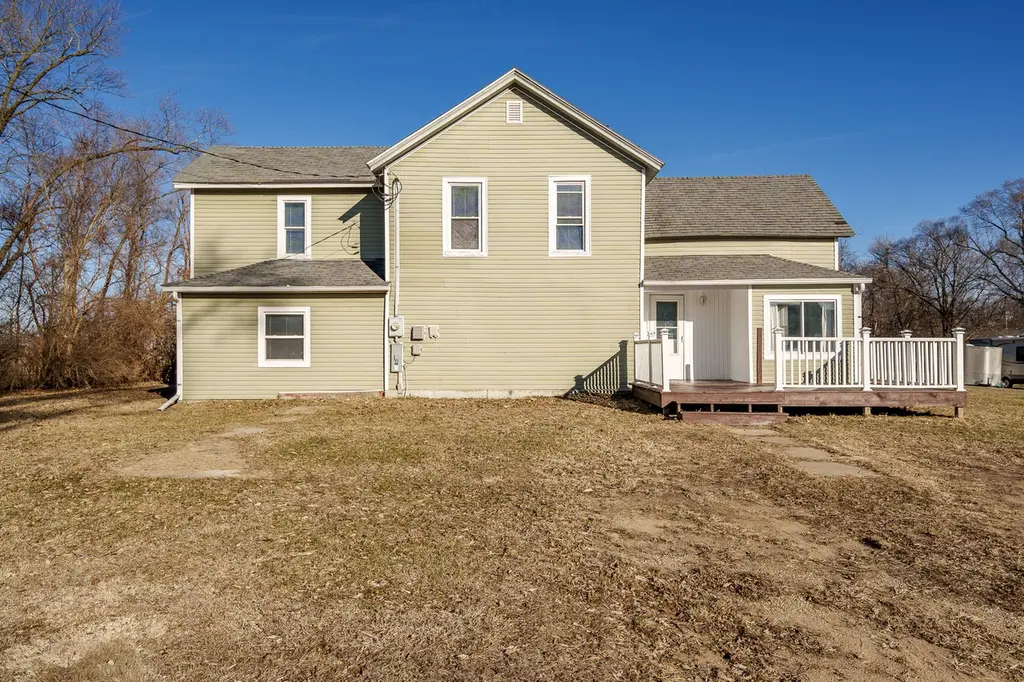
1010 North St · Thomson, IL
Flood risk 1/10 · Minimal
- FEMA flood zone
- X (unshaded)
- Chance of flooding over 30 yrs
- 0.0%
- Est. flood insurance / yr
- $507 – $1,088
Fire risk 3/10 · Minor
- Est. fire insurance / yr
- $804 – $1,492
Heat risk 3/10 · Minor
- Hot days now (above 102°F)
- 7 days/yr
- Hot days in 30 yrs
- 16 days/yr
Wind risk 2/10 · Minimal
- Chance of severe wind over 30 yrs
- —
Air-quality risk 3/10 · Minor
- Unhealthy air days now
- 2 days/yr
- Unhealthy air days in 30 yrs
- 3 days/yr
Risk factors via First Street. Map © Google.
Why this score? — see what drove the B grade
The composite is a weighted blend of 9 inputs, each scored 0–100. Each bar is that input's sub-score; the figure is the points it added to the 100-point composite (weight × sub-score).
- Cash flow +29.4/30.0
- DSCR +10.0/10.0
- 1% rule +9.1/10.0
- ARV discount +7.5/15.0
- Appreciation +7.4/10.0
- Livability +3.1/5.0
- Rent growth +2.5/5.0
- Condition / age +2.5/5.0
- Schools +1.4/10.0
$90,000
🖨 Deal sheet (PDF) 📄 Offer letter ✓ Due diligence
Listing remarks MLS
CALLING ALL INVESTORS! This four-bedroom, two-bathroom property presents an excellent opportunity for investors looking to enter the rental market. Its spacious layout and desirable features make it an attractive option for potential tenants, ensuring a steady stream of rental income. Schedule your showing today.
Key facts
- Remodeled gem
- Open-concept layout
- Built 1950
Tags
Neighborhood map
What this means for you Summary
Snapshot
- This is a 3-bed/2.0-bath single-family listed at $90k.
Deal economics
- At list price, monthly cash flow is $319 ($4k/yr) — positive.
- The deal already cash-flows at list — no discount required.
- Meets the 1% rule at list price ($1k rent vs $90k).
- Recommended offer: $79k (12.0% below list) — sets the bar for market timing.
Location & tenants
- Location reads 61/100 on livability (#927 in IL) — a middle-class / working-renter tenant base. Strengths: cost of living A+, housing A+; Watch: crime C-, amenities F, commute F.
- West Carroll CUSD 314 (rural): math 12% / reading 20% proficiency, ranked #498 of 620 in IL (top 80%) — low school quality limits family demand, transient renter base, plan for 1-2y turnover.
- Zoned schools: West Carroll Primary (math 12% / reading 17%, grade F, #1,278 of 2,056 statewide, top 65%, 416 students, 0% FRL); West Carroll Middle School (math 10% / reading 24%, grade F, #460 of 665 statewide, top 72%, 193 students, 0% FRL); West Carroll High School (math 15% / reading 15%, grade F, #462 of 693 statewide, top 68%, 286 students, 0% FRL) — zoned schools average 0% FRL vs 50% district-wide (50 pts lower); this property's tenant base skews higher-income than the district average.
- Market conditions: 17 active listings in the ZIP; 23 units permitted in Carroll County in 2024 (0 in 5+ unit buildings).
Forward outlook
- In year one you build about $5k of equity ($622 loan paydown + $4k appreciation (4.8% local appreciation)).
- Carroll County population projected at -30% by 2050 — secular population decline; favor cash flow + early exit over multi-decade hold.
- At projected returns (4.8% appreciation + 3.0% rent growth), your $25k cash investment doubles in ~3 years — after that, you're playing with house money.
- By year 7, paydown + projected appreciation supports a ~$32k cash-out refi (75% LTV) — recoverable capital for the next deal without selling this one.
Negotiation context
- It's been on market 152 days — a 12% lower offer ($79k) is reasonable based on typical stale-listing flexibility.
- Current owner paid $16k; list at $90k implies a 462% gain — meaningful room to come down on a strong offer.
Risks & watch-outs
- Watch-outs: built in 1950 — expect roof / HVAC / electrical / plumbing capex.
Questions for the listing agent
- It's been on market 152 days. Have you received any prior offers? Is the seller open to a 12% concession, seller financing, or rate buy-down credit?
- Built in 1950 — when were the roof, HVAC, electrical panel, plumbing, and water heater last replaced?
- Why hasn't it sold? Are there any deal-killer items the seller is aware of (foundation, flood, title, zoning, code violations)?
- Is there a deadline driving the sale (1031 exchange, divorce, estate, relocation)? That informs how much negotiation room exists.
- Schools are F-rated, which usually means shorter tenancies and higher turnover. Who's the typical renter profile here, and what's been the actual vacancy rate?
- What's the average days-on-market for RENTAL listings here right now (not sales)? A rising rental-DOM trend means longer vacancies and softer asking-rent achievability than the comps imply.
- What's the recent tenant-quality profile in this submarket — average credit score on applications, eviction rate, late-payment / NSF rate, and stable-employment percentage? A property-management company in the area should have these aggregated.
- How much new for-sale + rental construction is in the pipeline within 1–3 miles? Heavy new supply typically softens prices + rents 12–24 months out; constrained supply supports both.
Investment metrics
- 1% rule
- 1.41% ✓
- Cap rate
- 10.55%
- Cash-on-cash
- 15.19%
- DSCR
- 1.68
- GRM
- 5.9
CMA / ARV
- ARV (median comp)
- $203,676
- List price
- $90,000
- Delta
- -55.81%
- Verdict
- UNDERPRICED
- Comps
- 17 within 1.0 mi
Show comp detail 2 sales within ~0.75 mi
| Address | Dist | Beds/Ba | Sqft | Sold | Price | $/sf | Match |
|---|---|---|---|---|---|---|---|
| 1750 and 1752 Schade St | 0.69mi | 3/2.0 | 2,825 (+7%) | 21mo | $265,000 | $94 | 38 |
| 1750 and 1752 Schade St | 0.69mi | 3/2.0 | 2,825 (+7%) | 21mo | $265,000 | $94 | 38 |
Match score weights: distance 35% · size 25% · config 20% · recency 20%. Top-matched comps best support the ARV.
Projected returns pro-forma
4.84% appreciation · 3.0% rent growth · sell at horizon
- IRR
- 25.7%
- Equity multiple
- 2.60×
- Total profit
- $40,304
- Equity at exit
- $50,138
- IRR
- 24.9%
- Equity multiple
- 5.16×
- Total profit
- $104,795
- Equity at exit
- $85,826
Cash invested: $25,200 (down + closing). Projections, not guarantees.
Landlord ↔ Tenant lean methodology
- Overall (STATE)
- 43 Moderately Tenant-Leaning
- State Illinois
- 43 Moderately Tenant-Leaning · D+7
- County
- — inherits STATE
- City
- — inherits STATE
ZIP-level market 61285
- Home prices YoY
- 2.6%
- Active inventory
- 17
- Price-to-rent
- 5.9×
Monthly cashflow live
- Estimated rent
- $1,271 medium interval (Pro) →
- Mortgage (P&I)
- −$472
- Tax from tax record
- −$176 /mo · $2,107/yr
- Insurance
- −$38
- HOA
- −$0
- Vacancy / Maint / Mgmt
- −$267
- Net cashflow
- $319
Break-even live
Sensitivity live
| Price | -10% $370 | -5% $344 | +0% $319 | +5% $293 | +10% $268 |
|---|---|---|---|---|---|
| Rent | -10% $219 | -5% $269 | +0% $319 | +5% $369 | +10% $419 |
| Rate | -1.0pp $364 | -0.5pp $342 | base $319 | +0.5pp $296 | +1.0pp $272 |
UW: 25.0% down · 7.5% · 30yr · 1.5% tax · 5.0% vac · 8.0% maint · 8.0% mgmt
Financing live
Cash to close
- Down payment
- $22,500
- Closing costs
- $2,700
- Reserves months
- —
- Total cash needed
- —
Loan-product check · same deal, 3 products live
Conventional
25% down · 7.5% · 30yr
- Down + closing
- —
- Monthly P&I
- —
- Monthly cashflow
- —
- DSCR
- —
- Eligible?
- —
Personal DTI + credit; lowest rate.
DSCR
20% down · 8.5% · 30yr
- Down + closing
- —
- Monthly P&I
- —
- Monthly cashflow
- —
- DSCR
- —
- Eligible?
- —
No personal income docs; deal must DSCR.
Hard money
10% down · 12.0% · 12mo
- Down + closing
- —
- Monthly P&I
- —
- Monthly cashflow
- —
- DSCR
- —
- Eligible?
- —
Short-term bridge; refi at stabilization.
Listing history 22 events
-
2026-06-21days on market $90,000 Active 152 DOM
-
2026-06-19days on market $90,000 Active 150 DOM
-
2026-06-18days on market $90,000 Active 149 DOM
-
2026-06-17days on market $90,000 Active 148 DOM
-
2026-06-16days on market $90,000 Active 147 DOM
-
2026-06-15days on market $90,000 Active 146 DOM
-
2026-06-14days on market $90,000 Active 144 DOM
-
2026-06-12days on market $90,000 Active 143 DOM
-
2026-06-09days on market $90,000 Active 140 DOM
-
2026-06-08days on market $90,000 Active 139 DOM
-
2026-06-07days on market $90,000 Active 138 DOM
-
2026-06-07days on market $90,000 Active 137 DOM
-
2026-06-02days on market $90,000 Active 133 DOM
-
2026-06-01days on market $90,000 Active 132 DOM
-
2026-05-31days on market $90,000 Active 131 DOM
-
2026-05-30days on market $90,000 Active 130 DOM
-
2026-05-09price $90,000 314-char remark
Show marketing remark (314 chars)
CALLING ALL INVESTORS! This four-bedroom, two-bathroom property presents an excellent opportunity for investors looking to enter the rental market. Its spacious layout and desirable features make it an attractive option for potential tenants, ensuring a steady stream of rental income. Schedule your showing today.
-
2026-04-24price $100,000 314-char remark
Show marketing remark (314 chars)
CALLING ALL INVESTORS! This four-bedroom, two-bathroom property presents an excellent opportunity for investors looking to enter the rental market. Its spacious layout and desirable features make it an attractive option for potential tenants, ensuring a steady stream of rental income. Schedule your showing today.
-
2026-04-02price $115,000 314-char remark
Show marketing remark (314 chars)
CALLING ALL INVESTORS! This four-bedroom, two-bathroom property presents an excellent opportunity for investors looking to enter the rental market. Its spacious layout and desirable features make it an attractive option for potential tenants, ensuring a steady stream of rental income. Schedule your showing today.
-
2026-03-06price $129,900 314-char remark
Show marketing remark (314 chars)
CALLING ALL INVESTORS! This four-bedroom, two-bathroom property presents an excellent opportunity for investors looking to enter the rental market. Its spacious layout and desirable features make it an attractive option for potential tenants, ensuring a steady stream of rental income. Schedule your showing today.
-
2026-01-20$139,900 Active 314-char remark
Show marketing remark (314 chars)
CALLING ALL INVESTORS! This four-bedroom, two-bathroom property presents an excellent opportunity for investors looking to enter the rental market. Its spacious layout and desirable features make it an attractive option for potential tenants, ensuring a steady stream of rental income. Schedule your showing today.
-
1995-11-29soldstatus $16,000
ⓘ Source: listings_history table (triggers on properties + properties_extension) + one-shot
backfill from property_details.listing_events for pre-trigger history.
Tax reassessment forecast IL · Partial reset (capped growth)
- Current annual tax
- $2,107 · $176/mo
- Projected year-2 tax
- $2,107 · $176/mo
- Expected delta
- $0/yr ($0/mo · 0.0%)
ⓘ Screening estimate from a state-policy table — verify with the county assessor before closing.
Climate risk First Street
- Flood 1/10 Low FEMA zone X (unshaded) · 0% chance over 30 yrs
- Wildfire 3/10 Moderate
- Heat 3/10 Moderate 7 d/yr ≥102°F today · 16 d/yr by 30 yrs out
- Wind 2/10 Low
- Air quality 3/10 Moderate 2 unhealthy d/yr today · 3 by 30 yrs out
Nearby sold comps map
Loading sold comps map…
Walkable amenities ~0.75 mi
Loading nearby amenities…
Taxation est. · year 1
- Rental income
- $15,251
- − Mortgage interest
- −$5,041
- − Property taxes
- −$2,107
- − Insurance
- −$450
- − Repairs & maintenance
- −$1,220
- − Management
- −$1,220
- − Depreciation
- −$2,618
- Taxable income
- $2,594
- Est. tax owed @ 24.0%
- −$623
- After-tax cash flow
- $3,205/yr
For passive investors: Depreciation is non-cash, so a rental often shows a tax loss while cash-flowing — sheltering income. Rental losses are passive: they offset passive income freely, and up to $25,000/yr can offset ordinary (W-2) income if you actively participate and your MAGI is under $100k (phasing out to $0 by $150k); unused losses carry forward. On sale, claimed depreciation is recaptured at up to 25%, and gains may owe capital-gains tax (a 1031 exchange can defer both). Figures are a year-1 estimate at your 24.0% rate — not tax advice; consult a CPA.
Schools (NCES district)
- District
- West Carroll CUSD 314
- NCES district ID
- 1700310
- Math proficiency
- 12% ▼ -5.00%
- Reading proficiency
- 20% ▼ -3.00%
- Median HH income
- $43,090
- Composite
- 13.91/100
- National rank
- #9483
- State rank
- #498 of 620 in IL
Livability — Thomson
- Score
- 61/100
- State rank
- #927
- US rank
- #18008
Category grades
Schools grade is shown separately in the Schools card above.
Census & demographics
- Census place
- Thomson, IL
- Population (ZIP)
- 2,687
Population outlook (Carroll County) Hauer SSP2
- Today (2025)
- 13,010 people
- By 2030
- 12,150 · -6.6%
- By 2040
- 10,462 · -19.6%
- By 2050
- 9,078 · -30.2%
- By 2075
- 6,704 · -48.5%
- By 2100
- 5,004 · -61.5%
Race, ethnicity, and origin ACS 2023
- Neighborhood character
- Predominantly White (68%)
- Race & ethnicity
- White 68% Black 20% Hispanic / Latino 9% Two or more races 4% Native American 1%
- Hispanic origin (detail)
- Mexican 2%
- Common ancestry
- Iranian 4% Portuguese 2% Slovak 2%
- Foreign-born
- 2% · Canada
- Languages at home
- 93% English-only · Spanish 7%
Political lean MEDSL · Carroll
- 2024 margin
- Solid R (+31.7) · D 33.2% · R 64.8% · Other 2.0%
- 2008→2024 swing
- -36.5pp toward R · 2008: 4.8pp · 2024: -31.7pp
- All cycles
- 2024: R+31.7 2020: R+29.4 2016: R+27.1 2012: D+1.4 2008: D+4.8
Not yet ingested
- Civics
- —
Market trends
- HPI YoY
- ▲ 4.84%
- Current HPI
- 190.7445
- Rent YoY
- —
- Metro
- —
- State GDP YoY
- ▲ 1.59%
- F500 in state
- 60
Industry mix (Fortune 500 HQ in IL)
| Industry | F500 HQs | Revenue |
|---|---|---|
| Insurance | 4 | $201B |
|
||
| Consumer Goods | 4 | $87B |
|
||
| Industrial Machinery | 3 | $64B |
|
||
| Healthcare | 2 | $55B |
|
||
| Retail / Pharmacy | 1 | $148B |
|
||
| Agriculture / Food | 1 | $86B |
|
||
Price history
+462.5% since first listed6 events — show timeline
- 2026-05-09 Price Changed $90,000 MRED as Distributed by MLS Grid
- 2026-04-24 Price Changed $100,000 MRED as Distributed by MLS Grid
- 2026-04-02 Price Changed $115,000 MRED as Distributed by MLS Grid
- 2026-03-06 Price Changed $129,900 MRED as Distributed by MLS Grid
- 2026-01-20 Listed $139,900 MRED as Distributed by MLS Grid
- 1995-11-29 Sold (Public Records) $16,000 Public Records
Property tax history
+8.9%/yrLatest (2024): $2,107 · -4.8% YoY. Source: county tax records.
Cash-flow waterfall
monthlySold comps — $/sqft
last 12 mo · ≤1 miLoading sold comps…