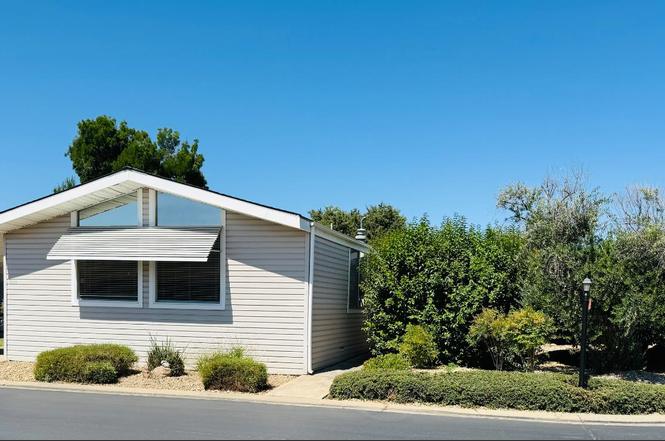
2240 Golden Oak Ln #134 · Merced, CA
Flood risk 1/10 · Minimal
- FEMA flood zone
- AO
- Chance of flooding over 30 yrs
- 0.0%
- Est. flood insurance / yr
- $848 – $2,087
Fire risk 7/10 · Major
- Est. fire insurance / yr
- $659 – $1,223
Heat risk 7/10 · Major
- Hot days now (above 105°F)
- 7 days/yr
- Hot days in 30 yrs
- 17 days/yr
Wind risk 1/10 · Minimal
- Chance of severe wind over 30 yrs
- —
Air-quality risk 10/10 · Severe
- Unhealthy air days now
- 34 days/yr
- Unhealthy air days in 30 yrs
- 35 days/yr
Risk factors via First Street. Map © Google.
Why this score? — see what drove the B grade
The composite is a weighted blend of 9 inputs, each scored 0–100. Each bar is that input's sub-score; the figure is the points it added to the 100-point composite (weight × sub-score).
- Cash flow +30.0/30.0
- 1% rule +10.0/10.0
- DSCR +10.0/10.0
- ARV discount +8.2/15.0
- Livability +3.7/5.0
- Rent growth +2.9/5.0
- Schools +2.8/10.0
- Condition / age +2.5/5.0
- Appreciation +0.0/10.0
$104,900
🖨 Deal sheet (PDF) 📄 Offer letter ✓ Due diligence
Listing remarks
Home sweet Home! Spacious doublewide modular home, corner lot near the clubhouse, featuring 2 bedrooms & 2 full bath, spacious floor plan, inside laundry, newer covered deck Etc. Gated senior community at popular Sierra Portal, the Clubhouse features Kitchen, Billiards, Bingo, fitness studio, sauna, spa, sparkling pool Etc. Secured Dog park onsite. Seller is offering first month space rent incentive.
Key facts
- Newer covered deck
- Corner lot
- Inside laundry
Tags
Property features AI
Finance
- Other: Property located at 2240 Golden Oak Ln #134, Merced, CA 95341
- Financial info: $877 land lease amount (listed in data)
- HOA & community: No homeowners association; Located in a senior community; Land lease: No (land lease amount listed separately)
Exterior
- Parking: Covered parking
- Utilities: 220 volts in laundry; Other electric; Other water source; Other sewer; Other utilities
- Home design: Manufactured home in park (double wide); Built in 1973
- Construction: Composition roof; Skirt: Other; Make: LVITT
- Exterior features: Covered carport; Patio awning; Corner lot
Interior
- Kitchen: Synthetic countertop; Appliances described in remarks
- Bedrooms: 2 bedrooms (includes master bedroom)
- Flooring: Carpet; Laminate; Other
- Bathrooms: 2 full bathrooms with tub and separate shower stall
- Heating & cooling: Central heating; Central cooling
- Interior features: Covered deck/patio; Patio awning and carport awning; Pets allowed
- Laundry & utility: Laundry inside; 220V outlet in laundry area
Neighborhood map
What this means for you Summary
Snapshot
- This is a 2-bed/2.0-bath manufactured listed at $105k.
Deal economics
- At list price, monthly cash flow is $545 ($7k/yr) — positive.
- The deal already cash-flows at list — no discount required.
- Meets the 1% rule at list price ($2k rent vs $105k).
- Recommended offer: $92k (12.0% below list) — sets the bar for market timing.
- Cap rate 13.9% vs local median 3.4% in Merced — top-decile yield for the area; either an underpriced asset or a hidden risk that comps aren't pricing in. Stress-test before assuming the spread holds.
Location & tenants
- Location reads 73/100 on livability (#153 in CA) — a middle-class / working-renter tenant base. Strengths: amenities A+, commute A+, housing A+; Watch: employment D, crime F, cost of living F.
- Merced Union High (urban): math 20% / reading 46% proficiency, ranked #301 of 517 in CA (top 58%) — families likely to look elsewhere, expect single-tenant / working-renter base with shorter leases.
- Zoned schools: John Muir Elementary (605 students, 96% FRL); Herbert Hoover Middle (614 students, 79% FRL); Merced High (math 20% / reading 47%, grade F, #656 of 1,170 statewide, top 57%, 1,894 students, 76% FRL).
- Market conditions: Rents rising (+1.7%/yr); 169 active listings in the ZIP; 15 comparable units currently listed for rent nearby; rentals at typical pace (median 15d on market — plan ~3-4 weeks tenant-placement turnaround); 459 units permitted in Merced County in 2024 (0 in 5+ unit buildings).
- This rent runs 37% of the median local income ($57k/yr) — at the standard rent-burdened threshold; future hikes will face affordability resistance.
Forward outlook
- Local home prices are declining (-3.0%/yr); year-one equity from $725 of loan paydown is wiped out by about $3k of value loss. Plan a longer hold.
- Merced County population projected at +12% by 2050 — modest demand growth; plan on rents tracking national, not racing it.
- At projected returns (-3.0% appreciation + 1.7% rent growth), your $29k cash investment doubles in ~6 years — after that, you're playing with house money.
Negotiation context
- It's been on market 156 days — a 12% lower offer ($92k) is reasonable based on typical stale-listing flexibility.
Risks & watch-outs
- Watch-outs: flood insurance adds $122/mo.
- Climate carrying-cost: in FEMA flood zone AO (mandatory federal flood insurance); major wildfire risk; extreme-heat days projected 7→17/yr by 2055 (HVAC capex compounding) — expect insurance premiums to compound above CPI over the hold.
Questions for the listing agent
- It's been on market 156 days. Have you received any prior offers? Is the seller open to a 12% concession, seller financing, or rate buy-down credit?
- Built in 1973 — when were the roof, HVAC, electrical panel, plumbing, and water heater last replaced?
- What's the actual annual flood-insurance premium (NFIP or private), and is the property in a SFHA with mandatory coverage?
- Why hasn't it sold? Are there any deal-killer items the seller is aware of (foundation, flood, title, zoning, code violations)?
- Is there a deadline driving the sale (1031 exchange, divorce, estate, relocation)? That informs how much negotiation room exists.
- Schools are D-rated, which usually means shorter tenancies and higher turnover. Who's the typical renter profile here, and what's been the actual vacancy rate?
- Crime grade is F in this area — have there been break-ins, vandalism, or insurance claims at this property in the last 3 years? What carrier currently insures it and at what premium?
- What's the average days-on-market for RENTAL listings here right now (not sales)? A rising rental-DOM trend means longer vacancies and softer asking-rent achievability than the comps imply.
- What's the recent tenant-quality profile in this submarket — average credit score on applications, eviction rate, late-payment / NSF rate, and stable-employment percentage? A property-management company in the area should have these aggregated.
- How much new for-sale + rental construction is in the pipeline within 1–3 miles? Heavy new supply typically softens prices + rents 12–24 months out; constrained supply supports both.
Investment metrics
- 1% rule
- 1.68% ✓
- Cap rate
- 13.93%
- Cash-on-cash
- 27.26%
- DSCR
- 2.21
- GRM
- 5.0
CMA / ARV
- ARV (on-the-fly)
- $106,560
- Comps found
- 2
Show comp detail 2 sales within ~0.75 mi
| Address | Dist | Beds/Ba | Sqft | Sold | Price | $/sf | Match |
|---|---|---|---|---|---|---|---|
| 2240 Golden Oak Ln #82 | 0.00mi | 2/1.5 | 1,440 (0%) | 21mo | $70,000 | $49 | 80 |
| 2240 Golden Oak Ln #81 | 0.00mi | 3/2.0 (+1) | 1,536 (+7%) | 9mo | $114,000 | $74 | 76 |
Match score weights: distance 35% · size 25% · config 20% · recency 20%. Top-matched comps best support the ARV.
Projected returns pro-forma
-3.0% appreciation · 1.68% rent growth · sell at horizon
- IRR
- 13.5%
- Equity multiple
- 1.53×
- Total profit
- $15,506
- Equity at exit
- $15,641
- IRR
- 21.2%
- Equity multiple
- 2.68×
- Total profit
- $49,382
- Equity at exit
- $9,070
Cash invested: $29,372 (down + closing). Projections, not guarantees.
Landlord ↔ Tenant lean methodology
- Overall (STATE)
- 18 Strongly Tenant-Friendly
- State California
- 18 Strongly Tenant-Friendly · D+13
- County
- — inherits STATE
- City
- — inherits STATE
ZIP-level market 95341
- Home prices YoY
- -29.2%
- Rents YoY
- 1.7%
- Active inventory
- 169
- Price-to-rent
- 5.0×
Monthly cashflow live
- Estimated rent
- $1,762 high interval (Pro) →
- Mortgage (P&I)
- −$550
- Tax est. 1.5%
- −$131 /mo · $1,574/yr
- Insurance
- −$44
- Flood insurance flood zone
- −$122 /mo · $1,468/yr
- HOA
- −$0
- Vacancy / Maint / Mgmt
- −$370
- Net cashflow
- $545
Break-even live
Sensitivity live
| Price | -10% $618 | -5% $581 | +0% $545 | +5% $509 | +10% $473 |
|---|---|---|---|---|---|
| Rent | -10% $406 | -5% $475 | +0% $545 | +5% $615 | +10% $684 |
| Rate | -1.0pp $598 | -0.5pp $572 | base $545 | +0.5pp $518 | +1.0pp $490 |
UW: 25.0% down · 7.5% · 30yr · 1.5% tax · 5.0% vac · 8.0% maint · 8.0% mgmt
Financing live
Cash to close
- Down payment
- $26,225
- Closing costs
- $3,147
- Reserves months
- —
- Total cash needed
- —
Loan-product check · same deal, 3 products live
Conventional
25% down · 7.5% · 30yr
- Down + closing
- —
- Monthly P&I
- —
- Monthly cashflow
- —
- DSCR
- —
- Eligible?
- —
Personal DTI + credit; lowest rate.
DSCR
20% down · 8.5% · 30yr
- Down + closing
- —
- Monthly P&I
- —
- Monthly cashflow
- —
- DSCR
- —
- Eligible?
- —
No personal income docs; deal must DSCR.
Hard money
10% down · 12.0% · 12mo
- Down + closing
- —
- Monthly P&I
- —
- Monthly cashflow
- —
- DSCR
- —
- Eligible?
- —
Short-term bridge; refi at stabilization.
Rent comps 15 comps
| Address | Beds | Baths | Sqft | Rent | $/sqft | DOM | Units | Dist |
|---|---|---|---|---|---|---|---|---|
| 1922 Martin Luther King Jr Way Merced, CA | 2.0 | 1.0 | 900 | $1,375 | $1.53 | 15d | 1 | 0.13mi |
| 2029 O St Merced, CA | 3.0 | 1.5 | 1450 | $1,795 | $1.24 | 15d | 1 | 0.44mi |
| 820 W 23rd St Merced, CA | 2.0 | 1.0 | 1014 | $1,750 | $1.73 | 15d | 1 | 0.54mi |
| 937 W 20th St Unit 937-939 Merced, CA | 3.0 | 2.0 | 1455 | $1,725 | $1.19 | 15d | 1 | 0.54mi |
| 929 W 22nd St Merced, CA | 2.0 | 1.0 | 936 | $1,595 | $1.70 | 15d | 1 | 0.59mi |
| 2415 O St Unit 2419 Merced, CA | 2.0 | 1.5 | 1000 | $1,500 | $1.50 | 15d | 1 | 0.61mi |
| 2340 Circle Dr Merced, CA | 3.0 | 2.0 | 1250 | $1,900 | $1.52 | 15d | 1 | 0.91mi |
| 244 W Alexander Ave Merced, CA | 2.0 | 2.0 | 1205 | $1,500 | $1.24 | 15d | 1 | 1.00mi |
| 1935 V St Merced, CA | 3.0 | 2.0 | 1280 | $1,800 | $1.41 | 22d | 1 | 1.04mi |
| 2929 M St Merced, CA | 2.0 | 2.0 | 1397 | $1,888 | $1.35 | 15d | 1 | 1.07mi |
| 2618 Hoover Ct Merced, CA | 3.0 | 2.0 | 1220 | $2,200 | $1.80 | 15d | 1 | 1.08mi |
| 2685 Agnes Way Merced, CA | 3.0 | 2.0 | 1130 | $1,845 | $1.63 | 15d | 1 | 1.16mi |
| 3075 Park Ave Merced, CA | 1.0–3.0 | 1.0–2.0 | 1155 | $1,775 | $1.54 | 15d | 1 | 1.18mi |
| 464 Lucas Ct Merced, CA | 3.0 | 2.0 | 1091 | $1,950 | $1.79 | 15d | 1 | 1.40mi |
| 1331 Frankfort Ct Merced, CA | 3.0 | 2.0 | 1331 | $1,600 | $1.20 | 15d | 1 | 1.44mi |
Listing history 16 events
-
2026-06-21days on market $104,900 Active 156 DOM
-
2026-06-18days on market $104,900 Active 153 DOM
-
2026-06-17days on market $104,900 Active 152 DOM
-
2026-06-16days on market $104,900 Active 151 DOM
-
2026-06-15days on market $104,900 Active 150 DOM
-
2026-06-14days on market $104,900 Active 148 DOM
-
2026-06-13days on market $104,900 Active 147 DOM
-
2026-06-10days on market $104,900 Active 145 DOM
-
2026-06-09days on market $104,900 Active 144 DOM
-
2026-06-08days on market $104,900 Active 143 DOM
-
2026-06-07days on market $104,900 Active 142 DOM
-
2026-06-03days on market $104,900 Active 138 DOM
-
2026-06-02days on market $104,900 Active 137 DOM
-
2026-06-01days on market $104,900 Active 136 DOM
-
2026-05-31days on market $104,900 Active 135 DOM
-
2026-05-30days on market $104,900 Active 134 DOM
ⓘ Source: listings_history table (triggers on properties + properties_extension) + one-shot
backfill from property_details.listing_events for pre-trigger history.
Climate risk First Street
- Flood 1/10 Low FEMA zone AO · 0% chance over 30 yrs
- Wildfire 7/10 Severe
- Heat 7/10 Severe 7 d/yr ≥105°F today · 17 d/yr by 30 yrs out
- Wind 1/10 Low
- Air quality 10/10 Extreme 34 unhealthy d/yr today · 35 by 30 yrs out
Nearby sold comps map
Loading sold comps map…
Walkable amenities ~0.75 mi
Loading nearby amenities…
Taxation est. · year 1
- Rental income
- $21,148
- − Mortgage interest
- −$5,876
- − Property taxes
- −$1,574
- − Insurance
- −$1,992
- − Repairs & maintenance
- −$1,692
- − Management
- −$1,692
- − Depreciation
- −$3,052
- Taxable income
- $5,271
- Est. tax owed @ 24.0%
- −$1,265
- After-tax cash flow
- $5,275/yr
For passive investors: Depreciation is non-cash, so a rental often shows a tax loss while cash-flowing — sheltering income. Rental losses are passive: they offset passive income freely, and up to $25,000/yr can offset ordinary (W-2) income if you actively participate and your MAGI is under $100k (phasing out to $0 by $150k); unused losses carry forward. On sale, claimed depreciation is recaptured at up to 25%, and gains may owe capital-gains tax (a 1031 exchange can defer both). Figures are a year-1 estimate at your 24.0% rate — not tax advice; consult a CPA.
Schools (NCES district)
- District
- Merced Union High
- NCES district ID
- 0624660
- Math proficiency
- 20% ▲ 3.00%
- Reading proficiency
- 46% ▼ -1.00%
- Median HH income
- $44,977
- Composite
- 28.11/100
- National rank
- #6823
- State rank
- #301 of 517 in CA
Livability — Merced
- Score
- 73/100
- State rank
- #153
- US rank
- #5111
Category grades
Schools grade is shown separately in the Schools card above.
Census & demographics
- Census place
- Merced, CA
- County
- Merced County · 205,386 people
- City population
- 112,228
- Metro
- Merced, CA
- Population (ZIP)
- 36,385
- Household income
- $57,342
- Rent vs Own
- Severe rent burden
- 1419.0
Population outlook (Merced County) Hauer SSP2
- Today (2025)
- 285,501 people
- By 2030
- 293,437 · +2.8%
- By 2040
- 308,808 · +8.2%
- By 2050
- 321,011 · +12.4%
- By 2075
- 338,497 · +18.6%
- By 2100
- 330,493 · +15.8%
Race, ethnicity, and origin ACS 2023
- Neighborhood character
- Predominantly Hispanic (73%)
- Race & ethnicity
- Hispanic / Latino 73% White 12% Two or more races 11% Asian 8% Black 3%
- Hispanic origin (detail)
- Mexican 70%
- Common ancestry
- Russian 2%
- Foreign-born
- 30% · Canada
- Languages at home
- 37% English-only · Spanish 55% Other Asian/Pacific 6% Other Indo-European 1%
Political lean MEDSL · Merced
- 2024 margin
- Toss-up / Even · D 46.5% · R 50.9% · Other 2.6%
- 2008→2024 swing
- -12.7pp toward R · 2008: 8.3pp · 2024: -4.4pp
- All cycles
- 2024: R+4.4 2020: D+10.6 2016: D+7.9 2012: D+5.4 2008: D+8.3
Not yet ingested
- Civics
- —
Market trends
- HPI YoY
- ▼ -129.65%
- Current HPI
- 314.4223
- Rent YoY
- ▲ 1.68%
- Metro
- Merced, CA
- State GDP YoY
- ▲ 3.21%
- F500 in state
- 116
Industry mix (Fortune 500 HQ in CA)
| Industry | F500 HQs | Revenue |
|---|---|---|
| Technology | 27 | $1,492B |
|
||
| Financial Services | 3 | $174B |
|
||
| Retail | 3 | $44B |
|
||
| Insurance | 3 | $26B |
|
||
| Media / Entertainment | 2 | $115B |
|
||
| Pharmaceuticals / Biotech | 2 | $62B |
|
||
Cash-flow waterfall
monthlySold comps — $/sqft
last 12 mo · ≤1 miLoading sold comps…