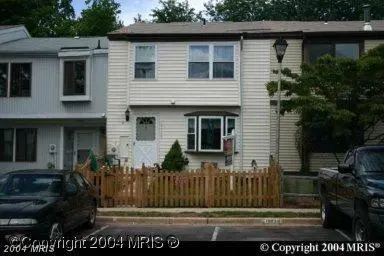
19740 Wootton Ave · Poolesville, MD
Flood risk 1/10 · Minimal
- FEMA flood zone
- X (unshaded)
- Chance of flooding over 30 yrs
- 0.0%
- Est. flood insurance / yr
- $507 – $1,088
Fire risk 1/10 · Minimal
- Est. fire insurance / yr
- $755 – $1,403
Heat risk 6/10 · Moderate
- Hot days now (above 103°F)
- 7 days/yr
- Hot days in 30 yrs
- 16 days/yr
Wind risk 4/10 · Minor
- Chance of severe wind over 30 yrs
- 11.0%
Air-quality risk 3/10 · Minor
- Unhealthy air days now
- 2 days/yr
- Unhealthy air days in 30 yrs
- 3 days/yr
Risk factors via First Street. Map © Google.
Why this score? — see what drove the D grade
The composite is a weighted blend of 9 inputs, each scored 0–100. Each bar is that input's sub-score; the figure is the points it added to the 100-point composite (weight × sub-score).
- Cash flow +13.0/30.0
- ARV discount +10.8/15.0
- DSCR +3.9/10.0
- 1% rule +3.8/10.0
- Schools +3.6/10.0
- Livability +3.5/5.0
- Rent growth +2.5/5.0
- Condition / age +2.5/5.0
- Appreciation +0.0/10.0
$320,000
🖨 Deal sheet (PDF) 📄 Offer letter ✓ Due diligence
Listing remarks MLS
Beautiful townhome!! Updated kitchen with eat-in area and bay window!! Roof, HVAC, hot water heater, all done within two years. Fully fenced yard with your own private oasis in rear yard, with patio and deck area for your outdoor cooking needs! Large shed with electric. This home has been very well maintained, you will not be disappointed!! Open House Sat 2-5 Aug. 7th
Key facts
- $150 HOA
- Built 1973
- Listed 51 days
Property features AI
Finance
- HOA & community: HOA fee $150 per month
Exterior
- Parking: Parking lot
- Utilities: Public water; Public sewer; Electric cooling fuel; Natural gas hot water
- Home design: Interior townhouse/rowhouse; Fee simple ownership; Above-grade finished living space (estimated 1,413)
- Construction: Aluminum siding; Concrete perimeter foundation; Above grade structure
- Exterior features: Not in a federal flood zone; Turn into parking lot (directions)
Interior
- Bedrooms: Four bedrooms on the upper level
- Bathrooms: Two full bathrooms; One half bathroom
- Heating & cooling: Central heating; Central air conditioning; Hot water heated by natural gas
- Interior features: Estimated living area; No basement
Neighborhood map
What this means for you Summary
Snapshot
- This is a 4-bed/2.5-bath townhouse listed at $320k.
Deal economics
- At list price, monthly cash flow is $-19 ($-229/yr) — negative.
- To cash-flow at today's rent, offer at most $317k (1.1% below list).
- To meet the 1% rule (rent ≥ 1% of price), the offer needs to be $280k (12.5% below list).
- Recommended offer: $280k (12.5% below list) — sets the bar for 1% rule.
- Cap rate 6.2% vs local median 1.0% in Poolesville — top-decile yield for the area; either an underpriced asset or a hidden risk that comps aren't pricing in. Stress-test before assuming the spread holds.
Location & tenants
- Location reads 70/100 on livability (#169 in MD) — a middle-class / working-renter tenant base. Strengths: crime A+, employment A+, housing A+; Watch: amenities D-, commute F, cost of living F.
- Montgomery County Public Schools (suburban): math 27% / reading 45% proficiency, ranked #3 of 24 in MD (top 12%) — families likely to look elsewhere, expect single-tenant / working-renter base with shorter leases.
- Zoned schools: Poolesville Elementary (math 45% / reading 45%, grade D-, #62 of 860 statewide, top 8%, 567 students, 20% FRL); John H. Poole Middle (math 23% / reading 61%, grade D-, #19 of 225 statewide, top 8%, 443 students, 18% FRL); Poolesville High (math 86% / reading 89%, grade A, #8 of 222 statewide, top 4%, 1,309 students, 12% FRL).
- Zoned-school proficiency averages 58% at this address vs 36% district-wide (+22 pts) — the actual schools serving this property are materially stronger than the Montgomery County Public Schools average implies; a family-tenant draw the district grade alone would hide.
- Market conditions: 47 active listings in the ZIP; 1 comparable units currently listed for rent nearby; 3,880 units permitted in Montgomery County in 2024 (2,054 in 5+ unit buildings).
Forward outlook
- Local home prices are declining (-3.0%/yr); year-one equity from $2k of loan paydown is wiped out by about $10k of value loss. Plan a longer hold.
- Montgomery County population projected at +27% by 2050 — long-run rental-demand tailwind backs the buy-and-hold thesis.
Negotiation context
- It's been on market 52 days — a 3% lower offer ($310k) is reasonable based on typical stale-listing flexibility.
- 2 sale attempts since 31y ago; this cycle's ask is 78% above the opening price — seller raised mid-cycle; expect resistance to lowballs.
- Current owner paid $184k; list at $320k implies a 74% gain — meaningful room to come down on a strong offer.
Risks & watch-outs
- Climate carrying-cost: extreme-heat days projected 7→16/yr by 2055 (HVAC capex compounding) — expect insurance premiums to compound above CPI over the hold.
Questions for the listing agent
- What do current leases actually rent for vs. the listed asking? Can we see a recent rent roll and the last 12 months of T-12 income?
- It's been on market 52 days. Have you received any prior offers? Is the seller open to a 12% concession, seller financing, or rate buy-down credit?
- Built in 1973 — when were the roof, HVAC, electrical panel, plumbing, and water heater last replaced?
- What does the HOA fee cover, when was the last increase, and are there any pending special assessments or reserve-fund shortfalls?
- Is there a deadline driving the sale (1031 exchange, divorce, estate, relocation)? That informs how much negotiation room exists.
- Schools are A-rated — typically a magnet for longer-tenancy family renters. What's the average tenant stay here, and is there a school-zone premium baked into asking?
- The area grade is low — what's the realistic commute time and amenity access for the typical tenant pool here? Any planned neighborhood developments (good or bad) we should know about?
- What's the average days-on-market for RENTAL listings here right now (not sales)? A rising rental-DOM trend means longer vacancies and softer asking-rent achievability than the comps imply.
- What's the recent tenant-quality profile in this submarket — average credit score on applications, eviction rate, late-payment / NSF rate, and stable-employment percentage? A property-management company in the area should have these aggregated.
- How much new for-sale + rental construction is in the pipeline within 1–3 miles? Heavy new supply typically softens prices + rents 12–24 months out; constrained supply supports both.
Investment metrics
- 1% rule
- 0.88% ✗
- Cap rate
- 6.22%
- Cash-on-cash
- -0.26%
- DSCR
- 0.99
- GRM
- 9.5
CMA / ARV
- ARV (median comp)
- $345,079
- List price
- $320,000
- Delta
- -7.27%
- Verdict
- FAIR
- Comps
- 20 within 1.0 mi
Show comp detail 12 sales within ~0.75 mi
| Address | Dist | Beds/Ba | Sqft | Sold | Price | $/sf | Match |
|---|---|---|---|---|---|---|---|
| 19728 Wootton Ave | 0.02mi | 3/2.5 (-1) | 1,413 (0%) | 2mo | $372,500 | $264 | 92 |
| 19656 Wootton Ave | 0.19mi | 3/2.5 (-1) | 1,413 (0%) | 3mo | $240,000 | $170 | 84 |
| 17422 Hughes Rd | 0.13mi | 3/2.5 (-1) | 1,413 (0%) | 7mo | $355,000 | $251 | 83 |
| 17422 Hoskinson Rd | 0.09mi | 4/2.5 | 1,400 (-1%) | 14mo | $374,750 | $268 | 83 |
| 19724 Wootton Ave | 0.03mi | 3/2.5 (-1) | 1,349 (-4%) | 7mo | $354,000 | $262 | 80 |
| 17500 Hoskinson Rd | 0.07mi | 3/2.5 (-1) | 1,349 (-4%) | 6mo | $320,000 | $237 | 79 |
| 17413 Hoskinson Rd | 0.12mi | 3/2.5 (-1) | 1,317 (-7%) | 1mo | $325,000 | $247 | 77 |
| 17425 Hughes Rd | 0.18mi | 3/2.5 (-1) | 1,317 (-7%) | 3mo | $356,100 | $270 | 72 |
| 17427 Hughes Rd | 0.18mi | 3/2.5 (-1) | 1,237 (-12%) | 12mo | $213,000 | $172 | 55 |
| 17500 Kohlhoss Rd | 0.36mi | 3/2.5 (-1) | 1,588 (+12%) | 10mo | $374,900 | $236 | 49 |
| 17615 Kohlhoss Rd | 0.44mi | 3/2.5 (-1) | 1,600 (+13%) | 9mo | $335,000 | $209 | 45 |
| 17617 Kohlhoss Rd | 0.44mi | 3/1.5 (-1) | 1,620 (+15%) | 9mo | $365,000 | $225 | 39 |
Match score weights: distance 35% · size 25% · config 20% · recency 20%. Top-matched comps best support the ARV.
Projected returns pro-forma
-3.0% appreciation · 3.0% rent growth · sell at horizon
- IRR
- -16.7%
- Equity multiple
- 0.41×
- Total profit
- $-53,016
- Equity at exit
- $47,713
- IRR
- -8.5%
- Equity multiple
- 0.47×
- Total profit
- $-47,511
- Equity at exit
- $27,668
Cash invested: $89,600 (down + closing). Projections, not guarantees.
Landlord ↔ Tenant lean methodology
- Overall (STATE)
- 27 Tenant-Leaning
- State Maryland
- 27 Tenant-Leaning · D+14
- County
- — inherits STATE
- City
- — inherits STATE
ZIP-level market 20837
- Home prices YoY
- -34.2%
- Active inventory
- 47
- Price-to-rent
- 9.5×
Monthly cashflow live
- Estimated rent
- $2,800 medium interval (Pro) →
- Mortgage (P&I)
- −$1,678
- Tax from tax record
- −$270 /mo · $3,236/yr
- Insurance
- −$133
- HOA
- −$150
- Vacancy / Maint / Mgmt
- −$588
- Net cashflow
- $-19
Break-even live
Sensitivity live
| Price | -10% $162 | -5% $71 | +0% $-19 | +5% $-110 | +10% $-200 |
|---|---|---|---|---|---|
| Rent | -10% $-240 | -5% $-130 | +0% $-19 | +5% $92 | +10% $202 |
| Rate | -1.0pp $142 | -0.5pp $62 | base $-19 | +0.5pp $-102 | +1.0pp $-186 |
UW: 25.0% down · 7.5% · 30yr · 1.5% tax · 5.0% vac · 8.0% maint · 8.0% mgmt
Financing live
Cash to close
- Down payment
- $80,000
- Closing costs
- $9,600
- Reserves months
- —
- Total cash needed
- —
Loan-product check · same deal, 3 products live
Conventional
25% down · 7.5% · 30yr
- Down + closing
- —
- Monthly P&I
- —
- Monthly cashflow
- —
- DSCR
- —
- Eligible?
- —
Personal DTI + credit; lowest rate.
DSCR
20% down · 8.5% · 30yr
- Down + closing
- —
- Monthly P&I
- —
- Monthly cashflow
- —
- DSCR
- —
- Eligible?
- —
No personal income docs; deal must DSCR.
Hard money
10% down · 12.0% · 12mo
- Down + closing
- —
- Monthly P&I
- —
- Monthly cashflow
- —
- DSCR
- —
- Eligible?
- —
Short-term bridge; refi at stabilization.
Rent comps 1 comps
| Address | Beds | Baths | Sqft | Rent | $/sqft | DOM | Units | Dist |
|---|---|---|---|---|---|---|---|---|
| 18600 Jerusalem Church Rd Poolesville, MD | 4.0 | 3.0 | 1150 | $2,800 | $2.43 | 26d | 1 | 1.25mi |
HOA detail
- Monthly dues
- $150 · $1,800/yr
- Likely covers
- waterelectric
Listing history 23 events
-
2026-06-21days on market $320,000 Coming Soon 52 DOM
-
2026-06-18days on market $320,000 Coming Soon 49 DOM
-
2026-06-17days on market $320,000 Coming Soon 48 DOM
-
2026-06-16days on market $320,000 Coming Soon 47 DOM
-
2026-06-15days on market $320,000 Coming Soon 46 DOM
-
2026-06-13days on market $320,000 Coming Soon 44 DOM
-
2026-06-09days on market $320,000 Coming Soon 40 DOM
-
2026-06-08days on market $320,000 Coming Soon 39 DOM
-
2026-06-07days on market $320,000 Coming Soon 38 DOM
-
2026-06-03days on market $320,000 Coming Soon 34 DOM
-
2026-06-02days on market $320,000 Coming Soon 33 DOM
-
2026-06-01days on market $320,000 Coming Soon 32 DOM
-
2026-05-31days on market $320,000 Coming Soon 31 DOM
-
2026-05-01historical $320,000
-
2004-11-12soldstatus $184,000
-
2004-09-07soldstatus $184,000 370-char remark
Show marketing remark (370 chars)
Beautiful townhome!! Updated kitchen with eat-in area and bay window!! Roof, HVAC, hot water heater, all done within two years. Fully fenced yard with your own private oasis in rear yard, with patio and deck area for your outdoor cooking needs! Large shed with electric. This home has been very well maintained, you will not be disappointed!! Open House Sat 2-5 Aug. 7th
-
2004-08-08historical 370-char remark
Show marketing remark (370 chars)
Beautiful townhome!! Updated kitchen with eat-in area and bay window!! Roof, HVAC, hot water heater, all done within two years. Fully fenced yard with your own private oasis in rear yard, with patio and deck area for your outdoor cooking needs! Large shed with electric. This home has been very well maintained, you will not be disappointed!! Open House Sat 2-5 Aug. 7th
-
2004-08-05$180,000 370-char remark
Show marketing remark (370 chars)
Beautiful townhome!! Updated kitchen with eat-in area and bay window!! Roof, HVAC, hot water heater, all done within two years. Fully fenced yard with your own private oasis in rear yard, with patio and deck area for your outdoor cooking needs! Large shed with electric. This home has been very well maintained, you will not be disappointed!! Open House Sat 2-5 Aug. 7th
-
1996-05-06soldstatus $95,000
-
1996-04-30soldstatus $95,000
-
1996-02-27soldstatus $48,000
-
1995-04-10$98,000
-
1995-04-10historical
ⓘ Source: listings_history table (triggers on properties + properties_extension) + one-shot
backfill from property_details.listing_events for pre-trigger history.
Tax reassessment forecast MD · Partial reset (capped growth)
- Current annual tax
- $3,236 · $270/mo
- Projected year-2 tax
- $3,362 · $280/mo
- Expected delta
- +$126/yr (+$11/mo · 3.9%)
ⓘ Screening estimate from a state-policy table — verify with the county assessor before closing.
Climate risk First Street
- Flood 1/10 Low FEMA zone X (unshaded) · 0% chance over 30 yrs
- Wildfire 1/10 Low
- Heat 6/10 Major 7 d/yr ≥103°F today · 16 d/yr by 30 yrs out
- Wind 4/10 Moderate 11% chance of damaging wind over 30 yrs
- Air quality 3/10 Moderate 2 unhealthy d/yr today · 3 by 30 yrs out
Nearby sold comps map
Loading sold comps map…
Walkable amenities ~0.75 mi
Loading nearby amenities…
Taxation est. · year 1
- Rental income
- $33,600
- − Mortgage interest
- −$17,925
- − Property taxes
- −$3,236
- − Insurance
- −$1,600
- − Repairs & maintenance
- −$2,688
- − Management
- −$2,688
- − HOA
- −$1,800
- − Depreciation
- −$9,309
- Taxable loss
- −$5,646
- Est. tax savings @ 24.0%
- +$1,355
- After-tax cash flow
- $1,126/yr
For passive investors: Depreciation is non-cash, so a rental often shows a tax loss while cash-flowing — sheltering income. Rental losses are passive: they offset passive income freely, and up to $25,000/yr can offset ordinary (W-2) income if you actively participate and your MAGI is under $100k (phasing out to $0 by $150k); unused losses carry forward. On sale, claimed depreciation is recaptured at up to 25%, and gains may owe capital-gains tax (a 1031 exchange can defer both). Figures are a year-1 estimate at your 24.0% rate — not tax advice; consult a CPA.
Schools (NCES district)
- District
- Montgomery County Public Schools
- NCES district ID
- 2400480
- Math proficiency
- 27% ▼ -21.00%
- Reading proficiency
- 45% ▼ -10.00%
- Median HH income
- $97,191
- Composite
- 35.62/100
- National rank
- #4889
- State rank
- #3 of 24 in MD
Livability — Poolesville
- Score
- 70/100
- State rank
- #169
- US rank
- #7582
Category grades
Schools grade is shown separately in the Schools card above.
Census & demographics
- Census place
- Poolesville, MD
- Population (ZIP)
- 6,605
Population outlook (Montgomery County) Hauer SSP2
- Today (2025)
- 1,173,231 people
- By 2030
- 1,237,402 · +5.5%
- By 2040
- 1,365,115 · +16.4%
- By 2050
- 1,491,592 · +27.1%
- By 2075
- 1,803,893 · +53.8%
- By 2100
- 2,035,619 · +73.5%
Race, ethnicity, and origin ACS 2023
- Neighborhood character
- Predominantly White (72%)
- Race & ethnicity
- White 72% Hispanic / Latino 12% Two or more races 9% Asian 9% Black 3%
- Hispanic origin (detail)
- Mexican 2% Salvadoran 4%
- Common ancestry
- Slovak 4% Serbian 3% Lithuanian 3%
- Foreign-born
- 15% · Canada, Dominican Republic, China
- Languages at home
- 80% English-only · Spanish 9% Tagalog/Filipino 6% Other Indo-European 2%
Political lean MEDSL · Montgomery
- 2024 margin
- Solid D (+53.3) · D 75.2% · R 21.9% · Other 2.9%
- 2008→2024 swing
- +8.7pp toward D · 2008: 44.6pp · 2024: 53.3pp
- All cycles
- 2024: D+53.3 2020: D+59.6 2016: D+55.5 2012: D+43.4 2008: D+44.6
Not yet ingested
- Civics
- —
Market trends
- HPI YoY
- ▼ -138.58%
- Current HPI
- 266.7175
- Rent YoY
- —
- Metro
- —
- State GDP YoY
- ▲ 2.97%
- F500 in state
- 12
Industry mix (Fortune 500 HQ in MD)
| Industry | F500 HQs | Revenue |
|---|---|---|
| Aerospace / Defense | 1 | $71B |
|
||
| Utilities | 1 | $25B |
|
||
| Hotels | 1 | $24B |
|
||
| Consumer Goods | 1 | $7B |
|
||
| Real Estate | 1 | $6B |
|
||
| Chemicals | 1 | $2B |
|
||
Price history
+226.5% since first listed10 events — show timeline
- 2026-05-01 Coming Soon $320,000 BRIGHT MLS
- 2004-11-12 Sold (Public Records) $184,000 Public Records
- 2004-09-07 Sold (MLS) $184,000 MRIS
- 2004-08-08 Delisted — MRIS
- 2004-08-05 Listed $180,000 MRIS
- 1996-05-06 Sold (Public Records) $95,000 Public Records
- 1996-04-30 Sold (MLS) $95,000 MRIS
- 1996-02-27 Sold (Public Records) $48,000 Public Records
- 1995-04-10 Listed $98,000 MRIS
- 1995-04-10 Delisted — MRIS
Property tax history
+4.9%/yrLatest (2025): $3,236 · +11.0% YoY. Source: county tax records.
Cash-flow waterfall
monthlySold comps — $/sqft
last 12 mo · ≤1 miLoading sold comps…