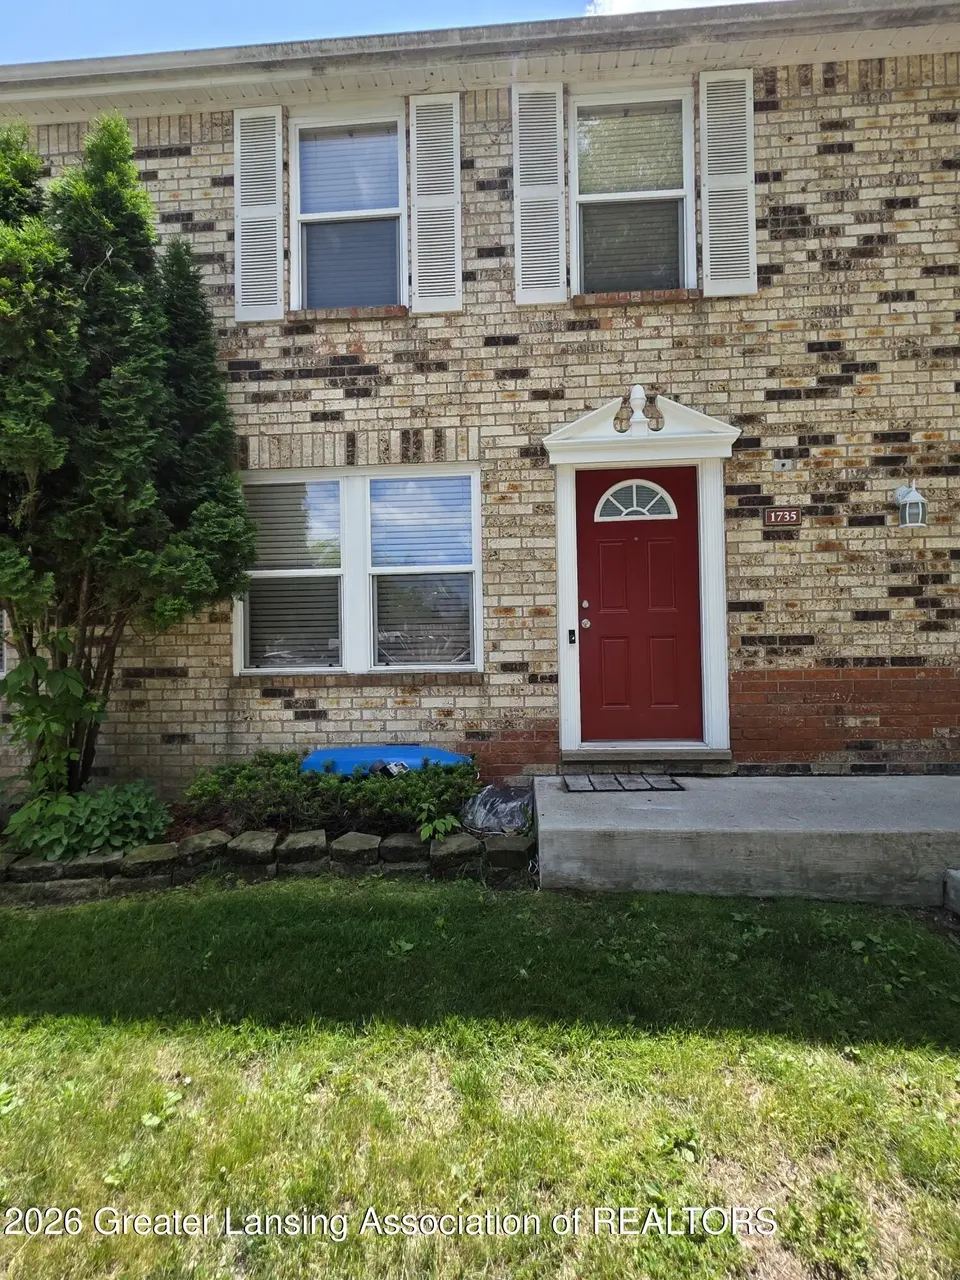
1735 Maisonette Dr · Lansing, MI
Flood risk 1/10 · Minimal
- FEMA flood zone
- X (unshaded)
- Chance of flooding over 30 yrs
- 0.0%
- Est. flood insurance / yr
- $473 – $860
Fire risk 1/10 · Minimal
- Est. fire insurance / yr
- $784 – $1,456
Heat risk 2/10 · Minimal
- Hot days now (above 97°F)
- 7 days/yr
- Hot days in 30 yrs
- 15 days/yr
Wind risk 2/10 · Minimal
- Chance of severe wind over 30 yrs
- —
Air-quality risk 2/10 · Minimal
- Unhealthy air days now
- 1 days/yr
- Unhealthy air days in 30 yrs
- 2 days/yr
Risk factors via First Street. Map © Google.
Why this score? — see what drove the F grade
The composite is a weighted blend of 9 inputs, each scored 0–100. Each bar is that input's sub-score; the figure is the points it added to the 100-point composite (weight × sub-score).
- ARV discount +7.5/15.0
- Cash flow +6.8/30.0
- 1% rule +5.0/10.0
- Rent growth +5.0/5.0
- Livability +4.0/5.0
- Condition / age +2.5/5.0
- Schools +1.9/10.0
- DSCR +1.1/10.0
- Appreciation +0.0/10.0
$106,900
🖨 Deal sheet (PDF) 📄 Offer letter ✓ Due diligence
Listing remarks MLS
Welcome to your new townhome located in the Eden Glen Complex! This well-maintained 2 bedroom 1.5 bath condo is already furnished with appliances and is in move-in ready condition. It has an open floor plan, space in the basement to entertain and its location is near the highways, food, shopping, entertainment, public transportation and is not far from downtown Lansing or MSU's campus.
Key facts
- Open floor plan
- Eden glen complex
- Near highways
Tags
Property features AI
Finance
- Other: Subdivision: Eden Glen; Current use: Primary
- HOA & community: Part of Eden Glen association; Monthly association fee of $240; Association covers water, sewer, lawn care, snow removal, exterior maintenance; Association amenities include insurance, grounds and structure maintenance, snow removal, and water
Exterior
- Parking: Asphalt parking
- Utilities: Public sewer; Circuit breaker electric; Cable available
- Home design: Colonial style; Two levels; Faces south
- Construction: Built in 1976; Brick and vinyl siding exterior; Shingle roof; Block foundation
- Exterior features: Private fenced pool; Patio; Porch; Community pool; Community sidewalks; Paved road frontage
Interior
- Kitchen: Dishwasher; Disposal; Oven; Range; Refrigerator
- Bedrooms: 2 bedrooms (Primary Bedroom included)
- Flooring: Other
- Bathrooms: 1 full bath and 1 half bath
- Heating & cooling: Forced air heating (natural gas); Central air conditioning
- Interior features: Entry located on Scotmar; Full basement
- Laundry & utility: Washer hookup on lower level; Electric dryer hookup on lower level
Neighborhood map
What this means for you Summary
Snapshot
- This is a 2-bed/1.5-bath condo listed at $107k.
Deal economics
- At list price, monthly cash flow is $-165 ($-2k/yr) — negative.
- To cash-flow at today's rent, offer at most $78k (27.3% below list).
- Meets the 1% rule at list price ($1k rent vs $107k).
- Recommended offer: $78k (27.3% below list) — sets the bar for cash-flow.
- Cap rate 4.4% vs local median 6.0% in Lansing — below-typical yield; the buyer is paying a premium for something (appreciation thesis, condition, location) that the cap rate doesn't capture.
Location & tenants
- Location reads 79/100 on livability (#94 in MI, #2,182 nationally) — a middle-class / working-renter tenant base. Strengths: amenities A+, commute A+, cost of living A+; Watch: employment D, crime F.
- Lansing Public School District (urban): math 14% / reading 23% proficiency, ranked #650 of 760 in MI (top 86%) — low school quality limits family demand, transient renter base, plan for 1-2y turnover; 68% free/reduced lunch — lower-income household profile, screen leases tightly.
- Zoned schools: Cavanaugh School (315 students, 89% FRL); Attwood School (193 students, 88% FRL) — zoned schools average 88% FRL vs 68% district-wide (21 pts higher); higher-poverty schools than district average — tighter screening recommended.
- Market conditions: Rents rising fast (+9.9%/yr); 146 active listings in the ZIP; 19 comparable units currently listed for rent nearby; rentals at typical pace (median 15d on market — plan ~3-4 weeks tenant-placement turnaround); 350 units permitted in Ingham County in 2024 (186 in 5+ unit buildings).
Forward outlook
- Local home prices are declining (-3.0%/yr); year-one equity from $739 of loan paydown is wiped out by about $3k of value loss. Plan a longer hold.
- Ingham County population projected at +11% by 2050 — modest demand growth; plan on rents tracking national, not racing it.
Negotiation context
- Only 12 days on market — expect competitive offers; lowballing is unlikely to land.
- 4 sale attempts since 5y ago with the ask held roughly flat each time — persistent listings suggest the price (not the market) is what's stuck; bring a comps-based counter.
- Current owner paid $50k; list at $107k implies a 114% gain — meaningful room to come down on a strong offer.
Risks & watch-outs
- Watch-outs: HOA is 22% of rent.
Questions for the listing agent
- What do current leases actually rent for vs. the listed asking? Can we see a recent rent roll and the last 12 months of T-12 income?
- Built in 1976 — when were the roof, HVAC, electrical panel, plumbing, and water heater last replaced?
- What does the HOA fee cover, when was the last increase, and are there any pending special assessments or reserve-fund shortfalls?
- Any open or pending special assessments — roof, HVAC, plumbing, elevator, façade? What's the per-unit balance and payoff schedule, and is the seller paying it off at close or rolling it to the buyer?
- Is there a deadline driving the sale (1031 exchange, divorce, estate, relocation)? That informs how much negotiation room exists.
- Schools are F-rated, which usually means shorter tenancies and higher turnover. Who's the typical renter profile here, and what's been the actual vacancy rate?
- Crime grade is F in this area — have there been break-ins, vandalism, or insurance claims at this property in the last 3 years? What carrier currently insures it and at what premium?
- The area grade is low — what's the realistic commute time and amenity access for the typical tenant pool here? Any planned neighborhood developments (good or bad) we should know about?
- What's the average days-on-market for RENTAL listings here right now (not sales)? A rising rental-DOM trend means longer vacancies and softer asking-rent achievability than the comps imply.
- What's the recent tenant-quality profile in this submarket — average credit score on applications, eviction rate, late-payment / NSF rate, and stable-employment percentage? A property-management company in the area should have these aggregated.
- How much new apartment / multifamily construction is in the pipeline within 1–3 miles? Heavy new supply (>2% of stock underway) typically softens rents 12–24 months out; light construction supports rent growth.
Investment metrics
- 1% rule
- 1.00% ✓
- Cap rate
- 4.44%
- Cash-on-cash
- -6.61%
- DSCR
- 0.71
- GRM
- 8.3
CMA / ARV
No comps found within radius.
Projected returns pro-forma
-3.0% appreciation · 8.0% rent growth · sell at horizon
- IRR
- -19.9%
- Equity multiple
- 0.27×
- Total profit
- $-21,986
- Equity at exit
- $15,939
- IRR
- -2.4%
- Equity multiple
- 0.79×
- Total profit
- $-6,166
- Equity at exit
- $9,243
Cash invested: $29,932 (down + closing). Projections, not guarantees.
Landlord ↔ Tenant lean methodology
- Overall (STATE)
- 62 Landlord-Friendly
- State Michigan
- 62 Landlord-Friendly · EVEN
- County
- — inherits STATE
- City
- — inherits STATE
ZIP-level market 48911
- Rents YoY
- 9.9%
- Active inventory
- 146
- Price-to-rent
- 8.3×
Monthly cashflow live
- Estimated rent
- $1,071 high interval (Pro) →
- Mortgage (P&I)
- −$561
- Tax from tax record
- −$166 /mo · $1,992/yr
- Insurance
- −$45
- HOA
- −$240
- Vacancy / Maint / Mgmt
- −$225
- Net cashflow
- $-165
Break-even live
Sensitivity live
| Price | -10% $-104 | -5% $-135 | +0% $-165 | +5% $-195 | +10% $-225 |
|---|---|---|---|---|---|
| Rent | -10% $-250 | -5% $-207 | +0% $-165 | +5% $-123 | +10% $-80 |
| Rate | -1.0pp $-111 | -0.5pp $-138 | base $-165 | +0.5pp $-193 | +1.0pp $-221 |
UW: 25.0% down · 7.5% · 30yr · 1.5% tax · 5.0% vac · 8.0% maint · 8.0% mgmt
Financing live
Cash to close
- Down payment
- $26,725
- Closing costs
- $3,207
- Reserves months
- —
- Total cash needed
- —
Loan-product check · same deal, 3 products live
Conventional
25% down · 7.5% · 30yr
- Down + closing
- —
- Monthly P&I
- —
- Monthly cashflow
- —
- DSCR
- —
- Eligible?
- —
Personal DTI + credit; lowest rate.
DSCR
20% down · 8.5% · 30yr
- Down + closing
- —
- Monthly P&I
- —
- Monthly cashflow
- —
- DSCR
- —
- Eligible?
- —
No personal income docs; deal must DSCR.
Hard money
10% down · 12.0% · 12mo
- Down + closing
- —
- Monthly P&I
- —
- Monthly cashflow
- —
- DSCR
- —
- Eligible?
- —
Short-term bridge; refi at stabilization.
Rent comps 19 comps
| Address | Beds | Baths | Sqft | Rent | $/sqft | DOM | Units | Dist |
|---|---|---|---|---|---|---|---|---|
| 6129 Beechfield Dr Lansing, MI | 1.0–2.0 | 1.0 | 894 | $1,100 | $1.23 | 15d | 1 | 0.27mi |
| 814 Louisa St Lansing, MI | 2.0 | 1.0 | 850 | $950 | $1.12 | 15d | 2 | 0.88mi |
| 900 Long Blvd Lansing, MI | 1.0–3.0 | 1.0–1.5 | 1013 | $1,195 | $1.18 | 15d | 21 | 0.96mi |
| 5521 Joshua St Unit ST-102 Lansing, MI | 2.0 | 1.0 | 812 | $975 | $1.20 | 45d | 1 | 0.97mi |
| 5540 Kaynorth Rd Unit 4 Lansing, MI | 2.0 | 1.0 | 745 | $925 | $1.24 | 45d | 1 | 1.17mi |
| 2342 Aurelius Rd Holt, MI | 1.0 | 1.0 | 750 | $975 | $1.30 | 15d | 1 | 1.17mi |
| 2342 N Aurelius Rd Apt 9 Holt, MI | 1.0 | 1.0 | 750 | $975 | $1.30 | 22d | 1 | 1.17mi |
| 2301 E Jolly Rd Lansing, MI | 1.0–2.0 | 1.0–1.5 | 1045 | $1,440 | $1.38 | 15d | 10 | 1.22mi |
| 315 E Edgewood Blvd Lansing, MI | 2.0 | 1.0 | 615 | $1,245 | $2.02 | 15d | 14 | 1.23mi |
| 910 E Jolly Rd #2 Lansing, MI | 1.0–2.0 | 1.0 | 625 | $895 | $1.43 | 22d | 2 | 1.25mi |
| 909 E Jolly Rd Lansing, MI | 1.0 | 1.0 | 700 | $700 | $1.00 | 45d | 1 | 1.28mi |
| 4612 Tolland Ave Unit 4612 Holt, MI | 2.0 | 1.0 | 927 | $1,325 | $1.43 | 15d | 1 | 1.29mi |
| 2294 Main St Holt, MI | 2.0 | 1.0 | 869 | $999 | $1.15 | 15d | 1 | 1.29mi |
| 2305 E Jolly Rd Unit 2401-09 Lansing, MI | 1.0 | 1.0 | 790 | $1,185 | $1.50 | 15d | 1 | 1.31mi |
| 2305 E Jolly Rd Unit 2401-14 Lansing, MI | 1.0 | 1.0 | 790 | $1,025 | $1.30 | 15d | 1 | 1.31mi |
| 2305 E Jolly Rd Unit 2401-22 Lansing, MI | 1.0 | 1.0 | 790 | $1,185 | $1.50 | 45d | 1 | 1.31mi |
| 2305 E Jolly Rd Unit 2401-21 Lansing, MI | 2.0 | 1.5 | 830 | $1,315 | $1.58 | 15d | 1 | 1.31mi |
| 4330 Keller Rd Holt, MI | 1.0–2.0 | 1.0 | 462 | $1,150 | $2.49 | 15d | 1 | 1.34mi |
| 645 E Jolly Rd Lansing, MI | 1.0–2.0 | 1.0 | 775 | $825 | $1.06 | 45d | 1 | 1.41mi |
HOA detail condo
- Monthly dues
- $240 · $2,880/yr
- Assessments
- None detected in remarks — confirm with the listing agent.
Listing history 9 events
-
2026-06-21days on market $106,900 Active 12 DOM
-
2026-06-18days on market $106,900 Active 9 DOM
-
2026-06-17days on market $106,900 Active 8 DOM
-
2026-06-16days on market $106,900 Active 7 DOM
-
2026-06-15days on market $106,900 Active 6 DOM
-
2026-06-14days on market $106,900 Active 4 DOM
-
2026-06-13days on market $106,900 Active 3 DOM
-
2026-06-10remarks 388-char remark
-
2026-06-10$106,900 Active 1 DOM
ⓘ Source: listings_history table (triggers on properties + properties_extension) + one-shot
backfill from property_details.listing_events for pre-trigger history.
Tax reassessment forecast MI · Partial reset (capped growth)
- Current annual tax
- $1,992 · $166/mo
- Projected year-2 tax
- $1,992 · $166/mo
- Expected delta
- $0/yr ($0/mo · 0.0%)
ⓘ Screening estimate from a state-policy table — verify with the county assessor before closing.
Climate risk First Street
- Flood 1/10 Low FEMA zone X (unshaded) · 0% chance over 30 yrs
- Wildfire 1/10 Low
- Heat 2/10 Low 7 d/yr ≥97°F today · 15 d/yr by 30 yrs out
- Wind 2/10 Low
- Air quality 2/10 Low 1 unhealthy d/yr today · 2 by 30 yrs out
Nearby sold comps map
Loading sold comps map…
Walkable amenities ~0.75 mi
Loading nearby amenities…
Taxation est. · year 1
- Rental income
- $12,853
- − Mortgage interest
- −$5,988
- − Property taxes
- −$1,992
- − Insurance
- −$534
- − Repairs & maintenance
- −$1,028
- − Management
- −$1,028
- − HOA
- −$2,880
- − Depreciation
- −$3,110
- Taxable loss
- −$3,708
- Est. tax savings @ 24.0%
- +$890
- After-tax cash flow
- $-1,090/yr
For passive investors: Depreciation is non-cash, so a rental often shows a tax loss while cash-flowing — sheltering income. Rental losses are passive: they offset passive income freely, and up to $25,000/yr can offset ordinary (W-2) income if you actively participate and your MAGI is under $100k (phasing out to $0 by $150k); unused losses carry forward. On sale, claimed depreciation is recaptured at up to 25%, and gains may owe capital-gains tax (a 1031 exchange can defer both). Figures are a year-1 estimate at your 24.0% rate — not tax advice; consult a CPA.
Schools (NCES district)
- District
- Lansing Public School District
- NCES district ID
- 2621150
- Math proficiency
- 14% ▲ 1.00%
- Reading proficiency
- 23% ▲ 3.00%
- Median HH income
- $37,453
- Composite
- 18.76/100
- National rank
- #14002
- State rank
- #650 of 760 in MI
Livability — Lansing
- Score
- 79/100
- State rank
- #94
- US rank
- #2182
Category grades
Schools grade is shown separately in the Schools card above.
Census & demographics
- Census place
- Lansing, MI
- County
- Ingham County · 237,052 people
- City population
- 161,269
- Metro
- Lansing-East Lansing, MI
- Population (ZIP)
- 39,876
- Household income
- $56,631
- Rent vs Own
- Severe rent burden
- 2255.0
Population outlook (Ingham County) Hauer SSP2
- Today (2025)
- 300,362 people
- By 2030
- 307,808 · +2.5%
- By 2040
- 320,492 · +6.7%
- By 2050
- 333,223 · +10.9%
- By 2075
- 373,693 · +24.4%
- By 2100
- 392,021 · +30.5%
Race, ethnicity, and origin ACS 2023
- Neighborhood character
- Diverse neighborhood (Simpson 0.70)
- Race & ethnicity
- White 46% Black 26% Hispanic / Latino 14% Two or more races 10% Asian 8%
- Hispanic origin (detail)
- Mexican 10% Puerto Rican 1%
- Common ancestry
- Romanian 3% Slovak 2% Iranian 2%
- Foreign-born
- 12% · Canada, Vietnam, Philippines
- Languages at home
- 83% English-only · Spanish 5% Other Indo-European 3% Other Asian/Pacific 2%
Political lean MEDSL · Ingham
- 2024 margin
- Strong D (+29.7) · D 63.9% · R 34.2% · Other 2.0%
- 2008→2024 swing
- -3.6pp toward R · 2008: 33.3pp · 2024: 29.7pp
- All cycles
- 2024: D+29.7 2020: D+32.2 2016: D+27.6 2012: D+27.9 2008: D+33.3
Not yet ingested
- Civics
- —
Market trends
- HPI YoY
- ▼ -179.62%
- Current HPI
- 176.0632
- Rent YoY
- ▲ 9.90%
- Metro
- Lansing-East Lansing, MI
- State GDP YoY
- ▲ 1.37%
- F500 in state
- 28
Industry mix (Fortune 500 HQ in MI)
| Industry | F500 HQs | Revenue |
|---|---|---|
| Automotive Parts | 3 | $48B |
|
||
| Automotive | 2 | $372B |
|
||
| Chemicals | 1 | $45B |
|
||
| Automotive Retail | 1 | $29B |
|
||
| Healthcare / Medical Devices | 1 | $23B |
|
||
| Automotive Technology | 1 | $20B |
|
||
Price history
+113.8% since first listed6 events — show timeline
- 2026-06-08 Listed $106,900 REALCOMP
- 2026-06-08 Listed $106,900 Greater Lansing AoR
- 2021-08-10 Sold (MLS) $50,000 REALCOMP
- 2021-08-10 Sold (MLS) $50,000 Greater Lansing AoR
- 2021-06-11 Listed $50,000 REALCOMP
- 2021-06-11 Listed $50,000 Greater Lansing AoR
Property tax history
+7.1%/yrLatest (2025): $1,992 · +3.2% YoY. Source: county tax records.
Cash-flow waterfall
monthlySold comps — $/sqft
last 12 mo · ≤1 miLoading sold comps…