6248 GOLDEN SANDS Dr E #216 · Long Beach, CA
Flood risk 9/10 · Severe
- FEMA flood zone
- X
- Chance of flooding over 30 yrs
- 0.99%
- Est. flood insurance / yr
- $507 – $1,088
Fire risk 1/10 · Minimal
- Est. fire insurance / yr
- $659 – $1,223
Heat risk 4/10 · Minor
- Hot days now (above 86°F)
- 7 days/yr
- Hot days in 30 yrs
- 20 days/yr
Wind risk 1/10 · Minimal
- Chance of severe wind over 30 yrs
- —
Air-quality risk 5/10 · Moderate
- Unhealthy air days now
- 7 days/yr
- Unhealthy air days in 30 yrs
- 9 days/yr
Risk factors via First Street. Map © Google.
Why this score? — see what drove the B+ grade
The composite is a weighted blend of 9 inputs, each scored 0–100. Each bar is that input's sub-score; the figure is the points it added to the 100-point composite (weight × sub-score).
- Cash flow +30.0/30.0
- ARV discount +12.3/15.0
- 1% rule +10.0/10.0
- DSCR +10.0/10.0
- Condition / age +4.0/5.0
- Schools +3.7/10.0
- Livability +3.4/5.0
- Rent growth +2.9/5.0
- Appreciation +0.0/10.0
$179,000
🖨 Deal sheet (PDF) 📄 Offer letter ✓ Due diligence
Listing remarks MLS
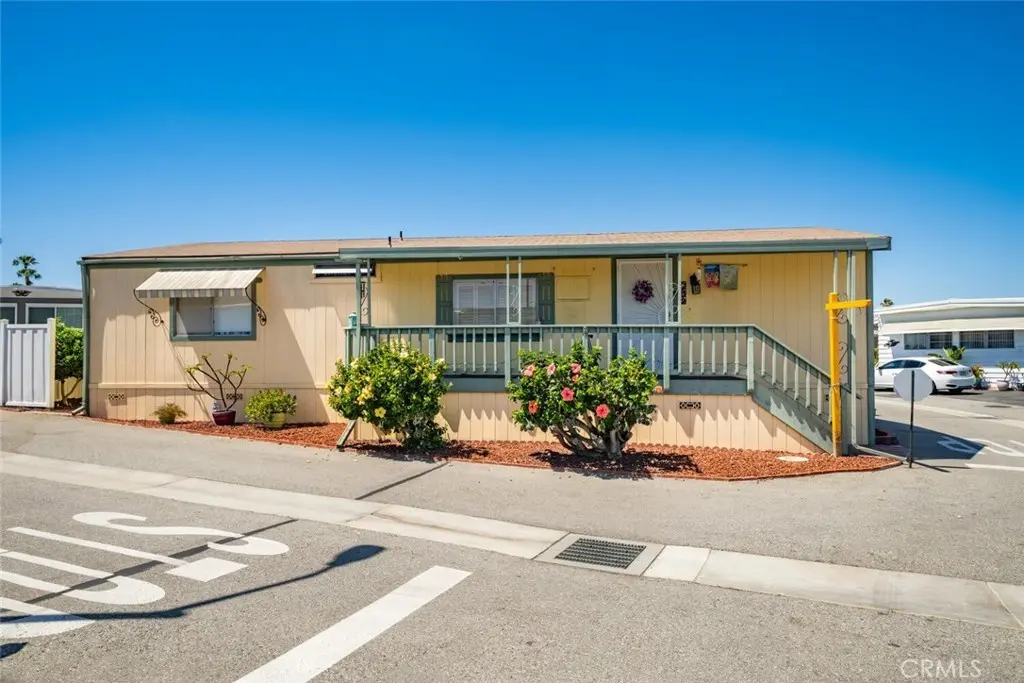
Welcome to one of So. Cal's Finest Active 55-and-older senior parks. Corner home with freshly recoated 2-carport covered parking space. Spacious living room with plenty of windows, and an open floor plan to the dining room, living room, and family room. Inside the laundry room with a washer and dryer included. Back door access to a large back porch covered by a spacious carport. Heavy-duty work shed for his and hers hobby room or storage space. Breakfast nook in spacious kitchen with pantry.
Key facts
- Breakfast nook
- Pantry
- Large back porch
Tags
Neighborhood map
What this means for you Summary
Snapshot
- This is a 2-bed/2.0-bath manufactured listed at $179k. Condition is rated good.
Deal economics
- At list price, monthly cash flow is $1k ($17k/yr) — positive.
- The deal already cash-flows at list — no discount required.
- Meets the 1% rule at list price ($4k rent vs $179k).
- Recommended offer: $168k (6.0% below list) — sets the bar for market timing.
- Cap rate 16.2% vs local median 1.9% in Long Beach — top-decile yield for the area; either an underpriced asset or a hidden risk that comps aren't pricing in. Stress-test before assuming the spread holds.
Location & tenants
- Location reads 67/100 on livability (#319 in CA) — a middle-class / working-renter tenant base. Strengths: amenities A+, commute A+, employment B+; Watch: health & safety C-, crime F, cost of living F.
- Long Beach Unified (urban): math 34% / reading 50% proficiency, ranked #216 of 517 in CA (top 42%) — families likely to look elsewhere, expect single-tenant / working-renter base with shorter leases.
- Market conditions: Rents rising (+1.7%/yr); 135 active listings in the ZIP; 30 comparable units currently listed for rent nearby; rentals at typical pace (median 20d on market — plan ~3-4 weeks tenant-placement turnaround); high-income renter base; 19,697 units permitted in Los Angeles County in 2024 (9,426 in 5+ unit buildings).
- This rent runs 38% of the median local income ($115k/yr) — at the standard rent-burdened threshold; future hikes will face affordability resistance.
Forward outlook
- Local home prices are declining (-3.0%/yr); year-one equity from $1k of loan paydown is wiped out by about $5k of value loss. Plan a longer hold.
- Los Angeles County population projected at +9% by 2050 — modest demand growth; plan on rents tracking national, not racing it.
- At projected returns (-3.0% appreciation + 1.7% rent growth), your $50k cash investment doubles in ~4 years — after that, you're playing with house money.
Negotiation context
- It's been on market 71 days — a 6% lower offer ($168k) is reasonable based on typical stale-listing flexibility.
Risks & watch-outs
- Watch-outs: flood insurance adds $66/mo.
- Climate carrying-cost: severe flood risk — expect insurance premiums to compound above CPI over the hold.
Questions for the listing agent
- It's been on market 71 days. Have you received any prior offers? Is the seller open to a 6% concession, seller financing, or rate buy-down credit?
- What's the actual annual flood-insurance premium (NFIP or private), and is the property in a SFHA with mandatory coverage?
- What does the HOA fee cover, when was the last increase, and are there any pending special assessments or reserve-fund shortfalls?
- Why hasn't it sold? Are there any deal-killer items the seller is aware of (foundation, flood, title, zoning, code violations)?
- Is there a deadline driving the sale (1031 exchange, divorce, estate, relocation)? That informs how much negotiation room exists.
- Crime grade is F in this area — have there been break-ins, vandalism, or insurance claims at this property in the last 3 years? What carrier currently insures it and at what premium?
- What's the average days-on-market for RENTAL listings here right now (not sales)? A rising rental-DOM trend means longer vacancies and softer asking-rent achievability than the comps imply.
- What's the recent tenant-quality profile in this submarket — average credit score on applications, eviction rate, late-payment / NSF rate, and stable-employment percentage? A property-management company in the area should have these aggregated.
- How much new for-sale + rental construction is in the pipeline within 1–3 miles? Heavy new supply typically softens prices + rents 12–24 months out; constrained supply supports both.
Investment metrics
- 1% rule
- 2.02% ✓
- Cap rate
- 16.19%
- Cash-on-cash
- 35.34%
- DSCR
- 2.57
- GRM
- 4.1
CMA / ARV
- ARV (median comp)
- $200,325
- List price
- $179,000
- Delta
- -10.65%
- Verdict
- UNDERPRICED
- Comps
- 18 within 1.0 mi
Show comp detail 12 sales within ~0.75 mi
| Address | Dist | Beds/Ba | Sqft | Sold | Price | $/sf | Match |
|---|---|---|---|---|---|---|---|
| 302 Sandpiper #283 | 0.07mi | 2/2.0 | 1,140 (-1%) | 5mo | $135,000 | $118 | 91 |
| 6267 Driftwood Dr #310 | 0.09mi | 2/2.0 | 1,120 (-3%) | 11mo | $219,000 | $196 | 82 |
| 6245 E Marina View Dr #240 | 0.07mi | 2/2.0 | 1,100 (-4%) | 9mo | $350,000 | $318 | 82 |
| 6217 E Golden Sands #336 | 0.16mi | 2/2.0 | 1,200 (+4%) | 6mo | $160,000 | $133 | 80 |
| 6231 Emerald Cv | 0.10mi | 2/2.0 | 1,200 (+4%) | 12mo | $245,000 | $204 | 78 |
| 6219 E Sea Breeze Dr #10 | 0.14mi | 2/2.0 | 1,200 (+4%) | 11mo | $150,000 | $125 | 77 |
| 6255 E Marina View Dr #148 | 0.06mi | 2/2.0 | 1,248 (+8%) | 8mo | $328,000 | $263 | 77 |
| 6256 E Golden Sands #260 | 0.02mi | 2/2.0 | 1,000 (-13%) | 3mo | $185,000 | $185 | 74 |
| 6254 Beachcomber | 0.05mi | 2/2.0 | 1,267 (+10%) | 9mo | $244,900 | $193 | 73 |
| 307 N Sandpiper Dr #148 | 0.07mi | 2/2.0 | 1,000 (-13%) | 6mo | $300,000 | $300 | 70 |
| 6259 East Sea Breeze Dr #30 | 0.12mi | 2/2.0 | 1,000 (-13%) | 4mo | $138,200 | $138 | 69 |
| 6236 E Emerald Cove Dr #169 | 0.08mi | 2/1.0 | 1,000 (-13%) | 7mo | $160,000 | $160 | 65 |
Match score weights: distance 35% · size 25% · config 20% · recency 20%. Top-matched comps best support the ARV.
Projected returns pro-forma
-3.0% appreciation · 1.68% rent growth · sell at horizon
- IRR
- 27.5%
- Equity multiple
- 2.12×
- Total profit
- $56,208
- Equity at exit
- $26,689
- IRR
- 34.2%
- Equity multiple
- 3.92×
- Total profit
- $146,337
- Equity at exit
- $15,477
Cash invested: $50,120 (down + closing). Projections, not guarantees.
Landlord ↔ Tenant lean methodology
- Overall (STATE)
- 18 Strongly Tenant-Friendly
- State California
- 18 Strongly Tenant-Friendly · D+13
- County
- — inherits STATE
- City
- — inherits STATE
ZIP-level market 90803
- Rents YoY
- 1.7%
- Active inventory
- 135
- Price-to-rent
- 4.1×
Monthly cashflow live
- Estimated rent
- $3,619 high interval (Pro) →
- Mortgage (P&I)
- −$939
- Tax est. 1.5%
- −$224 /mo · $2,685/yr
- Insurance
- −$75
- Flood insurance flood zone
- −$66 /mo · $798/yr
- HOA
- −$146
- Vacancy / Maint / Mgmt
- −$760
- Net cashflow
- $1,410
Break-even live
Sensitivity live
| Price | -10% $1,533 | -5% $1,471 | +0% $1,410 | +5% $1,348 | +10% $1,286 |
|---|---|---|---|---|---|
| Rent | -10% $1,124 | -5% $1,267 | +0% $1,410 | +5% $1,552 | +10% $1,695 |
| Rate | -1.0pp $1,500 | -0.5pp $1,455 | base $1,410 | +0.5pp $1,363 | +1.0pp $1,316 |
UW: 25.0% down · 7.5% · 30yr · 1.5% tax · 5.0% vac · 8.0% maint · 8.0% mgmt
Financing live
Cash to close
- Down payment
- $44,750
- Closing costs
- $5,370
- Reserves months
- —
- Total cash needed
- —
Loan-product check · same deal, 3 products live
Conventional
25% down · 7.5% · 30yr
- Down + closing
- —
- Monthly P&I
- —
- Monthly cashflow
- —
- DSCR
- —
- Eligible?
- —
Personal DTI + credit; lowest rate.
DSCR
20% down · 8.5% · 30yr
- Down + closing
- —
- Monthly P&I
- —
- Monthly cashflow
- —
- DSCR
- —
- Eligible?
- —
No personal income docs; deal must DSCR.
Hard money
10% down · 12.0% · 12mo
- Down + closing
- —
- Monthly P&I
- —
- Monthly cashflow
- —
- DSCR
- —
- Eligible?
- —
Short-term bridge; refi at stabilization.
Rent comps 30 comps
| Address | Beds | Baths | Sqft | Rent | $/sqft | DOM | Units | Dist |
|---|---|---|---|---|---|---|---|---|
| 6300 E Colorado St Unit A Long Beach, CA | 2.0 | 2.0 | 924 | $4,000 | $4.33 | 44d | 1 | 0.36mi |
| 5980 Bixby Village Dr Long Beach, CA | 1.0–2.0 | 1.0–2.0 | 749 | $3,607 | $4.82 | 2d | 20 | 0.40mi |
| 5926 Bixby Village Dr Long Beach, CA | 1.0–2.0 | 1.0–2.0 | 875 | $3,846 | $4.40 | 3d | 17 | 0.56mi |
| 7217 Marina Pacifica Dr S Long Beach, CA | 2.0 | 3.0 | 1500 | $5,100 | $3.40 | 44d | 1 | 0.60mi |
| 9212 Marina Pacifica Dr N Long Beach, CA | 1.0 | 1.0 | 926 | $3,100 | $3.35 | 44d | 1 | 0.62mi |
| 448 N Bellflower Blvd Long Beach, CA | 1.0 | 1.0 | 700 | $2,395 | $3.42 | 44d | 1 | 0.63mi |
| 576 N Bellflower Blvd Long Beach, CA | 1.0–2.0 | 1.0–2.0 | 860 | $3,195 | $3.71 | 11d | 1 | 0.67mi |
| 777 N Bellflower Blvd Long Beach, CA | 1.0–2.0 | 1.0–2.0 | 752 | $2,300 | $3.06 | 17d | 2 | 0.91mi |
| 777 N Bellflower Blvd Unit 118 Long Beach, CA | 2.0 | 2.0 | 890 | $2,300 | $2.58 | 44d | 1 | 0.91mi |
| 5585 E Pacific Coast Hwy Long Beach, CA | 1.0–2.0 | 1.0–2.0 | 756 | $2,850 | $3.77 | 25d | 2 | 0.95mi |
| 5585 E Pacific Coast Hwy Long Beach, CA | 2.0 | 2.0 | 913 | $2,850 | $3.12 | 6d | 1 | 0.95mi |
| 1025 Palo Verde Ave Long Beach, CA | 1.0–2.0 | 1.0–2.5 | 1326 | $4,808 | $3.62 | 0d | 3 | 0.97mi |
| 60 Rivo Alto Canal Long Beach, CA | 1.0 | 2.0 | 1360 | $6,500 | $4.78 | 19d | 1 | 1.14mi |
| 7084 Island Village Dr Long Beach, CA | 3.0 | 2.0 | 1227 | $4,263 | $3.47 | 19d | 1 | 1.16mi |
| 270 La Verne Ave Unit A Long Beach, CA | 3.0 | 1.0 | 1150 | $3,200 | $2.78 | 44d | 1 | 1.17mi |
| 5343 E The Toledo Unit 5345 Long Beach, CA | 3.0 | 1.0 | 1300 | $3,495 | $2.69 | 20d | 1 | 1.19mi |
| 5400 E The Toledo #410 Long Beach, CA | 2.0 | 2.0 | 1118 | $4,200 | $3.76 | 44d | 1 | 1.23mi |
| 333 1st St Seal Beach, CA | 2.0 | 1.0–2.0 | 717 | $3,710 | $5.17 | 0d | 1 | 1.24mi |
| 5235 E The Toledo Long Beach, CA | 1.0 | 1.0 | 700 | $2,395 | $3.42 | 18d | 1 | 1.28mi |
| 5113 E The Toledo Unit D Long Beach, CA | 1.0 | 1.0 | 765 | $3,495 | $4.57 | 6d | 1 | 1.34mi |
| 6817 E Bacarro St Long Beach, CA | 3.0 | 2.0 | 1234 | $5,000 | $4.05 | 11d | 1 | 1.36mi |
| 5401 E Anaheim Rd Unit 205 Long Beach, CA | 2.0 | 2.0 | 875 | $2,795 | $3.19 | 44d | 1 | 1.41mi |
| 5401 E Anaheim Rd Unit 211 Long Beach, CA | 2.0 | 2.0 | 875 | $2,895 | $3.31 | 20d | 1 | 1.42mi |
| 45 65th Pl Long Beach, CA | 3.0 | 2.0 | 1100 | $4,800 | $4.36 | 0d | 1 | 1.44mi |
| 208 Granada Ave Unit 210D Long Beach, CA | 2.0 | 1.0 | 725 | $2,650 | $3.66 | 44d | 1 | 1.45mi |
| 1045 Marvista Ave Seal Beach, CA | 3.0 | 2.0 | 1195 | $5,950 | $4.98 | 8d | 1 | 1.45mi |
| 6713 E Ocean Blvd Long Beach, CA | 3.0 | 3.0 | 1500 | $6,495 | $4.33 | 16d | 1 | 1.46mi |
| 5575 E Seaside Walk Long Beach, CA | 1.0 | 1.5 | 700 | $3,800 | $5.43 | 44d | 1 | 1.47mi |
| 6117 E Seaside Walk Long Beach, CA | 2.0 | 2.0 | 1240 | $6,500 | $5.24 | 0d | 1 | 1.48mi |
| 6229 E Seaside Walk Apt A Long Beach, CA | 3.0 | 2.0 | 1400 | $4,695 | $3.35 | 44d | 1 | 1.49mi |
HOA detail
- Monthly dues
- $146 · $1,752/yr
Listing history 12 events
-
2026-06-18days on market $179,000 Active 71 DOM
-
2026-06-17status $179,000 Active 70 DOM
-
2026-06-13statusdays on market $179,000 Pending Sale 70 DOM
-
2026-06-09days on market $179,000 Active 68 DOM
-
2026-06-08days on market $179,000 Active 67 DOM
-
2026-06-07days on market $179,000 Active 66 DOM
-
2026-06-04days on market $179,000 Active 63 DOM
-
2026-06-03days on market $179,000 Active 62 DOM
-
2026-06-02days on market $179,000 Active 61 DOM
-
2026-06-01days on market $179,000 Active 60 DOM
-
2026-05-31days on market $179,000 Active 59 DOM
-
2026-04-02$189,000 Active 496-char remark
Show marketing remark (496 chars)
Welcome to one of So. Cal's Finest Active 55-and-older senior parks. Corner home with freshly recoated 2-carport covered parking space. Spacious living room with plenty of windows, and an open floor plan to the dining room, living room, and family room. Inside the laundry room with a washer and dryer included. Back door access to a large back porch covered by a spacious carport. Heavy-duty work shed for his and hers hobby room or storage space. Breakfast nook in spacious kitchen with pantry.
ⓘ Source: listings_history table (triggers on properties + properties_extension) + one-shot
backfill from property_details.listing_events for pre-trigger history.
Climate risk First Street
- Flood 9/10 Extreme FEMA zone X · 99% chance over 30 yrs
- Wildfire 1/10 Low
- Heat 4/10 Moderate 7 d/yr ≥86°F today · 20 d/yr by 30 yrs out
- Wind 1/10 Low
- Air quality 5/10 Major 7 unhealthy d/yr today · 9 by 30 yrs out
Nearby sold comps map
Loading sold comps map…
Walkable amenities ~0.75 mi
Loading nearby amenities…
Taxation est. · year 1
- Rental income
- $43,428
- − Mortgage interest
- −$10,027
- − Property taxes
- −$2,685
- − Insurance
- −$1,692
- − Repairs & maintenance
- −$3,474
- − Management
- −$3,474
- − HOA
- −$1,752
- − Depreciation
- −$5,207
- Taxable income
- $15,116
- Est. tax owed @ 24.0%
- −$3,628
- After-tax cash flow
- $13,286/yr
For passive investors: Depreciation is non-cash, so a rental often shows a tax loss while cash-flowing — sheltering income. Rental losses are passive: they offset passive income freely, and up to $25,000/yr can offset ordinary (W-2) income if you actively participate and your MAGI is under $100k (phasing out to $0 by $150k); unused losses carry forward. On sale, claimed depreciation is recaptured at up to 25%, and gains may owe capital-gains tax (a 1031 exchange can defer both). Figures are a year-1 estimate at your 24.0% rate — not tax advice; consult a CPA.
Condition & rehab AI · 6 photos
This well-maintained mobile home in a senior park is ready for a fresh coat of paint and some landscaping to enhance its curb appeal and resale value.
Value-add opportunities
- Both Paint exterior — Enhances curb appeal and resale value
- Both Clean windows — Improves natural light and aesthetics
- Both Upgrade landscaping — Enhances curb appeal and resale value
- Both Replace carpet — Fresh carpet improves comfort and resale value
Renovation cost estimate screening
Value-add ROI direction
- Both Paint exterior — Enhances curb appeal and resale value ↑
- Both Clean windows — Improves natural light and aesthetics ↑
- Both Upgrade landscaping — Enhances curb appeal and resale value ↑
- Both Replace carpet — Fresh carpet improves comfort and resale value ↑
ⓘ Cost ranges are severity-bucket heuristics (US national rule-of-thumb). Get contractor quotes + a written scope before underwriting a rehab budget.
Schools (NCES district)
- District
- Long Beach Unified
- NCES district ID
- 0622500
- Math proficiency
- 34% ▼ -11.00%
- Reading proficiency
- 50% ▼ -4.00%
- Median HH income
- $56,092
- Composite
- 36.67/100
- National rank
- #4607
- State rank
- #216 of 517 in CA
Livability — Long Beach
- Score
- 67/100
- State rank
- #319
- US rank
- #10758
Category grades
Schools grade is shown separately in the Schools card above.
Census & demographics
- Census place
- Long Beach, CA
- County
- Los Angeles County · 9,444,647 people
- City population
- 466,088
- Metro
- Los Angeles-Long Beach-Anaheim, CA
- Population (ZIP)
- 31,526
- Household income
- $114,656
- Rent vs Own
- Severe rent burden
- 1537.0
Population outlook (Los Angeles County) Hauer SSP2
- Today (2025)
- 10,940,515 people
- By 2030
- 11,256,481 · +2.9%
- By 2040
- 11,729,929 · +7.2%
- By 2050
- 11,948,407 · +9.2%
- By 2075
- 11,818,114 · +8.0%
- By 2100
- 10,842,928 · -0.9%
Race, ethnicity, and origin ACS 2023
- Neighborhood character
- Majority White (65%)
- Race & ethnicity
- White 65% Hispanic / Latino 19% Two or more races 10% Asian 6% Black 3% Native American 1% Pacific Islander 1%
- Hispanic origin (detail)
- Mexican 12%
- Common ancestry
- Italian 3% Romanian 3% Lithuanian 2%
- Foreign-born
- 14% · Canada, China, Jamaica
- Languages at home
- 84% English-only · Spanish 9% Other Asian/Pacific 2% Tagalog/Filipino 1%
Political lean MEDSL · Los Angeles
- 2024 margin
- Solid D (+32.9) · D 64.8% · R 31.9% · Other 3.3%
- 2008→2024 swing
- -7.4pp toward R · 2008: 40.4pp · 2024: 32.9pp
- All cycles
- 2024: D+32.9 2020: D+44.2 2016: D+48.0 2012: D+40.0 2008: D+40.4
Not yet ingested
- Civics
- —
Market trends
- HPI YoY
- ▼ -634.69%
- Current HPI
- 377.3105
- Rent YoY
- ▲ 1.68%
- Metro
- Los Angeles-Long Beach-Anaheim, CA
- State GDP YoY
- ▲ 3.21%
- F500 in state
- 116
Industry mix (Fortune 500 HQ in CA)
| Industry | F500 HQs | Revenue |
|---|---|---|
| Technology | 27 | $1,492B |
|
||
| Financial Services | 3 | $174B |
|
||
| Retail | 3 | $44B |
|
||
| Insurance | 3 | $26B |
|
||
| Media / Entertainment | 2 | $115B |
|
||
| Pharmaceuticals / Biotech | 2 | $62B |
|
||
Price history
1 event — show timeline
- 2026-04-02 Listed $189,000 CRMLS
Cash-flow waterfall
monthlySold comps — $/sqft
last 12 mo · ≤1 miLoading sold comps…