 🌊 Lakefront
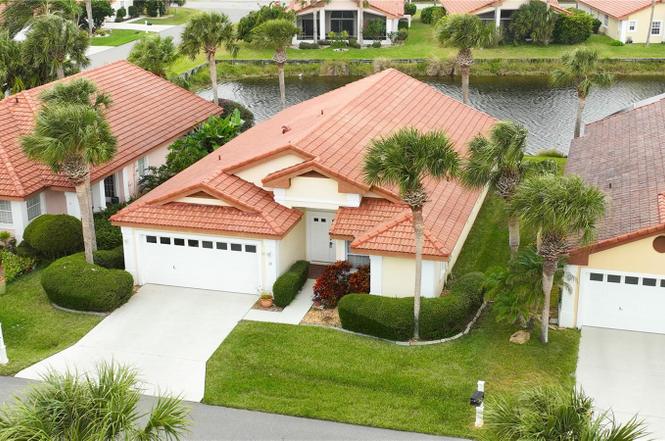
19 San Rafael Ct · Marineland, FL
Flood risk 9/10 · Severe
- FEMA flood zone
- X (shaded)
- Chance of flooding over 30 yrs
- 0.99%
- Est. flood insurance / yr
- $507 – $1,088
Fire risk 2/10 · Minimal
- Est. fire insurance / yr
- $947 – $1,759
Heat risk 9/10 · Severe
- Hot days now (above 105°F)
- 7 days/yr
- Hot days in 30 yrs
- 21 days/yr
Wind risk 10/10 · Severe
- Chance of severe wind over 30 yrs
- 99.0%
Air-quality risk 2/10 · Minimal
- Unhealthy air days now
- 2 days/yr
- Unhealthy air days in 30 yrs
- 2 days/yr
Risk factors via First Street. Map © Google.
Why this score? — see what drove the C+ grade
The composite is a weighted blend of 9 inputs, each scored 0–100. Each bar is that input's sub-score; the figure is the points it added to the 100-point composite (weight × sub-score).
- Cash flow +21.5/30.0
- ARV discount +13.1/15.0
- DSCR +6.9/10.0
- 1% rule +6.1/10.0
- Schools +4.6/10.0
- Rent growth +2.7/5.0
- Livability +2.6/5.0
- Condition / age +2.5/5.0
- Appreciation +0.0/10.0
$385,000
🖨 Deal sheet 📄 Offer letter ✓ Due diligence
Listing remarks
Under contract-accepting backup offers. Discover refined coastal living at its finest in Lakeside at Matanzas Shores—an exclusive gated enclave perfectly positioned between the Atlantic Ocean and the tranquil Intracoastal Waterway. This exceptional lakefront residence offers an elegant fusion of natural beauty, and effortless waterfront living. Upon entering, you’re greeted by a meticulously designed split floor plan showcasing three generous bedrooms and two beautifully appointed bathrooms. The primary suite serves as a private sanctuary, featuring sliding glass doors that open to a serene screened patio with captivating lake views. The spa-inspired ensuite bath is luxuriously
Key facts
- Screened patio
- Lake views
- Gated enclave
Tags
Property features AI
Finance
- Other: Living area reported as 1,832 (public records); total building area reported as 2,431; Lot dimensions approximately 55 x 110 (0.14 acres); Private maintained road
- Financial info: Lease restrictions apply
- HOA & community: Has HOA (Matanzas Shores / Lisa R); Monthly HOA fee: $145; Additional quarterly fee: $135; Association fees required; association approval required; HOA includes 24-hour guard, grounds maintenance, pool, private road, recreational facilities; Community amenities: gated access, pool, tennis courts, pickleball courts, recreation facilities, sidewalks; buyer approval required; deed restrictions; pets allowed
Exterior
- Parking: Attached 2-car garage (20 x 19)
- Security: Gated community; Security gate; Smoke detectors
- Utilities: Public water; Private sewer; Cable available; Electricity connected; Sewer connected; Water connected; Underground utilities; Irrigation equipment
- Home design: Single family residence; One story; Completed condition; Faces southeast; On lake frontage with lake view and lake access (55 feet of frontage)
- Construction: Block and concrete construction; Tile roof; Slab foundation; Built as part of a planned unit development (PUD)
- Exterior features: Covered, screened rear porch; Patio/porch rear and screened; Sliding doors; Private mailbox; Mature landscaping; Private, paved lot in cul-de-sac with sidewalks; City limits / In county location
Interior
- Kitchen: Dishwasher; Garbage disposal; Microwave; Range; Refrigerator
- Bedrooms: 3 bedrooms
- Flooring: Carpet; Hardwood; Tile
- Bathrooms: 2 full bathrooms
- Heating & cooling: Central heating (Electric, Heat Pump); Central air conditioning
- Interior features: Ceiling fans; Eat-in kitchen; High ceilings; Solid surface counters; Split bedroom floorplan; Stone counters; Thermostat; Vaulted ceilings; Walk-in closets; Window treatments (blinds)
- Laundry & utility: Inside laundry room; Washer hookup; Electric dryer hookup; Inside utility
Neighborhood map
What this means for you Summary
Snapshot
- This is a 3-bed/2.0-bath single-family listed at $385k.
Deal economics
- At list price, monthly cash flow is $514 ($6k/yr) — positive.
- The deal already cash-flows at list — no discount required.
- Meets the 1% rule at list price ($4k rent vs $385k).
- Recommended offer: $339k (12.0% below list) — sets the bar for market timing.
- Cap rate 8.1% vs local median 1.8% in Marineland — top-decile yield for the area; either an underpriced asset or a hidden risk that comps aren't pricing in. Stress-test before assuming the spread holds.
Location & tenants
- Location reads 52/100 on livability (#886 in FL) — a working-class tenant base; expect higher turnover. Strengths: cost of living A+, crime A; Watch: health & safety C-, amenities F, commute F.
- Flagler (rural): math 53% / reading 56% proficiency, ranked #20 of 73 in FL (top 27%) — acceptable for families but not a draw, mixed tenant base, ~2y average lease.
- Market conditions: Rents flat; 1600 active listings in the ZIP; 6 comparable units currently listed for rent nearby; rentals at typical pace (median 23d on market — plan ~3-4 weeks tenant-placement turnaround); solid renter incomes; 2,588 units permitted in Flagler County in 2024 (0 in 5+ unit buildings).
- At $4,292/mo this rent would consume 61% of the median local household income ($84k/yr) (locally 816% of renters already pay >50% of income on rent) — very limited rent-growth headroom before tenants either downsize or default.
Forward outlook
- Local home prices are declining (-3.0%/yr); year-one equity from $3k of loan paydown is wiped out by about $12k of value loss. Plan a longer hold.
- Flagler County population projected at +28% by 2050 — long-run rental-demand tailwind backs the buy-and-hold thesis.
Negotiation context
- It's been on market 160 days — a 12% lower offer ($339k) is reasonable based on typical stale-listing flexibility.
- 5 sale attempts since 2y ago; this cycle's ask has dropped $63k (14%) from the opening price — seller is motivated, your offer sets the floor, not the list.
Risks & watch-outs
- Watch-outs: flood insurance adds $66/mo.
- Climate carrying-cost: severe flood risk; severe wind risk, 99% chance of damaging wind over 30y; extreme-heat days projected 7→21/yr by 2055 (HVAC capex compounding) — expect insurance premiums to compound above CPI over the hold.
Questions for the listing agent
- It's been on market 160 days. Have you received any prior offers? Is the seller open to a 12% concession, seller financing, or rate buy-down credit?
- What's the actual annual flood-insurance premium (NFIP or private), and is the property in a SFHA with mandatory coverage?
- What does the HOA fee cover, when was the last increase, and are there any pending special assessments or reserve-fund shortfalls?
- Why hasn't it sold? Are there any deal-killer items the seller is aware of (foundation, flood, title, zoning, code violations)?
- Is there a deadline driving the sale (1031 exchange, divorce, estate, relocation)? That informs how much negotiation room exists.
- This sits on a lake — are riparian / water-frontage rights deeded with the parcel? Any dock permits, shoreline easements, or HOA water-use restrictions?
- What's the documented flood / surge / shoreline-erosion history here (FEMA AND non-FEMA — e.g., storm surge, creek backup, septic-field saturation)?
- Any water-quality or seasonal algae-bloom issues that affect tenant satisfaction or short-term-rental demand?
- What's the average days-on-market for RENTAL listings here right now (not sales)? A rising rental-DOM trend means longer vacancies and softer asking-rent achievability than the comps imply.
- What's the recent tenant-quality profile in this submarket — average credit score on applications, eviction rate, late-payment / NSF rate, and stable-employment percentage? A property-management company in the area should have these aggregated.
- How much new for-sale + rental construction is in the pipeline within 1–3 miles? Heavy new supply typically softens prices + rents 12–24 months out; constrained supply supports both.
Investment metrics
- 1% rule
- 1.11% ✓
- Cap rate
- 8.10%
- Cash-on-cash
- 6.46%
- DSCR
- 1.29
- GRM
- 7.5
CMA / ARV
- ARV (on-the-fly)
- $439,680
- Comps found
- 12
Show comp detail 12 sales within ~0.75 mi
| Address | Dist | Beds/Ba | Sqft | Sold | Price | $/sf | Match |
|---|---|---|---|---|---|---|---|
| 19 San Rafael Ct | 0.00mi | 3/2.0 | 1,832 (0%) | 0mo | $365,000 | $199 | 100 |
| 81 San Juan Dr | 0.07mi | 3/2.0 | 1,844 (+1%) | 1mo | $380,000 | $206 | 95 |
| 37 San Jose Dr | 0.10mi | 3/2.0 | 1,792 (-2%) | 1mo | $375,000 | $209 | 90 |
| 68 Los Lagos Blvd | 0.25mi | 3/2.0 | 1,810 (-1%) | 6mo | $445,000 | $246 | 81 |
| 47 Sandy Beach Way | 0.31mi | 3/2.0 | 1,883 (+3%) | 1mo | $550,000 | $292 | 80 |
| 26 San Carlos Dr | 0.30mi | 3/2.0 | 1,812 (-1%) | 9mo | $365,000 | $201 | 77 |
| 25 Smiling Fish Ln | 0.36mi | 3/2.0 | 1,810 (-1%) | 7mo | $550,000 | $304 | 76 |
| 35 Smiling Fish Ln | 0.37mi | 3/2.5 | 2,024 (+10%) | 2mo | $725,000 | $358 | 62 |
| 95 Las Casitas Blvd | 0.41mi | 3/2.0 | 1,706 (-7%) | 12mo | $410,000 | $240 | 60 |
| 4 San Luis Ln | 0.25mi | 2/2.0 (-1) | 1,563 (-15%) | 2mo | $363,360 | $232 | 57 |
| 6 San Filipe Way | 0.39mi | 4/2.0 (+1) | 2,000 (+9%) | 10mo | $482,000 | $241 | 53 |
| 86 Las Casitas Blvd | 0.46mi | 4/2.0 (+1) | 1,999 (+9%) | 7mo | $460,000 | $230 | 52 |
Match score weights: distance 35% · size 25% · config 20% · recency 20%. Top-matched comps best support the ARV.
Projected returns pro-forma
-3.0% appreciation · 0.85% rent growth · sell at horizon
- IRR
- -10.0%
- Equity multiple
- 0.64×
- Total profit
- $-38,529
- Equity at exit
- $57,405
- IRR
- -4.1%
- Equity multiple
- 0.76×
- Total profit
- $-26,306
- Equity at exit
- $33,288
Cash invested: $107,800 (down + closing). Projections, not guarantees.
Landlord ↔ Tenant lean methodology
- Overall (STATE)
- 87 Strongly Landlord-Friendly
- State Florida
- 87 Strongly Landlord-Friendly · R+3
- County
- — inherits STATE
- City
- — inherits STATE
ZIP-level market 32137
- Home prices YoY
- -34.5%
- Rents YoY
- 0.8%
- Active inventory
- 1600
- Price-to-rent
- 7.5×
Monthly cashflow live
- Estimated rent
- $4,292 medium interval (Pro) →
- Mortgage (P&I)
- −$2,019
- Tax from tax record
- −$416 /mo · $4,992/yr
- Insurance
- −$160
- Flood insurance flood zone
- −$66 /mo · $798/yr
- HOA
- −$215
- Vacancy / Maint / Mgmt
- −$901
- Net cashflow
- $514
Break-even live
UW: 25.0% down · 7.5% · 30yr · 1.5% tax · 5.0% vac · 8.0% maint · 8.0% mgmt
Financing live
Cash to close
- Down payment
- $96,250
- Closing costs
- $11,550
- Reserves months
- —
- Total cash needed
- —
Loan-product check · same deal, 3 products live
Conventional
25% down · 7.5% · 30yr
- Down + closing
- —
- Monthly P&I
- —
- Monthly cashflow
- —
- DSCR
- —
- Eligible?
- —
Personal DTI + credit; lowest rate.
DSCR
20% down · 8.5% · 30yr
- Down + closing
- —
- Monthly P&I
- —
- Monthly cashflow
- —
- DSCR
- —
- Eligible?
- —
No personal income docs; deal must DSCR.
Hard money
10% down · 12.0% · 12mo
- Down + closing
- —
- Monthly P&I
- —
- Monthly cashflow
- —
- DSCR
- —
- Eligible?
- —
Short-term bridge; refi at stabilization.
Rent comps 6 comps
| Address | Beds | Baths | Sqft | Rent | $/sqft | DOM | Units | Dist |
|---|---|---|---|---|---|---|---|---|
| 29 San Jose Dr Palm Coast, FL | 2.0 | 2.0 | 1306 | $2,400 | $1.84 | 2d | 1 | 0.11mi |
| 104 Surfview Dr #1608 Palm Coast, FL | 2.0 | 2.0 | 1263 | $4,800 | $3.80 | 23d | 1 | 0.20mi |
| 110 Surfview Dr Unit 1261592P Palm Coast, FL | 2.0 | 2.0 | 1259 | $4,141 | $3.29 | 2d | 1 | 0.22mi |
| 21 Los Lagos Blvd Palm Coast, FL | 3.0 | 2.0 | 2216 | $3,100 | $1.40 | 23d | 1 | 0.29mi |
| 37 Atlantic Dr Unit 1261604P Palm Coast, FL | 3.0 | 2.0 | 1991 | $8,011 | $4.02 | 23d | 1 | 1.44mi |
| 37 Atlantic Dr Palm Coast, FL | 3.0 | 2.0 | 1501 | $7,500 | $5.00 | 23d | 1 | 1.44mi |
HOA detail
- Monthly dues
- $215 · $2,580/yr
- Likely covers
- watersecurity
Listing history 31 events
-
2026-05-10status Pending
-
2026-04-28price $385,000
-
2026-04-27price $385,000
-
2026-03-27price $393,000
-
2026-03-27price $393,000
-
2026-02-23price $418,000
-
2026-02-23price $418,000
-
2026-01-20price $443,000
-
2026-01-19price $443,000
-
2025-12-01$448,000 Active
-
2025-12-01$448,000 Active
-
2025-11-30historical
-
2025-11-30historical
-
2025-11-07price $450,000
-
2025-11-06price $450,000
-
2025-11-06price $450,000
-
2025-09-04price $479,000
-
2025-09-04price $479,000
-
2025-09-04price $479,000
-
2025-07-16price $489,000
-
2025-07-15price $489,000
-
2025-07-15price $489,000
-
2025-05-27$495,900 Active
-
2025-05-27$495,900 Active
-
2025-05-05historical
-
2025-04-04price $506,900
-
2024-07-24price $509,900
-
2024-06-29price $588,000
-
2024-06-14price $610,000
-
2024-05-17price $625,000
-
2024-05-06$650,000 Active
ⓘ Source: listings_history table (triggers on properties + properties_extension) + one-shot
backfill from property_details.listing_events for pre-trigger history.
Tax reassessment forecast FL · Resets to sale price
- Current annual tax
- $4,992 · $416/mo
- Projected year-2 tax
- $4,992 · $416/mo
- Expected delta
- $0/yr ($0/mo · 0.0%)
ⓘ Screening estimate from a state-policy table — verify with the county assessor before closing.
Climate risk First Street
- Flood 9/10 Extreme FEMA zone X (shaded) · 99% chance over 30 yrs
- Wildfire 2/10 Low
- Heat 9/10 Extreme 7 d/yr ≥105°F today · 21 d/yr by 30 yrs out
- Wind 10/10 Extreme 99% chance of damaging wind over 30 yrs
- Air quality 2/10 Low 2 unhealthy d/yr today · 2 by 30 yrs out
Nearby sold comps map
Loading sold comps map…
Walkable amenities ~0.75 mi
Loading nearby amenities…
Taxation est. · year 1
- Rental income
- $51,510
- − Mortgage interest
- −$21,566
- − Property taxes
- −$4,992
- − Insurance
- −$2,722
- − Repairs & maintenance
- −$4,121
- − Management
- −$4,121
- − HOA
- −$2,580
- − Depreciation
- −$11,200
- Taxable income
- $208
- Est. tax owed @ 24.0%
- −$50
- After-tax cash flow
- $6,121/yr
For passive investors: Depreciation is non-cash, so a rental often shows a tax loss while cash-flowing — sheltering income. Rental losses are passive: they offset passive income freely, and up to $25,000/yr can offset ordinary (W-2) income if you actively participate and your MAGI is under $100k (phasing out to $0 by $150k); unused losses carry forward. On sale, claimed depreciation is recaptured at up to 25%, and gains may owe capital-gains tax (a 1031 exchange can defer both). Figures are a year-1 estimate at your 24.0% rate — not tax advice; consult a CPA.
Schools (NCES district)
- District
- Flagler
- NCES district ID
- 1200540
- Math proficiency
- 53% ▼ -9.00%
- Reading proficiency
- 56% ▼ -4.00%
- Median HH income
- $48,354
- Composite
- 46.35/100
- National rank
- #2464
- State rank
- #20 of 73 in FL
Livability — Marineland
- Score
- 52/100
- State rank
- #886
- US rank
- #25050
Category grades
Schools grade is shown separately in the Schools card above.
Census & demographics
- County
- Flagler County · 113,412 people
- Metro
- Deltona-Daytona Beach-Ormond Beach, FL
- Population (ZIP)
- 48,391
- Household income
- $83,923
- Rent vs Own
- Severe rent burden
- 816.0
Population outlook (Flagler County) Hauer SSP2
- Today (2025)
- 123,474 people
- By 2030
- 131,864 · +6.8%
- By 2040
- 146,176 · +18.4%
- By 2050
- 157,398 · +27.5%
- By 2075
- 177,990 · +44.2%
- By 2100
- 183,381 · +48.5%
Race, ethnicity, and origin ACS 2023
- Neighborhood character
- Predominantly White (77%)
- Race & ethnicity
- White 77% Hispanic / Latino 10% Two or more races 8% Black 6% Asian 3%
- Hispanic origin (detail)
- Puerto Rican 4% Cuban 1%
- Common ancestry
- Romanian 4% Russian 2% Lithuanian 2%
- Foreign-born
- 13% · Canada, Jamaica
- Languages at home
- 85% English-only · Spanish 7% Other Indo-European 3% Russian/Polish/Slavic 2%
Political lean MEDSL · Flagler
- 2024 margin
- Strong R (+28.2) · D 35.6% · R 63.8%
- 2008→2024 swing
- -29.8pp toward R · 2008: 1.6pp · 2024: -28.2pp
- All cycles
- 2024: R+28.2 2020: R+20.8 2016: R+20.6 2012: R+7.4 2008: D+1.6
Not yet ingested
- Civics
- —
Market trends
- HPI YoY
- ▼ -153.27%
- Current HPI
- 290.4607
- Rent YoY
- ▲ 0.85%
- Metro
- Deltona-Daytona Beach-Ormond Beach, FL
- State GDP YoY
- ▲ 3.28%
- F500 in state
- 36
Industry mix (Fortune 500 HQ in FL)
| Industry | F500 HQs | Revenue |
|---|---|---|
| Industrial Technology | 2 | $29B |
|
||
| Insurance | 2 | $17B |
|
||
| Retail | 1 | $60B |
|
||
| Technology Distribution | 1 | $58B |
|
||
| Homebuilding | 1 | $35B |
|
||
| Technology Manufacturing | 1 | $35B |
|
||
Price history
-40.8% since first listed31 events — show timeline
- 2026-05-10 Pending — Stellar MLS as Distributed by MLS Grid
- 2026-04-28 Price Changed $385,000 realMLS
- 2026-04-27 Price Changed $385,000 Stellar MLS as Distributed by MLS Grid
- 2026-03-27 Price Changed $393,000 realMLS
- 2026-03-27 Price Changed $393,000 Stellar MLS as Distributed by MLS Grid
- 2026-02-23 Price Changed $418,000 realMLS
- 2026-02-23 Price Changed $418,000 Stellar MLS as Distributed by MLS Grid
- 2026-01-20 Price Changed $443,000 realMLS
- 2026-01-19 Price Changed $443,000 Stellar MLS as Distributed by MLS Grid
- 2025-12-01 Listed $448,000 Stellar MLS as Distributed by MLS Grid
- 2025-12-01 Listed $448,000 realMLS
- 2025-11-30 Listing Removed — Stellar MLS as Distributed by MLS Grid
- 2025-11-30 Listing Removed — Daytona MLS
- 2025-11-07 Price Changed $450,000 St. Augustine and St. Johns County Board of REALTORS®
- 2025-11-06 Price Changed $450,000 Daytona MLS
- 2025-11-06 Price Changed $450,000 Stellar MLS as Distributed by MLS Grid
- 2025-09-04 Price Changed $479,000 St. Augustine and St. Johns County Board of REALTORS®
- 2025-09-04 Price Changed $479,000 Daytona MLS
- 2025-09-04 Price Changed $479,000 Stellar MLS as Distributed by MLS Grid
- 2025-07-16 Price Changed $489,000 St. Augustine and St. Johns County Board of REALTORS®
- 2025-07-15 Price Changed $489,000 Daytona MLS
- 2025-07-15 Price Changed $489,000 Stellar MLS as Distributed by MLS Grid
- 2025-05-27 Listed $495,900 Stellar MLS as Distributed by MLS Grid
- 2025-05-27 Listed $495,900 Daytona MLS
- 2025-05-05 Listing Removed — Stellar MLS as Distributed by MLS Grid
- 2025-04-04 Price Changed $506,900 Stellar MLS as Distributed by MLS Grid
- 2024-07-24 Price Changed $509,900 Stellar MLS as Distributed by MLS Grid
- 2024-06-29 Price Changed $588,000 Stellar MLS as Distributed by MLS Grid
- 2024-06-14 Price Changed $610,000 Stellar MLS as Distributed by MLS Grid
- 2024-05-17 Price Changed $625,000 Stellar MLS as Distributed by MLS Grid
- 2024-05-06 Listed $650,000 Stellar MLS as Distributed by MLS Grid
Property tax history
+7.5%/yrLatest (2025): $4,992 · +2.2% YoY. Source: county tax records.
Cash-flow waterfall
monthlySold comps — $/sqft
last 12 mo · ≤1 miLoading sold comps…