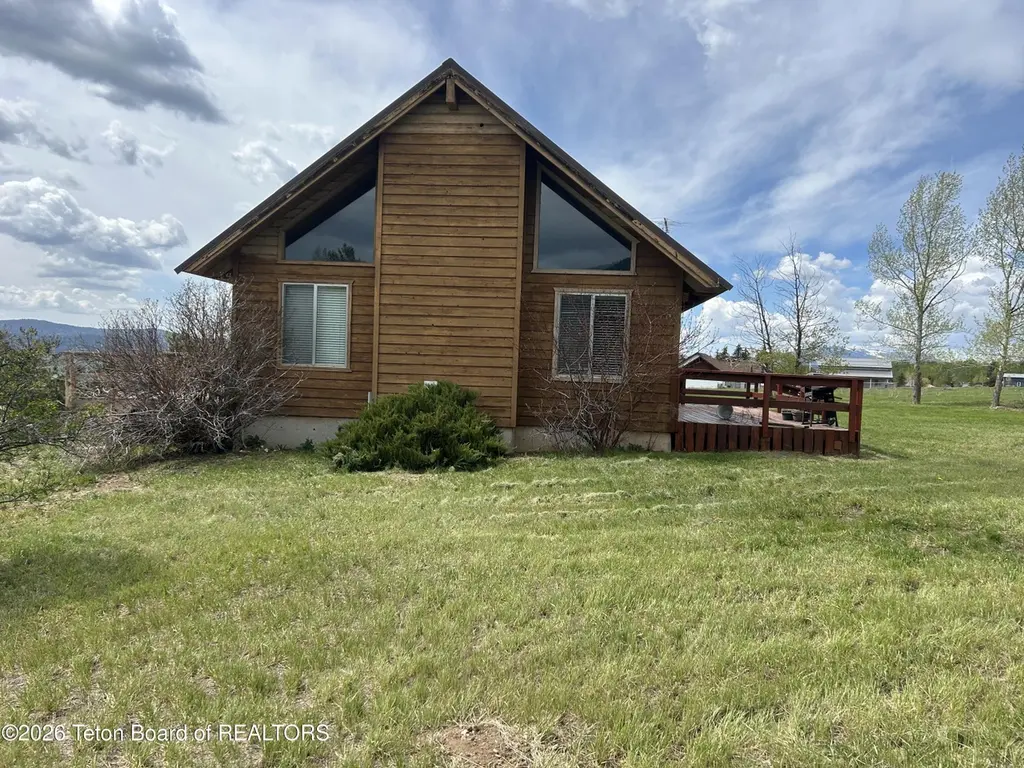
461 Cedar Creek Dr · Star Valley Ranch, WY
Flood risk 1/10 · Minimal
- FEMA flood zone
- X (unshaded)
- Chance of flooding over 30 yrs
- 0.0%
- Est. flood insurance / yr
- $507 – $1,088
Fire risk 4/10 · Minor
- Est. fire insurance / yr
- $564 – $1,046
Heat risk 2/10 · Minimal
- Hot days now (above 85°F)
- 11 days/yr
- Hot days in 30 yrs
- 27 days/yr
Wind risk 1/10 · Minimal
- Chance of severe wind over 30 yrs
- —
Air-quality risk 2/10 · Minimal
- Unhealthy air days now
- 2 days/yr
- Unhealthy air days in 30 yrs
- 2 days/yr
Risk factors via First Street. Map © Google.
Why this score? — see what drove the D grade
The composite is a weighted blend of 9 inputs, each scored 0–100. Each bar is that input's sub-score; the figure is the points it added to the 100-point composite (weight × sub-score).
- ARV discount +15.0/15.0
- Appreciation +10.0/10.0
- Schools +5.4/10.0
- Livability +3.3/5.0
- Rent growth +2.5/5.0
- Condition / age +2.5/5.0
- Cash flow +1.8/30.0
- 1% rule +0.0/10.0
- DSCR +0.0/10.0
$499,000
🖨 Deal sheet 📄 Offer letter ✓ Due diligence
Key facts
- Spacious great room
- Detached garage shop
- Cathedral ceilings
Tags
Property features AI
Finance
- HOA & community: Homeowners association with an annual fee (approximately $405.54 per year / $33.80 per month)
Exterior
- Parking: 2-car garage; Gravel parking; Garage door opener
- Utilities: Public water; Septic tank; Electric service on property
- Home design: Single-family residence; Residential property
- Construction: Cedar construction; Metal roof
- Exterior features: Deck; Porch; Wooded lot with few trees; Has a view; Pets allowed
Interior
- Bathrooms: One full bathroom; One three-quarter bathroom
- Heating & cooling: Baseboard heating
- Interior features: Unfurnished; No basement
Neighborhood map
What this means for you Summary
Snapshot
- This is a 3-bed/2.0-bath single-family listed at $499k.
Deal economics
- At list price, monthly cash flow is $-2k ($-23k/yr) — negative.
- To cash-flow at today's rent, offer at most $164k (67.1% below list).
- To meet the 1% rule (rent ≥ 1% of price), the offer needs to be $146k (70.7% below list).
- Recommended offer: $146k (70.7% below list) — sets the bar for 1% rule.
- Cap rate 1.7% vs local median 0.8% in Star Valley Ranch — top-decile yield for the area; either an underpriced asset or a hidden risk that comps aren't pricing in. Stress-test before assuming the spread holds.
Location & tenants
- Location reads 66/100 on livability (#73 in WY) — a middle-class / working-renter tenant base. Strengths: crime A+, employment A+, housing A+; Watch: cost of living C-, schools F, amenities F.
- Lincoln County School District #2 (rural): math 57% / reading 67% proficiency, ranked #7 of 41 in WY (top 17%) — acceptable for families but not a draw, mixed tenant base, ~2y average lease.
- Market conditions: 153 active listings in the ZIP; 220 units permitted in Lincoln County in 2024 (0 in 5+ unit buildings).
Forward outlook
- In year one you build about $53k of equity ($3k loan paydown + $50k appreciation (10.0% local appreciation)).
- Lincoln County population projected at +4% by 2050 — modest demand growth; plan on rents tracking national, not racing it.
- By year 2, paydown + projected appreciation supports a ~$86k cash-out refi (75% LTV) — recoverable capital for the next deal without selling this one.
Negotiation context
- It's been on market 42 days — a 3% lower offer ($484k) is reasonable based on typical stale-listing flexibility.
Questions for the listing agent
- What do current leases actually rent for vs. the listed asking? Can we see a recent rent roll and the last 12 months of T-12 income?
- It's been on market 42 days. Have you received any prior offers? Is the seller open to a 71% concession, seller financing, or rate buy-down credit?
- What does the HOA fee cover, when was the last increase, and are there any pending special assessments or reserve-fund shortfalls?
- Is there a deadline driving the sale (1031 exchange, divorce, estate, relocation)? That informs how much negotiation room exists.
- Schools are F-rated, which usually means shorter tenancies and higher turnover. Who's the typical renter profile here, and what's been the actual vacancy rate?
- The area grade is low — what's the realistic commute time and amenity access for the typical tenant pool here? Any planned neighborhood developments (good or bad) we should know about?
- What's the average days-on-market for RENTAL listings here right now (not sales)? A rising rental-DOM trend means longer vacancies and softer asking-rent achievability than the comps imply.
- What's the recent tenant-quality profile in this submarket — average credit score on applications, eviction rate, late-payment / NSF rate, and stable-employment percentage? A property-management company in the area should have these aggregated.
- How much new for-sale + rental construction is in the pipeline within 1–3 miles? Heavy new supply typically softens prices + rents 12–24 months out; constrained supply supports both.
Investment metrics
- 1% rule
- 0.29% ✗
- Cap rate
- 1.74%
- Cash-on-cash
- -16.27%
- DSCR
- 0.28
- GRM
- 28.5
CMA / ARV
- ARV (median comp)
- $625,804
- List price
- $499,000
- Delta
- -20.26%
- Verdict
- UNDERPRICED
- Comps
- 20 within 1.0 mi
Show comp detail 6 sales within ~0.75 mi
| Address | Dist | Beds/Ba | Sqft | Sold | Price | $/sf | Match |
|---|---|---|---|---|---|---|---|
| 25 Alta Dr | 0.34mi | 3/2.0 | 2,090 (-2%) | 3mo | $624,900 | $299 | 78 |
| 101 Alta Dr | 0.27mi | 3/2.0 | 1,910 (-10%) | 11mo | $649,000 | $340 | 61 |
| 76 Solitude Dr | 0.30mi | 3/2.0 | 1,840 (-14%) | 16mo | $565,000 | $307 | 50 |
| 34 Vista East Dr | 0.47mi | 3/3.0 | 1,991 (-7%) | 19mo | $569,000 | $286 | 47 |
| 20 Ridgecrest Dr | 0.42mi | 3/2.0 | 2,414 (+13%) | 21mo | $605,000 | $251 | 41 |
| 15 Solitude Cir | 0.67mi | 3/2.5 | 1,872 (-12%) | 11mo | $575,000 | $307 | 38 |
Match score weights: distance 35% · size 25% · config 20% · recency 20%. Top-matched comps best support the ARV.
Projected returns pro-forma
10.0% appreciation · 3.0% rent growth · sell at horizon
- IRR
- 13.0%
- Equity multiple
- 2.08×
- Total profit
- $150,868
- Equity at exit
- $449,539
- IRR
- 13.3%
- Equity multiple
- 4.86×
- Total profit
- $538,736
- Equity at exit
- $969,447
Cash invested: $139,720 (down + closing). Projections, not guarantees.
Landlord ↔ Tenant lean methodology
- Overall (STATE)
- 90 Strongly Landlord-Friendly
- State Wyoming
- 90 Strongly Landlord-Friendly · R+25
- County
- — inherits STATE
- City
- — inherits STATE
ZIP-level market 83127
- Home prices YoY
- 32.4%
- Active inventory
- 153
- Price-to-rent
- 28.5×
Monthly cashflow live
- Estimated rent
- $1,460 medium interval (Pro) →
- Mortgage (P&I)
- −$2,617
- Tax from tax record
- −$190 /mo · $2,276/yr
- Insurance
- −$208
- HOA
- −$34
- Vacancy / Maint / Mgmt
- −$307
- Net cashflow
- $-1,895
Break-even live
UW: 25.0% down · 7.5% · 30yr · 1.5% tax · 5.0% vac · 8.0% maint · 8.0% mgmt
Financing live
Cash to close
- Down payment
- $124,750
- Closing costs
- $14,970
- Reserves months
- —
- Total cash needed
- —
Loan-product check · same deal, 3 products live
Conventional
25% down · 7.5% · 30yr
- Down + closing
- —
- Monthly P&I
- —
- Monthly cashflow
- —
- DSCR
- —
- Eligible?
- —
Personal DTI + credit; lowest rate.
DSCR
20% down · 8.5% · 30yr
- Down + closing
- —
- Monthly P&I
- —
- Monthly cashflow
- —
- DSCR
- —
- Eligible?
- —
No personal income docs; deal must DSCR.
Hard money
10% down · 12.0% · 12mo
- Down + closing
- —
- Monthly P&I
- —
- Monthly cashflow
- —
- DSCR
- —
- Eligible?
- —
Short-term bridge; refi at stabilization.
HOA detail
- Monthly dues
- $34 · $408/yr
Listing history 17 events
-
2026-06-19days on market $499,000 Active 42 DOM
-
2026-06-18days on market $499,000 Active 41 DOM
-
2026-06-17days on market $499,000 Active 40 DOM
-
2026-06-16days on market $499,000 Active 39 DOM
-
2026-06-15days on market $499,000 Active 38 DOM
-
2026-06-14days on market $499,000 Active 36 DOM
-
2026-06-12days on market $499,000 Active 35 DOM
-
2026-06-09days on market $499,000 Active 32 DOM
-
2026-06-08days on market $499,000 Active 31 DOM
-
2026-06-07days on market $499,000 Active 30 DOM
-
2026-06-05days on market $499,000 Active 28 DOM
-
2026-06-04days on market $499,000 Active 26 DOM
-
2026-06-02days on market $499,000 Active 25 DOM
-
2026-06-01days on market $499,000 Active 24 DOM
-
2026-05-31days on market $499,000 Active 23 DOM
-
2026-05-31days on market $499,000 Active 22 DOM
-
2026-05-07$499,000 Active 866-char remark
ⓘ Source: listings_history table (triggers on properties + properties_extension) + one-shot
backfill from property_details.listing_events for pre-trigger history.
Tax reassessment forecast WY · Resets to sale price
- Current annual tax
- $2,276 · $190/mo
- Projected year-2 tax
- $3,044 · $254/mo
- Expected delta
- +$768/yr (+$64/mo · 33.8%)
ⓘ Screening estimate from a state-policy table — verify with the county assessor before closing.
Climate risk First Street
- Flood 1/10 Low FEMA zone X (unshaded) · 0% chance over 30 yrs
- Wildfire 4/10 Moderate
- Heat 2/10 Low 11 d/yr ≥85°F today · 27 d/yr by 30 yrs out
- Wind 1/10 Low
- Air quality 2/10 Low 2 unhealthy d/yr today · 2 by 30 yrs out
Nearby sold comps map
Loading sold comps map…
Walkable amenities ~0.75 mi
Loading nearby amenities…
Taxation est. · year 1
- Rental income
- $17,524
- − Mortgage interest
- −$27,952
- − Property taxes
- −$2,276
- − Insurance
- −$2,495
- − Repairs & maintenance
- −$1,402
- − Management
- −$1,402
- − HOA
- −$408
- − Depreciation
- −$14,516
- Taxable loss
- −$32,927
- Est. tax savings @ 24.0%
- +$7,902
- After-tax cash flow
- $-14,834/yr
For passive investors: Depreciation is non-cash, so a rental often shows a tax loss while cash-flowing — sheltering income. Rental losses are passive: they offset passive income freely, and up to $25,000/yr can offset ordinary (W-2) income if you actively participate and your MAGI is under $100k (phasing out to $0 by $150k); unused losses carry forward. On sale, claimed depreciation is recaptured at up to 25%, and gains may owe capital-gains tax (a 1031 exchange can defer both). Figures are a year-1 estimate at your 24.0% rate — not tax advice; consult a CPA.
Schools (NCES district)
- District
- Lincoln County School District #2
- NCES district ID
- 5604060
- Math proficiency
- 57% ▬ 0.00%
- Reading proficiency
- 67% ▬ 0.00%
- Median HH income
- $61,907
- Composite
- 53.84/100
- National rank
- #1413
- State rank
- #7 of 41 in WY
Livability — Star Valley Ranch
- Score
- 66/100
- State rank
- #73
- US rank
- #11627
Category grades
Schools grade is shown separately in the Schools card above.
Census & demographics
- Census place
- Star Valley Ranch, WY
- Population (ZIP)
- 3,726
Population outlook (Lincoln County) Hauer SSP2
- Today (2025)
- 19,890 people
- By 2030
- 20,275 · +1.9%
- By 2040
- 20,691 · +4.0%
- By 2050
- 20,640 · +3.8%
- By 2075
- 20,008 · +0.6%
- By 2100
- 18,122 · -8.9%
Race, ethnicity, and origin ACS 2023
- Neighborhood character
- Predominantly White (87%)
- Race & ethnicity
- White 87% Two or more races 11% Hispanic / Latino 10%
- Hispanic origin (detail)
- Mexican 8%
- Common ancestry
- Slovak 5% Italian 4% Iranian 3%
- Foreign-born
- 5% · Canada
- Languages at home
- 91% English-only · Spanish 9%
Political lean MEDSL · Lincoln
- 2024 margin
- Solid R (+68.3) · D 15.1% · R 83.5% · Other 1.4%
- 2008→2024 swing
- -13.9pp toward R · 2008: -54.4pp · 2024: -68.3pp
- All cycles
- 2024: R+68.3 2020: R+68.2 2016: R+67.6 2012: R+68.3 2008: R+54.4
Not yet ingested
- Civics
- —
Market trends
- HPI YoY
- ▲ 78.23%
- Current HPI
- 319.45
- Rent YoY
- —
- Metro
- —
- State GDP YoY
- —
- F500 in state
- 0
Price history
1 event — show timeline
- 2026-05-07 Listed $499,000 TBOR
Property tax history
+6.8%/yrLatest (2025): $2,276 · -27.7% YoY. Source: county tax records.
Cash-flow waterfall
monthlySold comps — $/sqft
last 12 mo · ≤1 miLoading sold comps…