1402 22nd St NE #243 · Auburn, WA
Flood risk 6/10 · Moderate
- FEMA flood zone
- X (unshaded)
- Chance of flooding over 30 yrs
- 0.27%
- Est. flood insurance / yr
- $507 – $1,088
Fire risk 1/10 · Minimal
- Est. fire insurance / yr
- $604 – $1,122
Heat risk 4/10 · Minor
- Hot days now (above 87°F)
- 7 days/yr
- Hot days in 30 yrs
- 16 days/yr
Wind risk 1/10 · Minimal
- Chance of severe wind over 30 yrs
- —
Air-quality risk 7/10 · Major
- Unhealthy air days now
- 10 days/yr
- Unhealthy air days in 30 yrs
- 11 days/yr
Risk factors via First Street. Map © Google.
Why this score? — see what drove the B+ grade
The composite is a weighted blend of 9 inputs, each scored 0–100. Each bar is that input's sub-score; the figure is the points it added to the 100-point composite (weight × sub-score).
- Cash flow +30.0/30.0
- ARV discount +14.2/15.0
- 1% rule +10.0/10.0
- DSCR +10.0/10.0
- Schools +4.7/10.0
- Livability +4.0/5.0
- Rent growth +2.9/5.0
- Condition / age +2.5/5.0
- Appreciation +0.0/10.0
$84,950
🖨 Deal sheet 📄 Offer letter ✓ Due diligence
Listing remarks
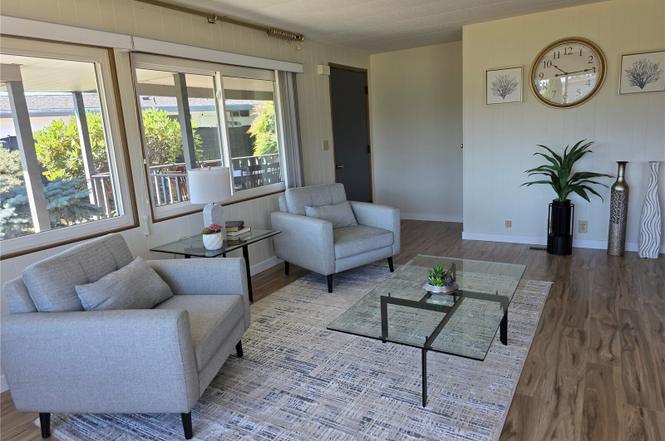
MUSS SEE! UPDATED! READY TO MOVE-IN, Home is locate in RIO VERDE ESTATE Community a premiere 55+ GATED COMMUNITY, Home offer 2 bedroom, 2 bath, Living room and Dining room are filled with Natural lighting from windows creating a warm and inviting atmosphere. Step out side with 2 Cover Patios for your morning coffee relax or an afternoon kick back with Tea. Home offering New Laminate Floor (water Proof) New interior paint, New Kitchen Appliances, new Kitchen Cabinet painted and updated with Beautiful Countertop. The generous Laundry room provide extra storage and easy access to your hobby shop, 2 car carport attached, possibly for garage enclosed for your privacy. Closed to Shopping and all
Key facts
- 2 cover patios
- New kitchen cabinet
- Beautiful countertop
Tags
Property features AI
Finance
- Financial info: Land lease: $1,200; Listing terms: Cash, Conventional
- HOA & community: Senior community; Rio Verde Estates park amenities: club-house, common area, exercise room, laundry, pool, BBQs, RV parking, security gate
Exterior
- Parking: Carport; RV parking (community amenity)
- Security: Security gate; Park with gated security (community amenity)
- Utilities: Park water; Park sewer; PSE electric
- Home design: Manufactured home (double wide); One story; Make: MANS, Model: 52x24
- Construction: Metal/vinyl construction; Composition roof; Manufactured after 6/15/1976
- Exterior features: Metal/vinyl exterior; Patio/Porch/Deck
Interior
- Kitchen: Dishwasher; Stove/Range; Refrigerator
- Bedrooms: 2 bedrooms
- Flooring: Laminate
- Bathrooms: 1 full bath; 1 three-quarter bath
- Heating & cooling: Forced air heating; Electric power
- Interior features: Double pane windows; Patio/Porch/Deck; Tie down foundation; Security gate
- Laundry & utility: Washer; Dryer; 1 storage unit
Neighborhood map
What this means for you Summary
Snapshot
- This is a 2-bed/2.0-bath manufactured listed at $85k.
Deal economics
- At list price, monthly cash flow is $953 ($11k/yr) — positive.
- The deal already cash-flows at list — no discount required.
- Meets the 1% rule at list price ($2k rent vs $85k).
- Recommended offer: $77k (9.0% below list) — sets the bar for market timing.
- Cap rate 19.7% vs local median 2.7% in Auburn — top-decile yield for the area; either an underpriced asset or a hidden risk that comps aren't pricing in. Stress-test before assuming the spread holds.
Location & tenants
- Location reads 81/100 on livability (#75 in WA, #1,371 nationally) — a professional / high-income tenant draw. Strengths: amenities A+, commute A+, employment A+; Watch: crime F, cost of living F.
- Auburn School District (urban): math 47% / reading 56% proficiency, ranked #125 of 291 in WA (top 43%) — acceptable for families but not a draw, mixed tenant base, ~2y average lease.
- Market conditions: Rents rising (+1.5%/yr); 171 active listings in the ZIP; 36 comparable units currently listed for rent nearby; rentals at typical pace (median 15d on market — plan ~3-4 weeks tenant-placement turnaround); solid renter incomes; 10,555 units permitted in King County in 2024 (7,119 in 5+ unit buildings).
Forward outlook
- Local home prices are declining (-3.0%/yr); year-one equity from $588 of loan paydown is wiped out by about $3k of value loss. Plan a longer hold.
- King County population projected at +44% by 2050 — long-run rental-demand tailwind backs the buy-and-hold thesis.
- At projected returns (-3.0% appreciation + 1.5% rent growth), your $24k cash investment doubles in ~3 years — after that, you're playing with house money.
Negotiation context
- It's been on market 98 days — a 9% lower offer ($77k) is reasonable based on typical stale-listing flexibility.
- 4 sale attempts since 25y ago; this cycle's ask has dropped $25k (23%) from the opening price — seller is motivated, your offer sets the floor, not the list.
Risks & watch-outs
- Climate carrying-cost: major flood risk — expect insurance premiums to compound above CPI over the hold.
Questions for the listing agent
- It's been on market 98 days. Have you received any prior offers? Is the seller open to a 9% concession, seller financing, or rate buy-down credit?
- Built in 1976 — when were the roof, HVAC, electrical panel, plumbing, and water heater last replaced?
- Why hasn't it sold? Are there any deal-killer items the seller is aware of (foundation, flood, title, zoning, code violations)?
- Is there a deadline driving the sale (1031 exchange, divorce, estate, relocation)? That informs how much negotiation room exists.
- Crime grade is F in this area — have there been break-ins, vandalism, or insurance claims at this property in the last 3 years? What carrier currently insures it and at what premium?
- What's the average days-on-market for RENTAL listings here right now (not sales)? A rising rental-DOM trend means longer vacancies and softer asking-rent achievability than the comps imply.
- What's the recent tenant-quality profile in this submarket — average credit score on applications, eviction rate, late-payment / NSF rate, and stable-employment percentage? A property-management company in the area should have these aggregated.
- How much new for-sale + rental construction is in the pipeline within 1–3 miles? Heavy new supply typically softens prices + rents 12–24 months out; constrained supply supports both.
Investment metrics
- 1% rule
- 2.29% ✓
- Cap rate
- 19.75%
- Cash-on-cash
- 48.06%
- DSCR
- 3.14
- GRM
- 3.6
CMA / ARV
- ARV (on-the-fly)
- $99,840
- Comps found
- 11
Show comp detail 11 sales within ~0.75 mi
| Address | Dist | Beds/Ba | Sqft | Sold | Price | $/sf | Match |
|---|---|---|---|---|---|---|---|
| 1402 22nd St NE #424 | 0.02mi | 2/2.0 | 1,248 (0%) | 1mo | $124,500 | $100 | 98 |
| 1402 22nd St NE #222 | 0.00mi | 2/2.0 | 1,248 (0%) | 12mo | $90,000 | $72 | 90 |
| 1402 22ND St NE #39 | 0.02mi | 2/2.0 | 1,248 (0%) | 11mo | $158,000 | $127 | 90 |
| 1402 22nd St NE #11 | 0.02mi | 2/2.0 | 1,368 (+10%) | 2mo | $60,000 | $44 | 81 |
| 1402 22nd St NE #428 | 0.02mi | 2/2.0 | 1,344 (+8%) | 11mo | $140,000 | $104 | 77 |
| 1402 22nd St NE #27 | 0.27mi | 2/2.0 | 1,344 (+8%) | 0mo | $65,000 | $48 | 74 |
| 1402 22nd St NE #233 | 0.39mi | 2/2.0 | 1,248 (0%) | 9mo | $90,000 | $72 | 74 |
| 1402 22nd St NE #127 | 0.38mi | 2/2.0 | 1,320 (+6%) | 4mo | $137,500 | $104 | 69 |
| 1402 22nd St NE #315 | 0.02mi | 2/2.0 | 1,344 (+8%) | 23mo | $118,000 | $88 | 67 |
| 1402 22nd St NE #220 | 0.38mi | 2/2.0 | 1,248 (0%) | 24mo | $100,000 | $80 | 62 |
| 1402 22nd St NE #455 | 0.39mi | 2/2.0 | 1,344 (+8%) | 18mo | $107,200 | $80 | 54 |
Match score weights: distance 35% · size 25% · config 20% · recency 20%. Top-matched comps best support the ARV.
Projected returns pro-forma
-3.0% appreciation · 1.51% rent growth · sell at horizon
- IRR
- 43.8%
- Equity multiple
- 2.85×
- Total profit
- $44,053
- Equity at exit
- $12,666
- IRR
- 49.2%
- Equity multiple
- 5.42×
- Total profit
- $105,134
- Equity at exit
- $7,345
Cash invested: $23,786 (down + closing). Projections, not guarantees.
Landlord ↔ Tenant lean methodology
- Overall (STATE)
- 28 Tenant-Leaning
- State Washington
- 28 Tenant-Leaning · D+8
- County
- — inherits STATE
- City
- — inherits STATE
ZIP-level market 98002
- Rents YoY
- 1.5%
- Active inventory
- 171
- Price-to-rent
- 3.6×
Monthly cashflow live
- Estimated rent
- $1,949 high interval (Pro) →
- Mortgage (P&I)
- −$445
- Tax est. 1.5%
- −$106 /mo · $1,274/yr
- Insurance
- −$35
- HOA
- −$0
- Vacancy / Maint / Mgmt
- −$409
- Net cashflow
- $953
Break-even live
UW: 25.0% down · 7.5% · 30yr · 1.5% tax · 5.0% vac · 8.0% maint · 8.0% mgmt
Financing live
Cash to close
- Down payment
- $21,238
- Closing costs
- $2,548
- Reserves months
- —
- Total cash needed
- —
Loan-product check · same deal, 3 products live
Conventional
25% down · 7.5% · 30yr
- Down + closing
- —
- Monthly P&I
- —
- Monthly cashflow
- —
- DSCR
- —
- Eligible?
- —
Personal DTI + credit; lowest rate.
DSCR
20% down · 8.5% · 30yr
- Down + closing
- —
- Monthly P&I
- —
- Monthly cashflow
- —
- DSCR
- —
- Eligible?
- —
No personal income docs; deal must DSCR.
Hard money
10% down · 12.0% · 12mo
- Down + closing
- —
- Monthly P&I
- —
- Monthly cashflow
- —
- DSCR
- —
- Eligible?
- —
Short-term bridge; refi at stabilization.
Rent comps 36 comps
| Address | Beds | Baths | Sqft | Rent | $/sqft | DOM | Units | Dist |
|---|---|---|---|---|---|---|---|---|
| 2212 O St NE Unit D Auburn, WA | 3.0 | 1.0 | 1000 | $1,925 | $1.93 | 21d | 1 | 0.07mi |
| 2025 M St NE Unit 2045 Auburn, WA | 2.0 | 1.5 | 1248 | $2,095 | $1.68 | 21d | 1 | 0.13mi |
| 2222 L St NE Unit 2222LA Auburn, WA | 2.0 | 1.0 | 895 | $1,995 | $2.23 | 2d | 1 | 0.16mi |
| 2409 N St NE Auburn, WA | 2.0 | 1.0 | 900 | $1,950 | $2.17 | 15d | 1 | 0.17mi |
| 2414 N St NE Unit C Auburn, WA | 3.0 | 1.0 | 1271 | $1,950 | $1.53 | 24d | 1 | 0.18mi |
| 2315 L St NE Unit 2315LA Auburn, WA | 2.0 | 1.0 | 990 | $1,995 | $2.02 | 2d | 1 | 0.22mi |
| 2319 L St NE Unit 2319LB Auburn, WA | 2.0 | 1.0 | 895 | $1,995 | $2.23 | 2d | 1 | 0.23mi |
| 2502 M St NE Unit 2502MA Auburn, WA | 2.0 | 1.0 | 910 | $2,050 | $2.25 | 2d | 1 | 0.23mi |
| 1015 18th St NE Unit 931 935 1001 1007 Auburn, WA | 2.0 | 1.0 | 900 | $1,699 | $1.89 | 24d | 1 | 0.25mi |
| 1741 22nd St NE Auburn, WA | 1.0–3.0 | 1.0–2.0 | 902 | $1,650 | $1.83 | 2d | 2 | 0.26mi |
| 2545 M Pl NE Unit 2545MPC Auburn, WA | 2.0 | 1.0 | 1000 | $1,895 | $1.90 | 24d | 1 | 0.27mi |
| 2556 M Pl NE Unit 2556MPC Auburn, WA | 2.0 | 1.0 | 1000 | $1,895 | $1.90 | 20d | 1 | 0.28mi |
| 2602 J St NE Auburn, WA | 2.0 | 1.0 | 897 | $1,972 | $2.20 | 3d | 10 | 0.37mi |
| 802 22nd St NE Unit 802 Auburn, WA | 2.0 | 1.0 | 750 | $1,585 | $2.11 | 12d | 1 | 0.38mi |
| 2317 I St NE Unit 2319 Auburn, WA | 3.0 | 2.0 | 1400 | $2,275 | $1.62 | 24d | 1 | 0.41mi |
| 987 26th Pl NE Auburn, WA | 2.0 | 1.5 | 939 | $1,795 | $1.91 | 24d | 1 | 0.42mi |
| 2701 J St NE Unit 2701JB Auburn, WA | 2.0 | 1.0 | 800 | $2,050 | $2.56 | 24d | 1 | 0.42mi |
| 2441 I St NE Auburn, WA | 2.0 | 1.0 | 910 | $1,795 | $1.97 | 15d | 1 | 0.43mi |
| 1413 12th St NE Unit ADU Auburn, WA | 3.0 | 1.0 | 1000 | $2,400 | $2.40 | 5d | 1 | 0.49mi |
| 1433 8th St NE Auburn, WA | 1.0–3.0 | 1.0–1.5 | 1025 | $2,244 | $2.19 | 1d | 13 | 0.69mi |
| 31900 104th Ave SE Unit A206 Auburn, WA | 2.0 | 1.5 | 1250 | $2,000 | $1.60 | 24d | 1 | 0.72mi |
| 1608 8th St NE Auburn, WA | 2.0 | 1.0 | 809 | $1,500 | $1.85 | 10d | 1 | 0.78mi |
| 634 M St NE Unit 3 Auburn, WA | 2.0 | 1.5 | 900 | $1,650 | $1.83 | 24d | 1 | 0.82mi |
| 1314 6th Pl NE Auburn, WA | 3.0 | 1.5 | 1180 | $3,200 | $2.71 | 24d | 1 | 0.84mi |
| 511 M St NE Auburn, WA | 2.0 | 1.0 | 742 | $1,695 | $2.28 | 5d | 1 | 0.92mi |
| 502 8th St NE Auburn, WA | 1.0–2.0 | 1.0 | 687 | $1,795 | $2.61 | 2d | 3 | 0.96mi |
| 1221 A St NE Auburn, WA | 1.0–2.0 | 1.0–2.0 | 741 | $1,986 | $2.68 | 1d | 14 | 0.96mi |
| 1107 A St NE Auburn, WA | 1.0–2.0 | 1.0 | 654 | $2,022 | $3.09 | 2d | 26 | 1.00mi |
| 29 R St NE Unit A Auburn, WA | 2.0 | 1.0 | 900 | $1,695 | $1.88 | 24d | 1 | 1.17mi |
| 421 3rd St NE Auburn, WA | 2.0 | 1.0 | 870 | $1,600 | $1.84 | 12d | 1 | 1.21mi |
| 515 N Division St Auburn, WA | 1.0–2.0 | 1.0 | 700 | $1,750 | $2.50 | 24d | 4 | 1.27mi |
| 44 5th St NE Apt 4 Auburn, WA | 3.0 | 1.0 | 1000 | $1,999 | $2.00 | 24d | 1 | 1.29mi |
| 107 N St SE Unit A Auburn, WA | 2.0 | 1.0 | 1080 | $1,750 | $1.62 | 21d | 1 | 1.32mi |
| 225 I St SE Unit 225 Auburn, WA | 2.0 | 1.0 | 980 | $2,100 | $2.14 | 15d | 1 | 1.47mi |
| 24 Auburn Way S Auburn, WA | 2.0 | 1.0 | 1000 | $1,495 | $1.50 | 24d | 1 | 1.47mi |
| 128 E Main St Auburn, WA | 2.0 | 1.0–2.0 | 680 | $2,425 | $3.56 | 5d | 6 | 1.50mi |
Listing history 28 events
-
2026-06-18days on market $84,950 Active 98 DOM
-
2026-06-17days on market $84,950 Active 97 DOM
-
2026-06-16days on market $84,950 Active 96 DOM
-
2026-06-15pricedays on market $84,950 Active 95 DOM
-
2026-06-13days on market $94,500 Active 93 DOM
-
2026-06-13days on market $94,500 Active 92 DOM
-
2026-06-09days on market $94,500 Active 89 DOM
-
2026-06-08days on market $94,500 Active 88 DOM
-
2026-06-07days on market $94,500 Active 87 DOM
-
2026-06-04days on market $94,500 Active 84 DOM
-
2026-06-03days on market $94,500 Active 83 DOM
-
2026-06-02days on market $94,500 Active 82 DOM
-
2026-06-01days on market $94,500 Active 81 DOM
-
2026-05-31days on market $94,500 Active 80 DOM
-
2026-05-24price $94,500
-
2026-04-14price $99,950
-
2026-03-12$109,950 Active
-
2023-04-18soldstatus $99,900 Closed
-
2023-04-13status Pending
-
2023-03-05price $79,900
-
2023-01-01price $89,900
-
2022-12-06price $94,900
-
2022-10-20price $99,900
-
2022-09-15$109,900 Active
-
2005-09-26soldstatus $77,000
-
2005-01-31$78,900
-
2001-08-17soldstatus $57,000
-
2001-07-11$62,500
ⓘ Source: listings_history table (triggers on properties + properties_extension) + one-shot
backfill from property_details.listing_events for pre-trigger history.
Climate risk First Street
- Flood 6/10 Major FEMA zone X (unshaded) · 27% chance over 30 yrs
- Wildfire 1/10 Low
- Heat 4/10 Moderate 7 d/yr ≥87°F today · 16 d/yr by 30 yrs out
- Wind 1/10 Low
- Air quality 7/10 Severe 10 unhealthy d/yr today · 11 by 30 yrs out
Nearby sold comps map
Loading sold comps map…
Walkable amenities ~0.75 mi
Loading nearby amenities…
Taxation est. · year 1
- Rental income
- $23,387
- − Mortgage interest
- −$4,759
- − Property taxes
- −$1,274
- − Insurance
- −$425
- − Repairs & maintenance
- −$1,871
- − Management
- −$1,871
- − Depreciation
- −$2,471
- Taxable income
- $10,716
- Est. tax owed @ 24.0%
- −$2,572
- After-tax cash flow
- $8,859/yr
For passive investors: Depreciation is non-cash, so a rental often shows a tax loss while cash-flowing — sheltering income. Rental losses are passive: they offset passive income freely, and up to $25,000/yr can offset ordinary (W-2) income if you actively participate and your MAGI is under $100k (phasing out to $0 by $150k); unused losses carry forward. On sale, claimed depreciation is recaptured at up to 25%, and gains may owe capital-gains tax (a 1031 exchange can defer both). Figures are a year-1 estimate at your 24.0% rate — not tax advice; consult a CPA.
Schools (NCES district)
- District
- Auburn School District
- NCES district ID
- 5300300
- Math proficiency
- 47% ▼ -3.00%
- Reading proficiency
- 56% ▼ -1.00%
- Median HH income
- $58,048
- Composite
- 46.73/100
- National rank
- #5240
- State rank
- #125 of 291 in WA
Livability — Auburn
- Score
- 81/100
- State rank
- #75
- US rank
- #1371
Category grades
Schools grade is shown separately in the Schools card above.
Census & demographics
- Census place
- Auburn, WA
- County
- King County · 2,251,916 people
- City population
- 74,969
- Metro
- Seattle-Tacoma-Bellevue, WA
- Population (ZIP)
- 37,509
- Household income
- $78,684
- Rent vs Own
- Severe rent burden
- 2202.0
Population outlook (King County) Hauer SSP2
- Today (2025)
- 2,576,485 people
- By 2030
- 2,803,316 · +8.8%
- By 2040
- 3,255,921 · +26.4%
- By 2050
- 3,706,444 · +43.9%
- By 2075
- 4,746,063 · +84.2%
- By 2100
- 5,407,730 · +109.9%
Race, ethnicity, and origin ACS 2023
- Neighborhood character
- Highly diverse neighborhood (Simpson 0.72)
- Race & ethnicity
- White 46% Hispanic / Latino 24% Two or more races 13% Black 12% Asian 6% Pacific Islander 4% Native American 2%
- Hispanic origin (detail)
- Mexican 20%
- Common ancestry
- Portuguese 4% Subsaharan African 4% Lithuanian 3%
- Foreign-born
- 24% · Canada, Vietnam
- Languages at home
- 63% English-only · Spanish 19% Russian/Polish/Slavic 6% Other Asian/Pacific 3%
Political lean MEDSL · King
- 2024 margin
- Solid D (+51.7) · D 74.2% · R 22.5% · Other 3.4%
- 2008→2024 swing
- +9.6pp toward D · 2008: 42.1pp · 2024: 51.7pp
- All cycles
- 2024: D+51.7 2020: D+52.7 2016: D+50.4 2012: D+39.9 2008: D+42.1
Not yet ingested
- Civics
- —
Market trends
- HPI YoY
- ▼ -677.96%
- Current HPI
- 298.0849
- Rent YoY
- ▲ 1.51%
- Metro
- Seattle-Tacoma-Bellevue, WA
- State GDP YoY
- ▲ 4.65%
- F500 in state
- 22
Industry mix (Fortune 500 HQ in WA)
| Industry | F500 HQs | Revenue |
|---|---|---|
| Retail | 2 | $269B |
|
||
| Technology / Retail | 1 | $638B |
|
||
| Technology | 1 | $245B |
|
||
| Telecommunications | 1 | $38B |
|
||
| Food / Beverage | 1 | $36B |
|
||
| Automotive / Trucks | 1 | $34B |
|
||
Price history
+51.2% since first listed14 events — show timeline
- 2026-05-24 Price Changed $94,500 NWMLS as Distributed by MLS Grid
- 2026-04-14 Price Changed $99,950 NWMLS as Distributed by MLS Grid
- 2026-03-12 Listed $109,950 NWMLS as Distributed by MLS Grid
- 2023-04-18 Sold (MLS) $99,900 NWMLS as Distributed by MLS Grid
- 2023-04-13 Pending — NWMLS as Distributed by MLS Grid
- 2023-03-05 Price Changed $79,900 NWMLS as Distributed by MLS Grid
- 2023-01-01 Price Changed $89,900 NWMLS as Distributed by MLS Grid
- 2022-12-06 Price Changed $94,900 NWMLS as Distributed by MLS Grid
- 2022-10-20 Price Changed $99,900 NWMLS as Distributed by MLS Grid
- 2022-09-15 Listed $109,900 NWMLS as Distributed by MLS Grid
- 2005-09-26 Sold (MLS) $77,000 NWMLS as Distributed by MLS Grid
- 2005-01-31 Listed $78,900 NWMLS as Distributed by MLS Grid
- 2001-08-17 Sold (MLS) $57,000 NWMLS as Distributed by MLS Grid
- 2001-07-11 Listed $62,500 NWMLS as Distributed by MLS Grid
Cash-flow waterfall
monthlySold comps — $/sqft
last 12 mo · ≤1 miLoading sold comps…