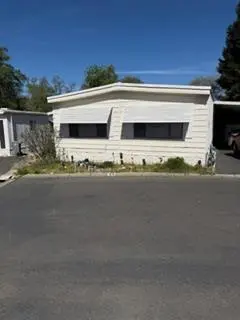
1605 Grass Valley Hwy #44 · North Auburn, CA
Flood risk 1/10 · Minimal
- FEMA flood zone
- X (unshaded)
- Chance of flooding over 30 yrs
- 0.0%
- Est. flood insurance / yr
- $507 – $1,088
Fire risk 10/10 · Severe
- Est. fire insurance / yr
- $659 – $1,223
Heat risk 6/10 · Moderate
- Hot days now (above 99°F)
- 6 days/yr
- Hot days in 30 yrs
- 14 days/yr
Wind risk 1/10 · Minimal
- Chance of severe wind over 30 yrs
- —
Air-quality risk 10/10 · Severe
- Unhealthy air days now
- 34 days/yr
- Unhealthy air days in 30 yrs
- 41 days/yr
Risk factors via First Street. Map © Google.
Why this score? — see what drove the B+ grade
The composite is a weighted blend of 9 inputs, each scored 0–100. Each bar is that input's sub-score; the figure is the points it added to the 100-point composite (weight × sub-score).
- Cash flow +30.0/30.0
- ARV discount +15.0/15.0
- 1% rule +10.0/10.0
- DSCR +10.0/10.0
- Schools +4.9/10.0
- Rent growth +3.1/5.0
- Livability +3.1/5.0
- Condition / age +2.8/5.0
- Appreciation +0.0/10.0
$85,000
🖨 Deal sheet (PDF) 📄 Offer letter ✓ Due diligence
Listing remarks
Priced to sell! This little gem is located off of Highway 49 and close to all shopping and Interstate 80. This spacious home has been well maintained and has several upgrades. More than enough room to relax in a peaceful enviornment. There is a hobby/workshop located adjacent to the back of the home as well as a storage shed. The back yard is the perfect place to go out and get away from it all. Beautifully landscaped and well maintained by the park. There is a laundry facility right across the street incase you need one. The roof was redone approximately 7 yrs ago and has a lifetime warranty. The central heating/air unit is about 2 yr old and a newer natural gas range. Please do not call
Key facts
- Hobby workshop
- Natural gas range
- Storage shed
Tags
Property features AI
Finance
- Other: Located at 1605 Grass Valley Hwy #44, Auburn, CA 95603; Directions: On Grass Valley Hwy at Luther Rd turn south toward the Taco Bell then into park.
- HOA & community: No homeowners association; Located in a senior community
Exterior
- Parking: Off-street covered parking; Attached carport (no enclosed garage); Total parking for 1 vehicle
- Utilities: Public water and public sewer; Cable and internet available; Propane available with individual gas meter; 220V outlet in laundry
- Home design: Manufactured home (double wide) located in a park; Built in 1973
- Construction: Metal skirting; Shingle and foam roofing
- Exterior features: Backyard with adjacent greenbelt; Carport awning and porch awning; Storage area, workshop, and sheds
Interior
- Kitchen: Pantry closet and laminate counters; Free-standing gas range and oven; Free-standing refrigerator
- Bedrooms: 3 bedrooms
- Flooring: Carpet, simulated wood, linoleum, and wood flooring
- Bathrooms: 2 full bathrooms with tub and separate shower stall(s)
- Heating & cooling: Central heating (gas, natural gas); Central cooling and ceiling fans
- Interior features: Accessible full bathroom and accessible kitchen; Window screens; Deck attached to the living room; Covered carpeted patio with porch steps and railings; Storage areas including shed(s) and workshop
- Laundry & utility: In-unit laundry area with electric hookups and dryer included; Gas water heater
Neighborhood map
What this means for you Summary
Snapshot
- This is a 3-bed/2.0-bath manufactured listed at $85k. Condition is rated average.
Deal economics
- At list price, monthly cash flow is $2k ($22k/yr) — positive.
- The deal already cash-flows at list — no discount required.
- Meets the 1% rule at list price ($3k rent vs $85k).
- Recommended offer: $77k (9.0% below list) — sets the bar for market timing.
- Cap rate 32.2% vs local median 2.6% in North Auburn — top-decile yield for the area; either an underpriced asset or a hidden risk that comps aren't pricing in. Stress-test before assuming the spread holds.
Location & tenants
- Location reads 61/100 on livability (#519 in CA) — a middle-class / working-renter tenant base. Strengths: employment A-, housing A-; Watch: crime D-, amenities F, commute F.
- Placer Union High (suburban): math 39% / reading 72% proficiency, ranked #98 of 517 in CA (top 19%) — acceptable for families but not a draw, mixed tenant base, ~2y average lease.
- Zoned schools: Ev Cain Middle (math 23% / reading 43%, grade F, #199 of 498 statewide, top 40%, 524 students, 45% FRL); Placer High (math 30% / reading 62%, grade D-, #409 of 1,170 statewide, top 36%, 1,310 students, 30% FRL).
- Zoned-school proficiency averages 40% at this address vs 56% district-wide (-16 pts) — the specific schools serving this property underperform the Placer Union High average; the district grade overstates school quality for this exact location.
- Market conditions: Rents rising (+2.3%/yr); 205 active listings in the ZIP; 2 comparable units currently listed for rent nearby; solid renter incomes; 3,535 units permitted in Placer County in 2024 (689 in 5+ unit buildings).
- This rent runs 43% of the median local income ($85k/yr) — at the standard rent-burdened threshold; future hikes will face affordability resistance.
Forward outlook
- Local home prices are declining (-3.0%/yr); year-one equity from $588 of loan paydown is wiped out by about $3k of value loss. Plan a longer hold.
- Placer County population projected at +20% by 2050 — long-run rental-demand tailwind backs the buy-and-hold thesis.
- At projected returns (-3.0% appreciation + 2.3% rent growth), your $24k cash investment doubles in ~2 years — after that, you're playing with house money.
Negotiation context
- It's been on market 94 days — a 9% lower offer ($77k) is reasonable based on typical stale-listing flexibility.
Risks & watch-outs
- Climate carrying-cost: severe wildfire risk; extreme-heat days projected 6→14/yr by 2055 (HVAC capex compounding) — expect insurance premiums to compound above CPI over the hold.
Questions for the listing agent
- It's been on market 94 days. Have you received any prior offers? Is the seller open to a 9% concession, seller financing, or rate buy-down credit?
- Built in 1973 — when were the roof, HVAC, electrical panel, plumbing, and water heater last replaced?
- Why hasn't it sold? Are there any deal-killer items the seller is aware of (foundation, flood, title, zoning, code violations)?
- Is there a deadline driving the sale (1031 exchange, divorce, estate, relocation)? That informs how much negotiation room exists.
- Schools are F-rated, which usually means shorter tenancies and higher turnover. Who's the typical renter profile here, and what's been the actual vacancy rate?
- Crime grade is D in this area — have there been break-ins, vandalism, or insurance claims at this property in the last 3 years? What carrier currently insures it and at what premium?
- What's the average days-on-market for RENTAL listings here right now (not sales)? A rising rental-DOM trend means longer vacancies and softer asking-rent achievability than the comps imply.
- What's the recent tenant-quality profile in this submarket — average credit score on applications, eviction rate, late-payment / NSF rate, and stable-employment percentage? A property-management company in the area should have these aggregated.
- How much new for-sale + rental construction is in the pipeline within 1–3 miles? Heavy new supply typically softens prices + rents 12–24 months out; constrained supply supports both.
Investment metrics
- 1% rule
- 3.61% ✓
- Cap rate
- 32.21%
- Cash-on-cash
- 92.58%
- DSCR
- 5.12
- GRM
- 2.3
CMA / ARV
- ARV (on-the-fly)
- $127,488
- Comps found
- 12
Show comp detail 12 sales within ~0.75 mi
| Address | Dist | Beds/Ba | Sqft | Sold | Price | $/sf | Match |
|---|---|---|---|---|---|---|---|
| 1605 Grass Valley Hwy #73 | 0.01mi | 3/2.0 | 1,536 (0%) | 5mo | $110,000 | $72 | 96 |
| 1605 Grass Valley Hwy #62 | 0.01mi | 2/2.0 (-1) | 1,440 (-6%) | 1mo | $55,000 | $38 | 83 |
| 12180 Laurel Dr | 0.35mi | 3/2.0 | 1,560 (+2%) | 9mo | $129,000 | $83 | 74 |
| 1605 Grass Valley Hwy #46 | 0.00mi | 2/2.0 (-1) | 1,344 (-12%) | 2mo | $47,000 | $35 | 72 |
| 5 Lily Ave | 0.23mi | 3/2.0 | 1,440 (-6%) | 9mo | $39,900 | $28 | 72 |
| 1564 Cottonwood Cir | 0.38mi | 3/2.0 | 1,440 (-6%) | 9mo | $95,000 | $66 | 65 |
| 12326 Pepperwood Cir #200 | 0.54mi | 2/2.0 (-1) | 1,440 (-6%) | 1mo | $165,000 | $115 | 58 |
| 12300 Pepperwood Cir | 0.45mi | 2/2.0 (-1) | 1,680 (+9%) | 0mo | $169,000 | $101 | 58 |
| 12318 Pepperwood Cir #228 | 0.52mi | 2/2.0 (-1) | 1,440 (-6%) | 3mo | $115,000 | $80 | 58 |
| 12019 Hemlock Dr #150 | 0.30mi | 3/2.0 | 1,344 (-12%) | 10mo | $121,000 | $90 | 57 |
| 12369 Pepperwood Cir | 0.45mi | 2/2.0 (-1) | 1,440 (-6%) | 8mo | $130,000 | $90 | 57 |
| 12339 Pepperwood #12339 | 0.47mi | 2/2.0 (-1) | 1,344 (-12%) | 2mo | $112,000 | $83 | 50 |
Match score weights: distance 35% · size 25% · config 20% · recency 20%. Top-matched comps best support the ARV.
Projected returns pro-forma
-3.0% appreciation · 2.34% rent growth · sell at horizon
- IRR
- 92.6%
- Equity multiple
- 5.25×
- Total profit
- $101,190
- Equity at exit
- $12,674
- IRR
- 95.3%
- Equity multiple
- 10.69×
- Total profit
- $230,688
- Equity at exit
- $7,349
Cash invested: $23,800 (down + closing). Projections, not guarantees.
Landlord ↔ Tenant lean methodology
- Overall (STATE)
- 18 Strongly Tenant-Friendly
- State California
- 18 Strongly Tenant-Friendly · D+13
- County
- — inherits STATE
- City
- — inherits STATE
ZIP-level market 95603
- Rents YoY
- 2.3%
- Active inventory
- 205
- Price-to-rent
- 2.3×
Monthly cashflow live
- Estimated rent
- $3,068 medium interval (Pro) →
- Mortgage (P&I)
- −$446
- Tax est. 1.5%
- −$106 /mo · $1,275/yr
- Insurance
- −$35
- HOA
- −$0
- Vacancy / Maint / Mgmt
- −$644
- Net cashflow
- $1,836
Break-even live
Sensitivity live
| Price | -10% $1,895 | -5% $1,865 | +0% $1,836 | +5% $1,807 | +10% $1,777 |
|---|---|---|---|---|---|
| Rent | -10% $1,594 | -5% $1,715 | +0% $1,836 | +5% $1,957 | +10% $2,078 |
| Rate | -1.0pp $1,879 | -0.5pp $1,858 | base $1,836 | +0.5pp $1,814 | +1.0pp $1,792 |
UW: 25.0% down · 7.5% · 30yr · 1.5% tax · 5.0% vac · 8.0% maint · 8.0% mgmt
Financing live
Cash to close
- Down payment
- $21,250
- Closing costs
- $2,550
- Reserves months
- —
- Total cash needed
- —
Loan-product check · same deal, 3 products live
Conventional
25% down · 7.5% · 30yr
- Down + closing
- —
- Monthly P&I
- —
- Monthly cashflow
- —
- DSCR
- —
- Eligible?
- —
Personal DTI + credit; lowest rate.
DSCR
20% down · 8.5% · 30yr
- Down + closing
- —
- Monthly P&I
- —
- Monthly cashflow
- —
- DSCR
- —
- Eligible?
- —
No personal income docs; deal must DSCR.
Hard money
10% down · 12.0% · 12mo
- Down + closing
- —
- Monthly P&I
- —
- Monthly cashflow
- —
- DSCR
- —
- Eligible?
- —
Short-term bridge; refi at stabilization.
Rent comps 2 comps
| Address | Beds | Baths | Sqft | Rent | $/sqft | DOM | Units | Dist |
|---|---|---|---|---|---|---|---|---|
| 1050 Fox Run Ct Auburn, CA | 4.0 | 2.5 | 2095 | $3,800 | $1.81 | 17d | 1 | 0.67mi |
| 630 Shockley Rd Auburn, CA | 3.0 | 2.0 | 1100 | $2,495 | $2.27 | 0d | 1 | 1.25mi |
Listing history 14 events
-
2026-06-21days on market $85,000 Active 94 DOM
-
2026-06-18days on market $85,000 Active 91 DOM
-
2026-06-17days on market $85,000 Active 90 DOM
-
2026-06-16days on market $85,000 Active 89 DOM
-
2026-06-15days on market $85,000 Active 88 DOM
-
2026-06-13days on market $85,000 Active 86 DOM
-
2026-06-13days on market $85,000 Active 85 DOM
-
2026-06-09days on market $85,000 Active 82 DOM
-
2026-06-08days on market $85,000 Active 81 DOM
-
2026-06-07days on market $85,000 Active 80 DOM
-
2026-06-03days on market $85,000 Active 76 DOM
-
2026-06-02days on market $85,000 Active 75 DOM
-
2026-06-01days on market $85,000 Active 74 DOM
-
2026-05-31days on market $85,000 Active 73 DOM
ⓘ Source: listings_history table (triggers on properties + properties_extension) + one-shot
backfill from property_details.listing_events for pre-trigger history.
Climate risk First Street
- Flood 1/10 Low FEMA zone X (unshaded) · 0% chance over 30 yrs
- Wildfire 10/10 Extreme
- Heat 6/10 Major 6 d/yr ≥99°F today · 14 d/yr by 30 yrs out
- Wind 1/10 Low
- Air quality 10/10 Extreme 34 unhealthy d/yr today · 41 by 30 yrs out
Nearby sold comps map
Loading sold comps map…
Walkable amenities ~0.75 mi
Loading nearby amenities…
Taxation est. · year 1
- Rental income
- $36,813
- − Mortgage interest
- −$4,761
- − Property taxes
- −$1,275
- − Insurance
- −$425
- − Repairs & maintenance
- −$2,945
- − Management
- −$2,945
- − Depreciation
- −$2,473
- Taxable income
- $21,989
- Est. tax owed @ 24.0%
- −$5,277
- After-tax cash flow
- $16,756/yr
For passive investors: Depreciation is non-cash, so a rental often shows a tax loss while cash-flowing — sheltering income. Rental losses are passive: they offset passive income freely, and up to $25,000/yr can offset ordinary (W-2) income if you actively participate and your MAGI is under $100k (phasing out to $0 by $150k); unused losses carry forward. On sale, claimed depreciation is recaptured at up to 25%, and gains may owe capital-gains tax (a 1031 exchange can defer both). Figures are a year-1 estimate at your 24.0% rate — not tax advice; consult a CPA.
Condition & rehab AI · 12 photos
This manufactured home is in average condition with some cosmetic updates needed to improve its resale and rental value.
Repairs flagged
- Moderate kitchen cabinets — dated and in need of replacement
- Moderate kitchen countertops — dated and in need of replacement
- Moderate kitchen appliances — dated and in need of replacement
- Minor interior walls/paint — dated ceiling tiles
Value-add opportunities
- Both paint interior walls — refreshes the interior and improves curb appeal
- Both replace kitchen cabinets and countertops — modernizes the kitchen and improves functionality
- Both replace kitchen appliances — modernizes the kitchen and improves functionality
Renovation cost estimate screening
| Repair item | Severity | Est. cost |
|---|---|---|
| kitchen cabinets · dated and in need of replacement | Moderate | $3,000–15,000 |
| kitchen countertops · dated and in need of replacement | Moderate | $3,000–15,000 |
| kitchen appliances · dated and in need of replacement | Moderate | $3,000–15,000 |
| interior walls/paint · dated ceiling tiles | Minor | $500–3,000 |
| Total estimated repair cost · 4 items | $9,500–48,000 |
Value-add ROI direction
- Both paint interior walls — refreshes the interior and improves curb appeal ↑
- Both replace kitchen cabinets and countertops — modernizes the kitchen and improves functionality ↑
- Both replace kitchen appliances — modernizes the kitchen and improves functionality ↑
ⓘ Cost ranges are severity-bucket heuristics (US national rule-of-thumb). Get contractor quotes + a written scope before underwriting a rehab budget.
Schools (NCES district)
- District
- Placer Union High
- NCES district ID
- 0630750
- Math proficiency
- 39% ▲ 1.00%
- Reading proficiency
- 72% ▲ 3.00%
- Median HH income
- $69,119
- Composite
- 49.04/100
- National rank
- #2060
- State rank
- #98 of 517 in CA
Livability — North Auburn
- Score
- 61/100
- State rank
- #519
- US rank
- #17512
Category grades
Schools grade is shown separately in the Schools card above.
Census & demographics
- Census place
- North Auburn, CA
- County
- Placer County · 390,510 people
- City population
- 28,195
- Metro
- Sacramento-Roseville-Folsom, CA
- Population (ZIP)
- 28,432
- Household income
- $85,357
- Rent vs Own
- Severe rent burden
- 1017.0
Population outlook (Placer County) Hauer SSP2
- Today (2025)
- 422,709 people
- By 2030
- 444,249 · +5.1%
- By 2040
- 480,192 · +13.6%
- By 2050
- 506,390 · +19.8%
- By 2075
- 550,219 · +30.2%
- By 2100
- 547,760 · +29.6%
Race, ethnicity, and origin ACS 2023
- Neighborhood character
- Predominantly White (73%)
- Race & ethnicity
- White 73% Hispanic / Latino 17% Two or more races 11% Asian 3%
- Hispanic origin (detail)
- Mexican 12%
- Common ancestry
- Italian 3% Slovak 3% Lithuanian 2%
- Foreign-born
- 9% · Canada, South Korea
- Languages at home
- 88% English-only · Spanish 10% Other Indo-European 1% Tagalog/Filipino 1%
Political lean MEDSL · Placer
- 2024 margin
- Lean R (+8.5) · D 44.3% · R 52.8% · Other 2.9%
- 2008→2024 swing
- +2.8pp toward D · 2008: -11.3pp · 2024: -8.5pp
- All cycles
- 2024: R+8.5 2020: R+6.7 2016: R+11.3 2012: R+20.1 2008: R+11.3
Not yet ingested
- Civics
- —
Market trends
- HPI YoY
- ▼ -500.89%
- Current HPI
- 251.4573
- Rent YoY
- ▲ 2.34%
- Metro
- Sacramento-Roseville-Folsom, CA
- State GDP YoY
- ▲ 3.21%
- F500 in state
- 116
Industry mix (Fortune 500 HQ in CA)
| Industry | F500 HQs | Revenue |
|---|---|---|
| Technology | 27 | $1,492B |
|
||
| Financial Services | 3 | $174B |
|
||
| Retail | 3 | $44B |
|
||
| Insurance | 3 | $26B |
|
||
| Media / Entertainment | 2 | $115B |
|
||
| Pharmaceuticals / Biotech | 2 | $62B |
|
||
Cash-flow waterfall
monthlySold comps — $/sqft
last 12 mo · ≤1 miLoading sold comps…