3301 NE 1st Ave Unit H1608 · Miami, FL
Flood risk 1/10 · Minimal
- FEMA flood zone
- X (unshaded)
- Chance of flooding over 30 yrs
- 0.0%
- Est. flood insurance / yr
- $507 – $1,088
Fire risk 1/10 · Minimal
- Est. fire insurance / yr
- $947 – $1,759
Heat risk 10/10 · Severe
- Hot days now (above 103°F)
- 6 days/yr
- Hot days in 30 yrs
- 24 days/yr
Wind risk 10/10 · Severe
- Chance of severe wind over 30 yrs
- 99.0%
Air-quality risk 2/10 · Minimal
- Unhealthy air days now
- 1 days/yr
- Unhealthy air days in 30 yrs
- 1 days/yr
Risk factors via First Street. Map © Google.
Why this score? — see what drove the D grade
The composite is a weighted blend of 9 inputs, each scored 0–100. Each bar is that input's sub-score; the figure is the points it added to the 100-point composite (weight × sub-score).
- ARV discount +7.5/15.0
- Cash flow +7.4/30.0
- 1% rule +5.1/10.0
- Appreciation +5.1/10.0
- Schools +4.2/10.0
- Livability +3.9/5.0
- Rent growth +3.2/5.0
- Condition / age +2.5/5.0
- DSCR +1.5/10.0
$485,000
🖨 Deal sheet (PDF) 📄 Offer letter ✓ Due diligence
Listing remarks
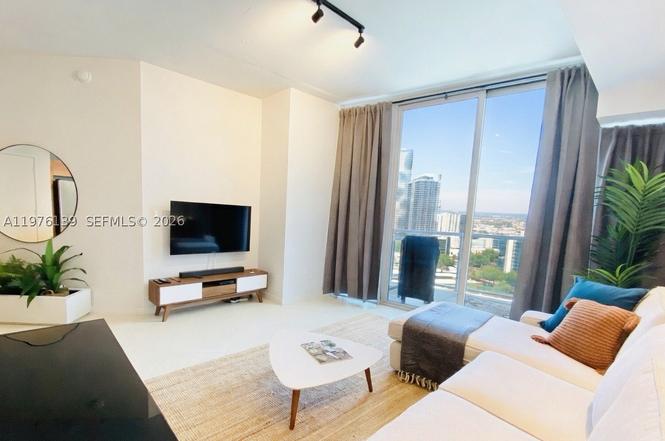
Lovely large 1 bedroom industrial style loft fully furnished and updated. This modern residence offers amazing views of Biscayne Bay and the city skyline from your private balcony, with cool exposed concrete ceilings, huge floor-to-ceiling windows for tons of natural light, stylish flooring, and an open kitchen featuring stainless steel appliances. Enjoy resort-style amenities such as infinity pool and hot tub, sauna, steam room, modern fitness center, BBQ areas, business center, 24-hour security and concierge. You’re just steps from Midtown’s top shops, restaurants, and nightlife, with easy walking access to the luxury Design District for shopping and art, and the creative Wynw
Key facts
- Hot tub
- Private balcony
- Sauna
Tags
Property features AI
Finance
- Financial info: Pets allowed (dogs OK)
- HOA & community: Monthly association fee (amount included in listing); Association amenities include business center, clubhouse, fitness center, barbecue/picnic area, playground, pool, sauna, spa/hot tub, and elevators; Association fee covers amenities, common areas, and structure maintenance; Community contains multiple units (approximately 300 units)
Exterior
- Parking: Assigned covered parking; Detached carport (1 space); Detached garage (1 space); One covered space included (total covered spaces: 2)
- Security: Doorman; Elevator secured; Key card entry
- Utilities: Cable available
- Home design: Condominium (attached property); East-facing; Entry on level 16; Single-story unit within a multi-story building
- Construction: Block construction; Resale property
- Exterior features: Security/high impact doors; Exterior lighting; Has a view; Property is attached
Interior
- Kitchen: Dishwasher; Eat-in kitchen
- Bedrooms: Bedroom located on the main level
- Flooring: Ceramic tile
- Bathrooms: 1 full bathroom; 1 half bathroom
- Heating & cooling: Central heating; Central air; Ceiling fan(s)
- Interior features: Blinds and drapes; Furnished; Eat-in kitchen; Living/dining room; First floor entry; Main living area on entry level; Bedroom on main level
- Laundry & utility: Dryer; Laundry/utility room
Neighborhood map
What this means for you Summary
Snapshot
- This is a 1-bed/1.0-bath condo listed at $485k.
Deal economics
- At list price, monthly cash flow is $-630 ($-8k/yr) — negative.
- To cash-flow at today's rent, offer at most $374k (23.0% below list).
- Meets the 1% rule at list price ($5k rent vs $485k).
- Recommended offer: $374k (23.0% below list) — sets the bar for cash-flow.
Location & tenants
- Location reads 78/100 on livability (#177 in FL, #2,724 nationally) — a middle-class / working-renter tenant base. Strengths: amenities A+, commute A+, health & safety A+; Watch: employment C-, crime F, cost of living F.
- Miami-Dade (suburban): math 45% / reading 54% proficiency, ranked #40 of 73 in FL (top 55%) — families likely to look elsewhere, expect single-tenant / working-renter base with shorter leases; 64% free/reduced lunch — lower-income household profile, screen leases tightly.
- Zoned schools: Eneida M. Hartner Elementary School (math 42% / reading 37%, grade F, #1,513 of 2,144 statewide, top 73%, 377 students, 72% FRL); Jose De Diego Middle School (math 20% / reading 24%, grade F, #549 of 571 statewide, top 97%, 868 students, 68% FRL); Booker T. Washington Senior High (math 12% / reading 19%, grade F, #604 of 667 statewide, top 91%, 1,014 students, 60% FRL) — zoned schools at 67% FRL track the district average.
- Zoned-school proficiency averages 26% at this address vs 50% district-wide (-24 pts) — the specific schools serving this property underperform the Miami-Dade average; the district grade overstates school quality for this exact location.
- Market conditions: Rents rising (+2.7%/yr); 758 active listings in the ZIP; 2 comparable units currently listed for rent nearby; solid renter incomes; 10,051 units permitted in Miami-Dade County in 2024 (7,758 in 5+ unit buildings).
Forward outlook
- In year one you build about $5k of equity ($3k loan paydown + $1k appreciation (0.3% local appreciation)).
- Miami-Dade County population projected at +28% by 2050 — long-run rental-demand tailwind backs the buy-and-hold thesis.
- By year 6, paydown + projected appreciation supports a ~$30k cash-out refi (75% LTV) — recoverable capital for the next deal without selling this one.
Negotiation context
- It's been on market 101 days — a 9% lower offer ($441k) is reasonable based on typical stale-listing flexibility.
- 8 sale attempts since 6y ago; this cycle's ask is 12178% above the opening price — seller raised mid-cycle; expect resistance to lowballs.
- Current owner paid $315k; list at $485k implies a 54% gain — meaningful room to come down on a strong offer.
Risks & watch-outs
- Watch-outs: HOA is 21% of rent.
- Climate carrying-cost: severe wind risk, 99% chance of damaging wind over 30y; extreme-heat days projected 6→24/yr by 2055 (HVAC capex compounding) — expect insurance premiums to compound above CPI over the hold.
Questions for the listing agent
- What do current leases actually rent for vs. the listed asking? Can we see a recent rent roll and the last 12 months of T-12 income?
- It's been on market 101 days. Have you received any prior offers? Is the seller open to a 23% concession, seller financing, or rate buy-down credit?
- What does the HOA fee cover, when was the last increase, and are there any pending special assessments or reserve-fund shortfalls?
- Any open or pending special assessments — roof, HVAC, plumbing, elevator, façade? What's the per-unit balance and payoff schedule, and is the seller paying it off at close or rolling it to the buyer?
- Why hasn't it sold? Are there any deal-killer items the seller is aware of (foundation, flood, title, zoning, code violations)?
- Is there a deadline driving the sale (1031 exchange, divorce, estate, relocation)? That informs how much negotiation room exists.
- Schools are B-rated — typically a magnet for longer-tenancy family renters. What's the average tenant stay here, and is there a school-zone premium baked into asking?
- Crime grade is F in this area — have there been break-ins, vandalism, or insurance claims at this property in the last 3 years? What carrier currently insures it and at what premium?
- The area grade is low — what's the realistic commute time and amenity access for the typical tenant pool here? Any planned neighborhood developments (good or bad) we should know about?
- What's the average days-on-market for RENTAL listings here right now (not sales)? A rising rental-DOM trend means longer vacancies and softer asking-rent achievability than the comps imply.
- What's the recent tenant-quality profile in this submarket — average credit score on applications, eviction rate, late-payment / NSF rate, and stable-employment percentage? A property-management company in the area should have these aggregated.
- How much new apartment / multifamily construction is in the pipeline within 1–3 miles? Heavy new supply (>2% of stock underway) typically softens rents 12–24 months out; light construction supports rent growth.
Investment metrics
- 1% rule
- 1.01% ✓
- Cap rate
- 4.73%
- Cash-on-cash
- -5.57%
- DSCR
- 0.75
- GRM
- 8.2
CMA / ARV
No comps found within radius.
Projected returns pro-forma
0.27% appreciation · 2.73% rent growth · sell at horizon
- IRR
- -7.5%
- Equity multiple
- 0.64×
- Total profit
- $-48,650
- Equity at exit
- $147,459
- IRR
- -1.7%
- Equity multiple
- 0.81×
- Total profit
- $-25,547
- Equity at exit
- $182,633
Cash invested: $135,800 (down + closing). Projections, not guarantees.
Landlord ↔ Tenant lean methodology
- Overall (STATE)
- 87 Strongly Landlord-Friendly
- State Florida
- 87 Strongly Landlord-Friendly · R+3
- County
- — inherits STATE
- City
- — inherits STATE
ZIP-level market 33137
- Home prices YoY
- 0.1%
- Rents YoY
- 2.7%
- Active inventory
- 758
- Price-to-rent
- 8.2×
Monthly cashflow live
- Estimated rent
- $4,915 medium interval (Pro) →
- Mortgage (P&I)
- −$2,543
- Tax from tax record
- −$734 /mo · $8,804/yr
- Insurance
- −$202
- HOA
- −$1,034
- Vacancy / Maint / Mgmt
- −$1,032
- Net cashflow
- $-630
Break-even live
Sensitivity live
| Price | -10% $-356 | -5% $-493 | +0% $-630 | +5% $-768 | +10% $-905 |
|---|---|---|---|---|---|
| Rent | -10% $-1,019 | -5% $-825 | +0% $-630 | +5% $-436 | +10% $-242 |
| Rate | -1.0pp $-386 | -0.5pp $-507 | base $-630 | +0.5pp $-756 | +1.0pp $-884 |
UW: 25.0% down · 7.5% · 30yr · 1.5% tax · 5.0% vac · 8.0% maint · 8.0% mgmt
Financing live
Cash to close
- Down payment
- $121,250
- Closing costs
- $14,550
- Reserves months
- —
- Total cash needed
- —
Loan-product check · same deal, 3 products live
Conventional
25% down · 7.5% · 30yr
- Down + closing
- —
- Monthly P&I
- —
- Monthly cashflow
- —
- DSCR
- —
- Eligible?
- —
Personal DTI + credit; lowest rate.
DSCR
20% down · 8.5% · 30yr
- Down + closing
- —
- Monthly P&I
- —
- Monthly cashflow
- —
- DSCR
- —
- Eligible?
- —
No personal income docs; deal must DSCR.
Hard money
10% down · 12.0% · 12mo
- Down + closing
- —
- Monthly P&I
- —
- Monthly cashflow
- —
- DSCR
- —
- Eligible?
- —
Short-term bridge; refi at stabilization.
Rent comps 2 comps
| Address | Beds | Baths | Sqft | Rent | $/sqft | DOM | Units | Dist |
|---|---|---|---|---|---|---|---|---|
| 2900 Biscayne Blvd Miami, FL | 3.0 | 1.0–3.5 | 1260 | $8,110 | $6.44 | 3d | 13 | 0.28mi |
| 555 NE 34th St Miami, FL | 1.0–4.0 | 1.5–4.0 | 2653 | $3,771 | $1.42 | 0d | 19 | 0.36mi |
HOA detail condo
- Monthly dues
- $1,034 · $12,408/yr
- Likely covers
- poolgymdoormansecurity
- Assessments
- None detected in remarks — confirm with the listing agent.
Listing history 41 events
-
2026-06-21days on market $485,000 Active 101 DOM
-
2026-06-18days on market $485,000 Active 98 DOM
-
2026-06-17days on market $485,000 Active 97 DOM
-
2026-06-16days on market $485,000 Active 96 DOM
-
2026-06-15days on market $485,000 Active 95 DOM
-
2026-06-13days on market $485,000 Active 93 DOM
-
2026-06-09days on market $485,000 Active 89 DOM
-
2026-06-08days on market $485,000 Active 88 DOM
-
2026-06-07days on market $485,000 Active 87 DOM
-
2026-06-04days on market $485,000 Active 84 DOM
-
2026-06-03days on market $485,000 Active 83 DOM
-
2026-06-02days on market $485,000 Active 82 DOM
-
2026-06-01days on market $485,000 Active 81 DOM
-
2026-05-31days on market $485,000 Active 80 DOM
-
2026-05-14$3,950
-
2026-05-07historical $3,250
-
2026-04-30price $3,250
-
2026-04-24price $485,000
-
2026-04-15$3,350
-
2026-03-06$495,000 Active
-
2024-05-03historical $3,295
-
2024-04-27price $3,295
-
2024-03-31price $3,525
-
2024-03-05price $3,500
-
2024-02-06$3,550
-
2024-01-29historical $3,650
-
2024-01-23$3,650
-
2024-01-17historical $3,700
-
2024-01-01price $3,700
-
2023-12-13price $3,907
-
2023-12-08price $3,900
-
2023-10-27$4,500
-
2021-07-19soldstatus $315,000
-
2020-12-22historical
-
2020-12-03status Active
-
2020-10-06price $334,900
-
2020-09-14price $339,900
-
2020-08-04price $344,900
-
2020-06-02$348,000 Active
-
2013-04-17soldstatus $353,900
-
2011-07-01soldstatus $231,900
ⓘ Source: listings_history table (triggers on properties + properties_extension) + one-shot
backfill from property_details.listing_events for pre-trigger history.
Tax reassessment forecast FL · Resets to sale price
- Current annual tax
- $8,804 · $734/mo
- Projected year-2 tax
- $8,804 · $734/mo
- Expected delta
- $0/yr ($0/mo · 0.0%)
ⓘ Screening estimate from a state-policy table — verify with the county assessor before closing.
Climate risk First Street
- Flood 1/10 Low FEMA zone X (unshaded) · 0% chance over 30 yrs
- Wildfire 1/10 Low
- Heat 10/10 Extreme 6 d/yr ≥103°F today · 24 d/yr by 30 yrs out
- Wind 10/10 Extreme 99% chance of damaging wind over 30 yrs
- Air quality 2/10 Low 1 unhealthy d/yr today · 1 by 30 yrs out
Nearby sold comps map
Loading sold comps map…
Walkable amenities ~0.75 mi
Loading nearby amenities…
Taxation est. · year 1
- Rental income
- $58,978
- − Mortgage interest
- −$27,168
- − Property taxes
- −$8,804
- − Insurance
- −$2,425
- − Repairs & maintenance
- −$4,718
- − Management
- −$4,718
- − HOA
- −$12,408
- − Depreciation
- −$14,109
- Taxable loss
- −$15,372
- Est. tax savings @ 24.0%
- +$3,689
- After-tax cash flow
- $-3,875/yr
For passive investors: Depreciation is non-cash, so a rental often shows a tax loss while cash-flowing — sheltering income. Rental losses are passive: they offset passive income freely, and up to $25,000/yr can offset ordinary (W-2) income if you actively participate and your MAGI is under $100k (phasing out to $0 by $150k); unused losses carry forward. On sale, claimed depreciation is recaptured at up to 25%, and gains may owe capital-gains tax (a 1031 exchange can defer both). Figures are a year-1 estimate at your 24.0% rate — not tax advice; consult a CPA.
Schools (NCES district)
- District
- Miami-Dade
- NCES district ID
- 1200390
- Math proficiency
- 45% ▼ -16.00%
- Reading proficiency
- 54% ▼ -5.00%
- Median HH income
- $43,928
- Composite
- 41.76/100
- National rank
- #3397
- State rank
- #40 of 73 in FL
Livability — Miami
- Score
- 78/100
- State rank
- #177
- US rank
- #2724
Category grades
Schools grade is shown separately in the Schools card above.
Census & demographics
- Census place
- Miami, FL
- County
- Miami-Dade County · 2,697,751 people
- City population
- 827,308
- Metro
- Miami-Fort Lauderdale-Pompano Beach, FL
- Population (ZIP)
- 29,414
- Household income
- $94,036
- Rent vs Own
- Severe rent burden
- 3106.0
Population outlook (Miami-Dade County) Hauer SSP2
- Today (2025)
- 3,126,439 people
- By 2030
- 3,325,765 · +6.4%
- By 2040
- 3,697,561 · +18.3%
- By 2050
- 4,012,134 · +28.3%
- By 2075
- 4,605,612 · +47.3%
- By 2100
- 4,866,598 · +55.7%
Race, ethnicity, and origin ACS 2023
- Neighborhood character
- Diverse neighborhood (Simpson 0.63)
- Race & ethnicity
- Hispanic / Latino 54% Two or more races 25% White 24% Black 16% Asian 2%
- Hispanic origin (detail)
- Mexican 1% Puerto Rican 5% Cuban 10% Dominican 3% Salvadoran 3%
- Common ancestry
- Hispanic 8% Estonian 2% Lithuanian 2%
- Foreign-born
- 47% · Canada, Jamaica, Dominican Republic
- Languages at home
- 34% English-only · Spanish 49% French/Haitian/Cajun 8% Other Indo-European 5%
Political lean MEDSL · Miami-Dade
- 2024 margin
- R (+11.4) · D 43.9% · R 55.4%
- 2008→2024 swing
- -27.6pp toward R · 2008: 16.1pp · 2024: -11.4pp
- All cycles
- 2024: R+11.4 2020: D+7.3 2016: D+29.6 2012: D+23.7 2008: D+16.1
Not yet ingested
- Civics
- —
Market trends
- HPI YoY
- ▲ 0.27%
- Current HPI
- 385.1514
- Rent YoY
- ▲ 2.73%
- Metro
- Miami-Fort Lauderdale-Pompano Beach, FL
- State GDP YoY
- ▲ 3.28%
- F500 in state
- 36
Industry mix (Fortune 500 HQ in FL)
| Industry | F500 HQs | Revenue |
|---|---|---|
| Industrial Technology | 2 | $29B |
|
||
| Insurance | 2 | $17B |
|
||
| Retail | 1 | $60B |
|
||
| Technology Distribution | 1 | $58B |
|
||
| Homebuilding | 1 | $35B |
|
||
| Technology Manufacturing | 1 | $35B |
|
||
Price history
-98.3% since first listed27 events — show timeline
- 2026-05-14 Listed for Rent $3,950 MARMLS
- 2026-05-07 Rental Removed $3,250 MARMLS
- 2026-04-30 Price Changed $3,250 MARMLS
- 2026-04-24 Price Changed $485,000 MARMLS
- 2026-04-15 Listed for Rent $3,350 MARMLS
- 2026-03-06 Listed $495,000 MARMLS
- 2024-05-03 Rental Removed $3,295 MARMLS
- 2024-04-27 Price Changed $3,295 MARMLS
- 2024-03-31 Price Changed $3,525 MARMLS
- 2024-03-05 Price Changed $3,500 MARMLS
- 2024-02-06 Listed for Rent $3,550 MARMLS
- 2024-01-29 Rental Removed $3,650 MARMLS
- 2024-01-23 Listed for Rent $3,650 MARMLS
- 2024-01-17 Rental Removed $3,700 MARMLS
- 2024-01-01 Price Changed $3,700 MARMLS
- 2023-12-13 Price Changed $3,907 MARMLS
- 2023-12-08 Price Changed $3,900 MARMLS
- 2023-10-27 Listed for Rent $4,500 MARMLS
- 2021-07-19 Sold (Public Records) $315,000 Public Records
- 2020-12-22 Listing Removed — MARMLS
- 2020-12-03 Relisted — MARMLS
- 2020-10-06 Price Changed $334,900 MARMLS
- 2020-09-14 Price Changed $339,900 MARMLS
- 2020-08-04 Price Changed $344,900 MARMLS
- 2020-06-02 Listed $348,000 MARMLS
- 2013-04-17 Sold (Public Records) $353,900 Public Records
- 2011-07-01 Sold (Public Records) $231,900 Public Records
Property tax history
+5.3%/yrLatest (2025): $8,804 · +0.2% YoY. Source: county tax records.
Cash-flow waterfall
monthlySold comps — $/sqft
last 12 mo · ≤1 miLoading sold comps…