 🏷️ Likely Rental
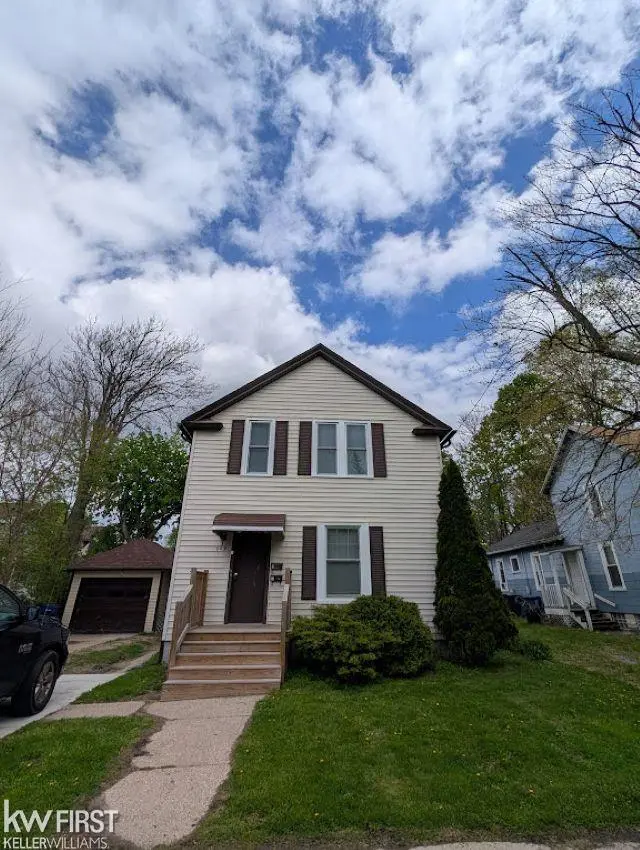
609 Thomson St · Flint, MI
Flood risk 1/10 · Minimal
- FEMA flood zone
- X (unshaded)
- Chance of flooding over 30 yrs
- 0.0%
- Est. flood insurance / yr
- $473 – $860
Fire risk 1/10 · Minimal
- Est. fire insurance / yr
- $784 – $1,456
Heat risk 2/10 · Minimal
- Hot days now (above 97°F)
- 7 days/yr
- Hot days in 30 yrs
- 15 days/yr
Wind risk 2/10 · Minimal
- Chance of severe wind over 30 yrs
- —
Air-quality risk 3/10 · Minor
- Unhealthy air days now
- 3 days/yr
- Unhealthy air days in 30 yrs
- 4 days/yr
Risk factors via First Street. Map © Google.
Why this score? — see what drove the C grade
The composite is a weighted blend of 9 inputs, each scored 0–100. Each bar is that input's sub-score; the figure is the points it added to the 100-point composite (weight × sub-score).
- Cash flow +18.7/30.0
- ARV discount +15.0/15.0
- 1% rule +6.7/10.0
- DSCR +5.9/10.0
- Rent growth +5.0/5.0
- Livability +3.7/5.0
- Condition / age +2.5/5.0
- Schools +1.1/10.0
- Appreciation +0.0/10.0
$115,000
🖨 Deal sheet 📄 Offer letter ✓ Due diligence
Listing remarks MLS
Great multi-family investment opportunity in East Village near downtown Flint. This is a prime rental market located right in between the University of Michigan - Flint Campus, the Flint College Cultural Center and the newly proposed Central Highschool campus redevelopment. This is an opportunity to invest in the path of progress in an area where hundreds of millions of dollars are pouring into revitalization efforts. Lower unit pays $700/month and upstairs tenant pays $875. Owner pays water, tenant pays gas & electric. Lower unit is month-month, upstairs tenant is on year lease. Each unit has it's own water heater & furnace. 24 hour notice to show.
Key facts
- Prime rental market
- Own water heater
- Own furnace
Tags
Property features AI
Finance
- Other: Lot dimensions approximately 59 x 66 x 58 x 66; Lot size about 0.08 acres; Annual tax: $3,566
- Financial info: Unit rents: $700 and $875
Exterior
- Parking: Detached 1-car garage
- Utilities: Public water; Public sewer
- Home design: Multi-family residential income property; Two levels; Subdivision: AUSTIN B WITHERBEES ADD
- Construction: Above-grade finished area: 1,849 (square feet)
- Exterior features: Paved road access; Curbs
Interior
- Bathrooms: 2 full bathrooms
- Heating & cooling: Forced air heating; Natural gas heating; Separate meters for heating; No central cooling
- Interior features: Gas water heater; Basement
Neighborhood map
What this means for you Summary
Snapshot
- This is a 4-bed/2.0-bath single-family listed at $115k.
Deal economics
- At list price, monthly cash flow is $114 ($1k/yr) — positive.
- The deal already cash-flows at list — no discount required.
- Meets the 1% rule at list price ($1k rent vs $115k).
- Recommended offer: $112k (3.0% below list) — sets the bar for market timing.
- Cap rate 7.5% vs local median 11.5% in Flint — below-typical yield; the buyer is paying a premium for something (appreciation thesis, condition, location) that the cap rate doesn't capture.
Location & tenants
- Location reads 74/100 on livability (#196 in MI, #4,946 nationally) — a middle-class / working-renter tenant base. Strengths: commute A+, cost of living A+, housing A+; Watch: schools F, crime F, employment F.
- Flint School District (urban): math 7% / reading 13% proficiency, ranked #714 of 760 in MI (top 94%) — low school quality limits family demand, transient renter base, plan for 1-2y turnover; 83% free/reduced lunch — lower-income household profile, screen leases tightly.
- Market conditions: Rents rising fast (+12.3%/yr); 135 active listings in the ZIP; 1 comparable units currently listed for rent nearby; lower-income renter base — watch delinquency; 419 units permitted in Genesee County in 2024 (68 in 5+ unit buildings).
- This rent runs 36% of the median local income ($44k/yr) — at the standard rent-burdened threshold; future hikes will face affordability resistance.
Forward outlook
- Local home prices are declining (-3.0%/yr); year-one equity from $795 of loan paydown is wiped out by about $3k of value loss. Plan a longer hold.
- Genesee County population projected at -27% by 2050 — secular population decline; favor cash flow + early exit over multi-decade hold.
- At projected returns (-3.0% appreciation + 8.0% rent growth), your $32k cash investment doubles in ~9 years — after that, you're playing with house money.
Negotiation context
- It's been on market 42 days — a 3% lower offer ($112k) is reasonable based on typical stale-listing flexibility.
- 4 sale attempts since 2y ago; this cycle's ask has dropped $10k (8%) from the opening price — seller is motivated, your offer sets the floor, not the list.
- Current owner paid $100k; 15% above their basis — modest negotiation headroom, anchor on the comps not their cost.
Risks & watch-outs
- Watch-outs: property tax is 3.1% of price; built in 1900 — expect roof / HVAC / electrical / plumbing capex.
Questions for the listing agent
- It's been on market 42 days. Have you received any prior offers? Is the seller open to a 3% concession, seller financing, or rate buy-down credit?
- Built in 1900 — when were the roof, HVAC, electrical panel, plumbing, and water heater last replaced?
- Property tax is high relative to price — has the assessment been appealed recently, and will the sale trigger a re-assessment?
- Is there a deadline driving the sale (1031 exchange, divorce, estate, relocation)? That informs how much negotiation room exists.
- Schools are F-rated, which usually means shorter tenancies and higher turnover. Who's the typical renter profile here, and what's been the actual vacancy rate?
- Crime grade is F in this area — have there been break-ins, vandalism, or insurance claims at this property in the last 3 years? What carrier currently insures it and at what premium?
- What's the average days-on-market for RENTAL listings here right now (not sales)? A rising rental-DOM trend means longer vacancies and softer asking-rent achievability than the comps imply.
- What's the recent tenant-quality profile in this submarket — average credit score on applications, eviction rate, late-payment / NSF rate, and stable-employment percentage? A property-management company in the area should have these aggregated.
- How much new for-sale + rental construction is in the pipeline within 1–3 miles? Heavy new supply typically softens prices + rents 12–24 months out; constrained supply supports both.
Investment metrics
- 1% rule
- 1.17% ✓
- Cap rate
- 7.48%
- Cash-on-cash
- 4.25%
- DSCR
- 1.19
- GRM
- 7.1
CMA / ARV
- ARV (on-the-fly)
- $199,692
- Comps found
- 12
Show comp detail 12 sales within ~0.75 mi
| Address | Dist | Beds/Ba | Sqft | Sold | Price | $/sf | Match |
|---|---|---|---|---|---|---|---|
| 620 E 2nd St | 0.10mi | 4/2.0 | 1,818 (-2%) | 5mo | $68,000 | $37 | 88 |
| 802 E 2nd St | 0.02mi | 4/2.0 | 1,820 (-2%) | 14mo | $99,000 | $54 | 85 |
| 722 E 6th St | 0.33mi | 3/2.5 (-1) | 1,812 (-2%) | 10mo | $129,000 | $71 | 66 |
| 1513 Brookwood Ave | 0.72mi | 4/1.5 | 1,845 (-0%) | 8mo | $212,500 | $115 | 57 |
| 1007 E Fork Dr | 0.53mi | 4/1.5 | 2,000 (+8%) | 14mo | $230,000 | $115 | 48 |
| 1320 Beard St | 0.62mi | 3/2.0 (-1) | 1,879 (+2%) | 20mo | $152,000 | $81 | 46 |
| 1018 Blanchard Ave | 0.68mi | 3/1.5 (-1) | 1,784 (-4%) | 16mo | $193,000 | $108 | 42 |
| 927 Kensington Ave | 0.75mi | 3/1.5 (-1) | 1,767 (-4%) | 11mo | $200,000 | $113 | 42 |
| 1309 Riverdale St | 0.46mi | 3/2.0 (-1) | 2,027 (+10%) | 19mo | $215,000 | $106 | 41 |
| 1012 Kensington Ave | 0.73mi | 3/2.5 (-1) | 1,707 (-8%) | 9mo | $215,000 | $126 | 39 |
| 1613 Woodlawn Park Dr | 0.69mi | 3/2.0 (-1) | 2,037 (+10%) | 14mo | $240,000 | $118 | 34 |
| 924 Church St | 0.74mi | 5/2.0 (+1) | 2,012 (+9%) | 19mo | $47,000 | $23 | 30 |
Match score weights: distance 35% · size 25% · config 20% · recency 20%. Top-matched comps best support the ARV.
Projected returns pro-forma
-3.0% appreciation · 8.0% rent growth · sell at horizon
- IRR
- -3.2%
- Equity multiple
- 0.87×
- Total profit
- $-4,142
- Equity at exit
- $17,147
- IRR
- 12.0%
- Equity multiple
- 2.20×
- Total profit
- $38,567
- Equity at exit
- $9,943
Cash invested: $32,200 (down + closing). Projections, not guarantees.
Landlord ↔ Tenant lean methodology
- Overall (STATE)
- 62 Landlord-Friendly
- State Michigan
- 62 Landlord-Friendly · EVEN
- County
- — inherits STATE
- City
- — inherits STATE
ZIP-level market 48503
- Home prices YoY
- -27.7%
- Rents YoY
- 12.3%
- Active inventory
- 135
- Price-to-rent
- 7.1×
Monthly cashflow live
- Estimated rent
- $1,345 medium interval (Pro) →
- Mortgage (P&I)
- −$603
- Tax from tax record
- −$297 /mo · $3,566/yr
- Insurance
- −$48
- HOA
- −$0
- Vacancy / Maint / Mgmt
- −$282
- Net cashflow
- $114
Break-even live
UW: 25.0% down · 7.5% · 30yr · 1.5% tax · 5.0% vac · 8.0% maint · 8.0% mgmt
Financing live
Cash to close
- Down payment
- $28,750
- Closing costs
- $3,450
- Reserves months
- —
- Total cash needed
- —
Loan-product check · same deal, 3 products live
Conventional
25% down · 7.5% · 30yr
- Down + closing
- —
- Monthly P&I
- —
- Monthly cashflow
- —
- DSCR
- —
- Eligible?
- —
Personal DTI + credit; lowest rate.
DSCR
20% down · 8.5% · 30yr
- Down + closing
- —
- Monthly P&I
- —
- Monthly cashflow
- —
- DSCR
- —
- Eligible?
- —
No personal income docs; deal must DSCR.
Hard money
10% down · 12.0% · 12mo
- Down + closing
- —
- Monthly P&I
- —
- Monthly cashflow
- —
- DSCR
- —
- Eligible?
- —
Short-term bridge; refi at stabilization.
Rent comps 1 comps
| Address | Beds | Baths | Sqft | Rent | $/sqft | DOM | Units | Dist |
|---|---|---|---|---|---|---|---|---|
| 1540 Garland St Flint, MI | 3.0 | 2.5 | 1344 | $1,017 | $0.76 | 21d | 1 | 1.38mi |
Listing history 24 events
-
2026-06-18days on market $115,000 Active 42 DOM
-
2026-06-17days on market $115,000 Active 41 DOM
-
2026-06-16days on market $115,000 Active 40 DOM
-
2026-06-15days on market $115,000 Active 39 DOM
-
2026-06-14days on market $115,000 Active 37 DOM
-
2026-06-13pricedays on market $115,000 Active 36 DOM
-
2026-06-10days on market $125,000 Active 34 DOM
-
2026-06-09days on market $125,000 Active 33 DOM
-
2026-06-08days on market $125,000 Active 32 DOM
-
2026-06-07days on market $125,000 Active 31 DOM
-
2026-06-05days on market $125,000 Active 28 DOM
-
2026-06-03days on market $125,000 Active 27 DOM
-
2026-06-02days on market $125,000 Active 26 DOM
-
2026-06-01days on market $125,000 Active 25 DOM
-
2026-05-31days on market $125,000 Active 24 DOM
-
2026-05-30days on market $125,000 Active 23 DOM
-
2026-05-07$125,000 Active 669-char remark
Show marketing remark (669 chars)
Great multi-family investment opportunity in East Village near downtown Flint. This is a prime rental market located right in between the University of Michigan - Flint Campus, the Flint College Cultural Center and the newly proposed Central Highschool campus redevelopment. This is an opportunity to invest in the path of progress in an area where hundreds of millions of dollars are pouring into revitalization efforts. Lower unit pays $700/month and upstairs tenant pays $875. Owner pays water, tenant pays gas & electric. Lower unit is month-month, upstairs tenant is on year lease. Each unit has it's own water heater & furnace. 24 hour notice to show.
-
2026-05-07$125,000 Active
Show marketing remark (669 chars)
Great multi-family investment opportunity in East Village near downtown Flint. This is a prime rental market located right in between the University of Michigan - Flint Campus, the Flint College Cultural Center and the newly proposed Central Highschool campus redevelopment. This is an opportunity to invest in the path of progress in an area where hundreds of millions of dollars are pouring into revitalization efforts. Lower unit pays $700/month and upstairs tenant pays $875. Owner pays water, tenant pays gas & electric. Lower unit is month-month, upstairs tenant is on year lease. Each unit has it's own water heater & furnace. 24 hour notice to show.
-
2024-09-11soldstatus $100,000
-
2024-08-28soldstatus $100,000 Closed 425-char remark
Show marketing remark (425 chars)
Must See! Two occupied units One bedroom entry level unit, 3 bedrooms upper unit Each unit has it's own furnace Separate gas and electricity New improvements include 2020 New wood porch 2021 New windows, New chimney, New Roof and gutters 2022 Unit 1 New carpet New Furnace New toilet 2023 New Front porch Added blown insulation and New furnace for unit 2 Plus other improvements Ideal Investment long Term Tena Call Now!
-
2024-08-28soldstatus $100,000
Show marketing remark (425 chars)
Must See! Two occupied units One bedroom entry level unit, 3 bedrooms upper unit Each unit has it's own furnace Separate gas and electricity New improvements include 2020 New wood porch 2021 New windows, New chimney, New Roof and gutters 2022 Unit 1 New carpet New Furnace New toilet 2023 New Front porch Added blown insulation and New furnace for unit 2 Plus other improvements Ideal Investment long Term Tena Call Now!
-
2024-05-02status Pending 425-char remark
Show marketing remark (425 chars)
Must See! Two occupied units One bedroom entry level unit, 3 bedrooms upper unit Each unit has it's own furnace Separate gas and electricity New improvements include 2020 New wood porch 2021 New windows, New chimney, New Roof and gutters 2022 Unit 1 New carpet New Furnace New toilet 2023 New Front porch Added blown insulation and New furnace for unit 2 Plus other improvements Ideal Investment long Term Tena Call Now!
-
2024-02-28$125,000 Active 425-char remark
Show marketing remark (425 chars)
Must See! Two occupied units One bedroom entry level unit, 3 bedrooms upper unit Each unit has it's own furnace Separate gas and electricity New improvements include 2020 New wood porch 2021 New windows, New chimney, New Roof and gutters 2022 Unit 1 New carpet New Furnace New toilet 2023 New Front porch Added blown insulation and New furnace for unit 2 Plus other improvements Ideal Investment long Term Tena Call Now!
-
2024-02-28$125,000
Show marketing remark (425 chars)
Must See! Two occupied units One bedroom entry level unit, 3 bedrooms upper unit Each unit has it's own furnace Separate gas and electricity New improvements include 2020 New wood porch 2021 New windows, New chimney, New Roof and gutters 2022 Unit 1 New carpet New Furnace New toilet 2023 New Front porch Added blown insulation and New furnace for unit 2 Plus other improvements Ideal Investment long Term Tena Call Now!
ⓘ Source: listings_history table (triggers on properties + properties_extension) + one-shot
backfill from property_details.listing_events for pre-trigger history.
Tax reassessment forecast MI · Partial reset (capped growth)
- Current annual tax
- $3,566 · $297/mo
- Projected year-2 tax
- $3,566 · $297/mo
- Expected delta
- $0/yr ($0/mo · 0.0%)
ⓘ Screening estimate from a state-policy table — verify with the county assessor before closing.
Climate risk First Street
- Flood 1/10 Low FEMA zone X (unshaded) · 0% chance over 30 yrs
- Wildfire 1/10 Low
- Heat 2/10 Low 7 d/yr ≥97°F today · 15 d/yr by 30 yrs out
- Wind 2/10 Low
- Air quality 3/10 Moderate 3 unhealthy d/yr today · 4 by 30 yrs out
Nearby sold comps map
Loading sold comps map…
Walkable amenities ~0.75 mi
Loading nearby amenities…
Taxation est. · year 1
- Rental income
- $16,137
- − Mortgage interest
- −$6,442
- − Property taxes
- −$3,566
- − Insurance
- −$575
- − Repairs & maintenance
- −$1,291
- − Management
- −$1,291
- − Depreciation
- −$3,345
- Taxable loss
- −$374
- Est. tax savings @ 24.0%
- +$90
- After-tax cash flow
- $1,460/yr
For passive investors: Depreciation is non-cash, so a rental often shows a tax loss while cash-flowing — sheltering income. Rental losses are passive: they offset passive income freely, and up to $25,000/yr can offset ordinary (W-2) income if you actively participate and your MAGI is under $100k (phasing out to $0 by $150k); unused losses carry forward. On sale, claimed depreciation is recaptured at up to 25%, and gains may owe capital-gains tax (a 1031 exchange can defer both). Figures are a year-1 estimate at your 24.0% rate — not tax advice; consult a CPA.
Schools (NCES district)
- District
- Flint School District
- NCES district ID
- 2614520
- Math proficiency
- 7% ▬ 0.00%
- Reading proficiency
- 13% ▲ 3.00%
- Median HH income
- $25,954
- Composite
- 10.97/100
- National rank
- #14642
- State rank
- #714 of 760 in MI
Livability — Flint
- Score
- 74/100
- State rank
- #196
- US rank
- #4946
Category grades
Schools grade is shown separately in the Schools card above.
Census & demographics
- Census place
- Flint, MI
- County
- Genesee County · 221,329 people
- City population
- 93,814
- Metro
- Flint, MI
- Population (ZIP)
- 22,347
- Household income
- $44,411
- Rent vs Own
- Severe rent burden
- 1293.0
Population outlook (Genesee County) Hauer SSP2
- Today (2025)
- 381,312 people
- By 2030
- 362,731 · -4.9%
- By 2040
- 321,550 · -15.7%
- By 2050
- 279,212 · -26.8%
- By 2075
- 193,336 · -49.3%
- By 2100
- 128,118 · -66.4%
Race, ethnicity, and origin ACS 2023
- Neighborhood character
- Diverse neighborhood (Simpson 0.56)
- Race & ethnicity
- Black 55% White 36% Two or more races 4% Hispanic / Latino 3%
- Common ancestry
- Romanian 2% Lithuanian 2% Slovak 1%
- Foreign-born
- 5% · China, Canada
- Languages at home
- 93% English-only · Arabic 4% Spanish 1% Chinese 1%
Political lean MEDSL · Genesee
- 2024 margin
- Toss-up / Even · D 51.4% · R 47.2% · Other 1.4%
- 2008→2024 swing
- -28.3pp toward R · 2008: 32.5pp · 2024: 4.2pp
- All cycles
- 2024: D+4.2 2020: D+9.3 2016: D+9.5 2012: D+28.2 2008: D+32.5
Not yet ingested
- Civics
- —
Market trends
- HPI YoY
- ▼ -49.84%
- Current HPI
- 130.1152
- Rent YoY
- ▲ 12.35%
- Metro
- Flint, MI
- State GDP YoY
- ▲ 1.37%
- F500 in state
- 28
Industry mix (Fortune 500 HQ in MI)
| Industry | F500 HQs | Revenue |
|---|---|---|
| Automotive Parts | 3 | $48B |
|
||
| Automotive | 2 | $372B |
|
||
| Chemicals | 1 | $45B |
|
||
| Automotive Retail | 1 | $29B |
|
||
| Healthcare / Medical Devices | 1 | $23B |
|
||
| Automotive Technology | 1 | $20B |
|
||
Price history
+0.0% since first listed8 events — show timeline
- 2026-05-07 Listed $125,000 REALCOMP
- 2026-05-07 Listed $125,000 MiRealSource-MiMLS
- 2024-09-11 Sold (Public Records) $100,000 Public Records
- 2024-08-28 Sold (MLS) $100,000 REALCOMP
- 2024-08-28 Sold (MLS) $100,000 MiRealSource-MiMLS
- 2024-05-02 Pending — MiRealSource-MiMLS
- 2024-02-28 Listed $125,000 REALCOMP
- 2024-02-28 Listed $125,000 MiRealSource-MiMLS
Property tax history
+12.0%/yrLatest (2025): $3,566 · +173.7% YoY. Source: county tax records.
Cash-flow waterfall
monthlySold comps — $/sqft
last 12 mo · ≤1 miLoading sold comps…