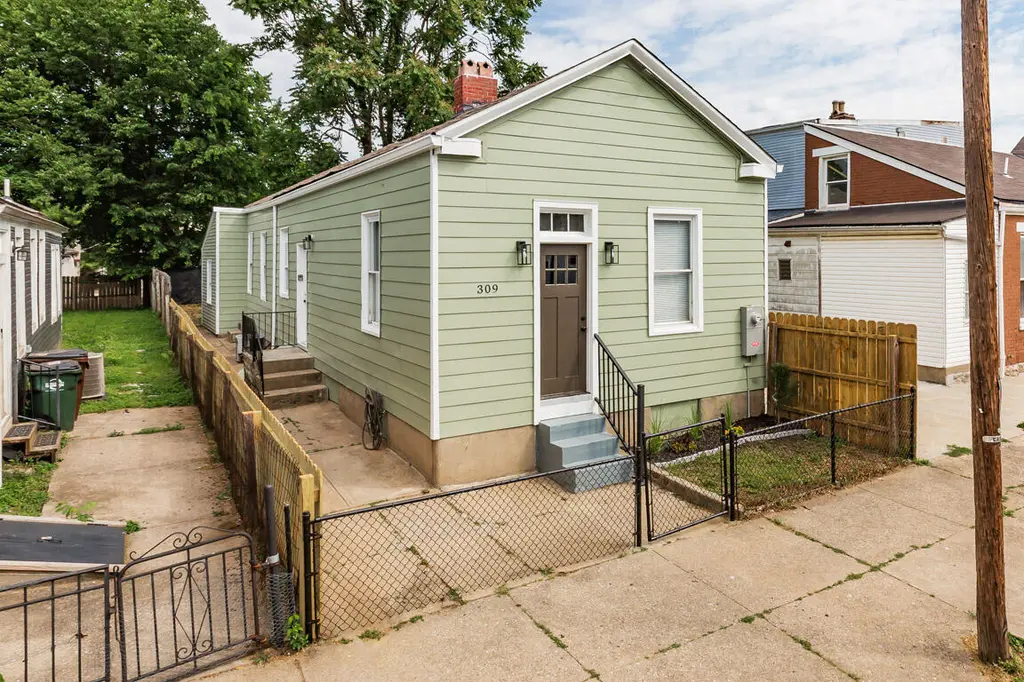
309 W 8th St · Newport, KY
Flood risk 7/10 · Major
- FEMA flood zone
- X
- Chance of flooding over 30 yrs
- 0.99%
- Est. flood insurance / yr
- $473 – $860
Fire risk 1/10 · Minimal
- Est. fire insurance / yr
- $839 – $1,559
Heat risk 5/10 · Moderate
- Hot days now (above 103°F)
- 7 days/yr
- Hot days in 30 yrs
- 20 days/yr
Wind risk 2/10 · Minimal
- Chance of severe wind over 30 yrs
- 1.0%
Air-quality risk 3/10 · Minor
- Unhealthy air days now
- 2 days/yr
- Unhealthy air days in 30 yrs
- 3 days/yr
Risk factors via First Street. Map © Google.
Why this score? — see what drove the C+ grade
The composite is a weighted blend of 9 inputs, each scored 0–100. Each bar is that input's sub-score; the figure is the points it added to the 100-point composite (weight × sub-score).
- Cash flow +26.6/30.0
- DSCR +9.1/10.0
- 1% rule +7.1/10.0
- ARV discount +6.9/15.0
- Livability +4.1/5.0
- Rent growth +3.7/5.0
- Condition / age +2.5/5.0
- Schools +1.7/10.0
- Appreciation +0.0/10.0
$184,900
🖨 Deal sheet (PDF) 📄 Offer letter ✓ Due diligence
Listing remarks MLS
As is w/all faults.Case#202-014127.For FHA fin, close for property will be dlyd by 45-60 dys from expir dt of contract for lbp inspect &/or stblztn.Buyer respon for cost/rplcmnt of mssng mtrs.Vltns to be addressed by buyer after close.
Key facts
- Fenced yard
- Modern finishes
- Updated spaces
Tags
Property features AI
Exterior
- Parking: On-street parking
- Utilities: Public water; Public sewer; Natural gas available
- Home design: Single family residence; One level; Existing structure
- Construction: Stone foundation
- Exterior features: Shingle roof; Vinyl siding
Interior
- Kitchen: Stainless steel appliances; Electric range; Refrigerator
- Bedrooms: Primary bedroom (13 x 12); Bedroom 2 (9 x 8); Office (8 x 8)
- Bathrooms: 1 full bathroom
- Heating & cooling: Central air; Forced air heating
- Interior features: Pantry; Eat-in kitchen; High ceilings; Partial basement
Neighborhood map
What this means for you Summary
Snapshot
- This is a 3-bed/1.0-bath single-family listed at $185k.
Deal economics
- At list price, monthly cash flow is $441 ($5k/yr) — positive.
- The deal already cash-flows at list — no discount required.
- Meets the 1% rule at list price ($2k rent vs $185k).
- Cap rate 9.5% vs local median 4.9% in Newport — top-decile yield for the area; either an underpriced asset or a hidden risk that comps aren't pricing in. Stress-test before assuming the spread holds.
Location & tenants
- Location reads 82/100 on livability (#58 in KY, #1,070 nationally) — a professional / high-income tenant draw. Strengths: amenities A+, commute A+, cost of living A+; Watch: crime F, employment D-.
- Newport Independent (suburban): math 14% / reading 26% proficiency, ranked #160 of 165 in KY (top 97%) — low school quality limits family demand, transient renter base, plan for 1-2y turnover; 79% free/reduced lunch — lower-income household profile, screen leases tightly.
- Zoned schools: Newport Intermediate School (math 12% / reading 22%, grade F, #607 of 676 statewide, top 91%, 387 students, 89% FRL); Newport High School (math 16% / reading 28%, grade F, #202 of 254 statewide, top 82%, 579 students, 84% FRL).
- Market conditions: Rents rising fast (+4.6%/yr); 239 active listings in the ZIP; 40 comparable units currently listed for rent nearby; rentals leasing fast (median 4d on market — plan ~1-2 weeks tenant-placement turnaround); 247 units permitted in Campbell County in 2024 (77 in 5+ unit buildings).
- This rent runs 45% of the median local income ($60k/yr) — at the standard rent-burdened threshold; future hikes will face affordability resistance.
Forward outlook
- Local home prices are declining (-3.0%/yr); year-one equity from $1k of loan paydown is wiped out by about $6k of value loss. Plan a longer hold.
- At projected returns (-3.0% appreciation + 4.6% rent growth), your $52k cash investment doubles in ~9 years — after that, you're playing with house money.
Negotiation context
- Only 2 days on market — expect competitive offers; lowballing is unlikely to land.
- 2 sale attempts since 18y ago with the ask held roughly flat each time — persistent listings suggest the price (not the market) is what's stuck; bring a comps-based counter.
- Current owner paid $11k; list at $185k implies a 1616% gain — meaningful room to come down on a strong offer.
Risks & watch-outs
- Watch-outs: flood insurance adds $56/mo; built in 1887 — expect roof / HVAC / electrical / plumbing capex.
- Climate carrying-cost: major flood risk; extreme-heat days projected 7→20/yr by 2055 (HVAC capex compounding) — expect insurance premiums to compound above CPI over the hold.
Questions for the listing agent
- Built in 1887 — when were the roof, HVAC, electrical panel, plumbing, and water heater last replaced?
- What's the actual annual flood-insurance premium (NFIP or private), and is the property in a SFHA with mandatory coverage?
- Is there a deadline driving the sale (1031 exchange, divorce, estate, relocation)? That informs how much negotiation room exists.
- Schools are D-rated, which usually means shorter tenancies and higher turnover. Who's the typical renter profile here, and what's been the actual vacancy rate?
- Crime grade is F in this area — have there been break-ins, vandalism, or insurance claims at this property in the last 3 years? What carrier currently insures it and at what premium?
- What's the average days-on-market for RENTAL listings here right now (not sales)? A rising rental-DOM trend means longer vacancies and softer asking-rent achievability than the comps imply.
- What's the recent tenant-quality profile in this submarket — average credit score on applications, eviction rate, late-payment / NSF rate, and stable-employment percentage? A property-management company in the area should have these aggregated.
- How much new for-sale + rental construction is in the pipeline within 1–3 miles? Heavy new supply typically softens prices + rents 12–24 months out; constrained supply supports both.
Investment metrics
- 1% rule
- 1.21% ✓
- Cap rate
- 9.52%
- Cash-on-cash
- 11.52%
- DSCR
- 1.51
- GRM
- 6.9
CMA / ARV
- ARV (on-the-fly)
- $182,434
- Comps found
- 12
Show comp detail 12 sales within ~0.75 mi
| Address | Dist | Beds/Ba | Sqft | Sold | Price | $/sf | Match |
|---|---|---|---|---|---|---|---|
| 308 Elm St | 0.03mi | 3/1.5 | 1,136 (+3%) | 5mo | $190,000 | $167 | 87 |
| 330 W 9th St W | 0.15mi | 3/1.0 | 1,234 (+12%) | 0mo | $132,500 | $107 | 72 |
| 511 W 10th St | 0.29mi | 3/1.0 | 1,194 (+9%) | 5mo | $142,590 | $119 | 68 |
| 423 Hodge St | 0.30mi | 3/2.5 | 1,164 (+6%) | 3mo | $199,500 | $171 | 68 |
| 1037 Putnam St | 0.40mi | 2/2.0 (-1) | 1,065 (-3%) | 2mo | $225,000 | $211 | 66 |
| 339 W 12th St | 0.43mi | 3/1.5 | 1,151 (+5%) | 8mo | $150,000 | $130 | 64 |
| 409 E 13th St | 0.65mi | 2/1.0 (-1) | 1,083 (-2%) | 1mo | $180,000 | $166 | 62 |
| 933 Roberts St | 0.55mi | 2/1.0 (-1) | 1,080 (-2%) | 8mo | $239,000 | $221 | 60 |
| 58 16th St | 0.72mi | 2/1.5 (-1) | 1,120 (+2%) | 7mo | $150,000 | $134 | 51 |
| 935 Boone St | 0.69mi | 2/1.0 (-1) | 1,215 (+11%) | 5mo | $133,000 | $109 | 42 |
| 55 Biehl St | 0.66mi | 2/1.0 (-1) | 962 (-12%) | 7mo | $282,500 | $294 | 38 |
| 1210 Garrard St | 0.66mi | 2/2.0 (-1) | 1,248 (+14%) | 6mo | $204,000 | $163 | 33 |
Match score weights: distance 35% · size 25% · config 20% · recency 20%. Top-matched comps best support the ARV.
Projected returns pro-forma
-3.0% appreciation · 4.64% rent growth · sell at horizon
- IRR
- 1.0%
- Equity multiple
- 1.04×
- Total profit
- $1,987
- Equity at exit
- $27,569
- IRR
- 12.3%
- Equity multiple
- 2.05×
- Total profit
- $54,192
- Equity at exit
- $15,987
Cash invested: $51,772 (down + closing). Projections, not guarantees.
Landlord ↔ Tenant lean methodology
- Overall (STATE)
- 83 Strongly Landlord-Friendly
- State Kentucky
- 83 Strongly Landlord-Friendly · R+16
- County
- — inherits STATE
- City
- — inherits STATE
ZIP-level market 41071
- Rents YoY
- 4.6%
- Active inventory
- 239
- Price-to-rent
- 6.9×
Monthly cashflow live
- Estimated rent
- $2,247 high interval (Pro) →
- Mortgage (P&I)
- −$970
- Tax est. 1.5%
- −$231 /mo · $2,774/yr
- Insurance
- −$77
- Flood insurance flood zone
- −$56 /mo · $666/yr
- HOA
- −$0
- Vacancy / Maint / Mgmt
- −$472
- Net cashflow
- $441
Break-even live
Sensitivity live
| Price | -10% $569 | -5% $505 | +0% $441 | +5% $378 | +10% $314 |
|---|---|---|---|---|---|
| Rent | -10% $264 | -5% $353 | +0% $441 | +5% $530 | +10% $619 |
| Rate | -1.0pp $535 | -0.5pp $488 | base $441 | +0.5pp $393 | +1.0pp $345 |
UW: 25.0% down · 7.5% · 30yr · 1.5% tax · 5.0% vac · 8.0% maint · 8.0% mgmt
Financing live
Cash to close
- Down payment
- $46,225
- Closing costs
- $5,547
- Reserves months
- —
- Total cash needed
- —
Loan-product check · same deal, 3 products live
Conventional
25% down · 7.5% · 30yr
- Down + closing
- —
- Monthly P&I
- —
- Monthly cashflow
- —
- DSCR
- —
- Eligible?
- —
Personal DTI + credit; lowest rate.
DSCR
20% down · 8.5% · 30yr
- Down + closing
- —
- Monthly P&I
- —
- Monthly cashflow
- —
- DSCR
- —
- Eligible?
- —
No personal income docs; deal must DSCR.
Hard money
10% down · 12.0% · 12mo
- Down + closing
- —
- Monthly P&I
- —
- Monthly cashflow
- —
- DSCR
- —
- Eligible?
- —
Short-term bridge; refi at stabilization.
Rent comps 40 comps
| Address | Beds | Baths | Sqft | Rent | $/sqft | DOM | Units | Dist |
|---|---|---|---|---|---|---|---|---|
| 203 W 8th St Newport, KY | 2.0 | 1.5 | 1456 | $2,300 | $1.58 | 23d | 1 | 0.11mi |
| 210 W 5th St Newport, KY | 1.0–2.0 | 1.0–2.0 | 845 | $1,800 | $2.13 | 4d | 15 | 0.19mi |
| 128 W 9th St Newport, KY | 2.0 | 1.0 | 1012 | $1,650 | $1.63 | 3d | 1 | 0.23mi |
| 911 Putnam St #2 Newport, KY | 2.0 | 1.0 | 1000 | $1,600 | $1.60 | 23d | 1 | 0.32mi |
| 508 Greenup St Unit 508-02 Covington, KY | 2.0 | 1.0 | 1220 | $1,800 | $1.48 | 3d | 1 | 0.49mi |
| 814 Washington Ave Unit 2 Newport, KY | 2.0 | 2.0 | 1450 | $1,500 | $1.03 | 25d | 1 | 0.55mi |
| 103 E 3rd St Covington, KY | 2.0 | 2.5 | 1291 | $3,250 | $2.52 | 3d | 1 | 0.62mi |
| 100 Aqua Way Newport, KY | 1.0–3.0 | 1.0–2.0 | 1092 | $3,850 | $3.53 | 3d | 4 | 0.64mi |
| 1044 Washington Ave #2 Newport, KY | 2.0 | 2.0 | 1250 | $1,800 | $1.44 | 45d | 1 | 0.66mi |
| 344 E 13th St Unit 1 Covington, KY | 2.0 | 1.0 | 1000 | $1,275 | $1.27 | 25d | 1 | 0.67mi |
| 929 Boone St Newport, KY | 2.0 | 2.0 | 1458 | $1,495 | $1.03 | 45d | 1 | 0.69mi |
| 1025 Scott St Unit 2 Covington, KY | 2.0 | 2.0 | 1100 | $1,800 | $1.64 | 4d | 1 | 0.71mi |
| 50 W Rivercenter Blvd Covington, KY | 1.0–2.0 | 1.0–2.5 | 1273 | $3,640 | $2.86 | 3d | 9 | 0.80mi |
| 621 E Mehring Way Cincinnati, OH | 1.0–2.0 | 1.0–2.0 | 938 | $2,249 | $2.40 | 3d | 12 | 0.89mi |
| 601 E Pete Rose Way Cincinnati, OH | 3.0 | 1.0–2.5 | 1039 | $2,936 | $2.83 | 3d | 22 | 0.93mi |
| 121 E Freedom Way Cincinnati, OH | 2.0 | 1.0–2.0 | 988 | $2,999 | $3.03 | 3d | 27 | 0.94mi |
| 309 Sycamore St #201 Cincinnati, OH | 2.0 | 2.0 | 850 | $1,600 | $1.88 | 25d | 1 | 1.02mi |
| 44 W Freedom Way Cincinnati, OH | 2.0 | 1.0–2.0 | 943 | $2,859 | $3.03 | 3d | 28 | 1.06mi |
| 515 Main St Covington, KY | 1.0–2.0 | 1.0–2.0 | 934 | $2,215 | $2.37 | 3d | 8 | 1.09mi |
| 309 Vine St Cincinnati, OH | 1.0–3.0 | 1.0–2.0 | 955 | $3,334 | $3.49 | 3d | 15 | 1.16mi |
| 1 W 4th St Cincinnati, OH | 3.0 | 1.0–3.5 | 1675 | $9,200 | $5.49 | 4d | 96 | 1.19mi |
| 1914 Eastern Ave Apt 1 Covington, KY | 2.0 | 1.0 | 750 | $1,200 | $1.60 | 25d | 1 | 1.26mi |
| 151 W 4th St Cincinnati, OH | 2.0 | 1.0 | 726 | $2,399 | $3.30 | 3d | 102 | 1.27mi |
| 580 Walnut St Cincinnati, OH | 2.0 | 1.0–2.5 | 1101 | $4,822 | $4.38 | 3d | 19 | 1.28mi |
| 205 W 4th St Cincinnati, OH | 2.0 | 1.0–2.0 | 648 | $2,162 | $3.33 | 3d | 44 | 1.29mi |
| 345 E 7th St Cincinnati, OH | 2.0 | 1.0–2.0 | 1184 | $4,300 | $3.63 | 5d | 18 | 1.30mi |
| 634 Sycamore St Cincinnati, OH | 2.0 | 1.0–1.5 | 1261 | $2,615 | $2.07 | 6d | 9 | 1.31mi |
| 427 Oregon St Cincinnati, OH | 1.0–2.0 | 1.0 | 980 | $2,800 | $2.86 | 3d | 4 | 1.35mi |
| 239 Grandview Ave Bellevue, KY | 2.0 | 2.0 | 1093 | $1,645 | $1.50 | 6d | 2 | 1.35mi |
| 353 W 4th St Cincinnati, OH | 2.0 | 2.0 | 1140 | $3,400 | $2.98 | 25d | 1 | 1.38mi |
| 630 Vine St Cincinnati, OH | 2.0 | 1.0–2.0 | 741 | $2,239 | $3.02 | 5d | 18 | 1.40mi |
| 224 E 8th St Cincinnati, OH | 1.0–2.0 | 1.0–2.0 | 1200 | $2,462 | $2.05 | 3d | 5 | 1.40mi |
| 721 Main St Cincinnati, OH | 2.0 | 1.0–2.0 | 991 | $3,205 | $3.23 | 3d | 15 | 1.40mi |
| 7 W 7th St Cincinnati, OH | 1.0–2.0 | 1.0–2.0 | 976 | $3,420 | $3.50 | 4d | 65 | 1.42mi |
| 1055 St Paul Pl Cincinnati, OH | 3.0 | 1.0–2.0 | 975 | $2,995 | $3.07 | 3d | 10 | 1.43mi |
| 2335 Alexandria Pike Southgate, KY | 2.0 | 1.0 | 557 | $1,140 | $2.04 | 3d | 17 | 1.45mi |
| 830 Main St Cincinnati, OH | 2.0 | 1.0–2.0 | 756 | $1,895 | $2.50 | 6d | 6 | 1.46mi |
| 512 Wallace Ave Unit 512/18 Covington, KY | 2.0 | 2.0 | 900 | $1,299 | $1.44 | 9d | 1 | 1.47mi |
| 151 Seventh St W Cincinnati, OH | 2.0 | 1.0–2.0 | 1191 | $2,129 | $1.79 | 3d | 4 | 1.48mi |
| 19 Garfield Pl Cincinnati, OH | 1.0–2.0 | 1.0–2.0 | 1680 | $2,260 | $1.34 | 3d | 11 | 1.48mi |
Listing history 3 events
-
2026-06-08status $184,900 Pending 2 DOM
-
2026-06-07remarks 313-char remark
-
2026-06-07$184,900 Active 2 DOM
ⓘ Source: listings_history table (triggers on properties + properties_extension) + one-shot
backfill from property_details.listing_events for pre-trigger history.
Climate risk First Street
- Flood 7/10 Severe FEMA zone X · 99% chance over 30 yrs
- Wildfire 1/10 Low
- Heat 5/10 Major 7 d/yr ≥103°F today · 20 d/yr by 30 yrs out
- Wind 2/10 Low 100% chance of damaging wind over 30 yrs
- Air quality 3/10 Moderate 2 unhealthy d/yr today · 3 by 30 yrs out
Nearby sold comps map
Loading sold comps map…
Walkable amenities ~0.75 mi
Loading nearby amenities…
Taxation est. · year 1
- Rental income
- $26,958
- − Mortgage interest
- −$10,357
- − Property taxes
- −$2,774
- − Insurance
- −$1,591
- − Repairs & maintenance
- −$2,157
- − Management
- −$2,157
- − Depreciation
- −$5,379
- Taxable income
- $2,544
- Est. tax owed @ 24.0%
- −$611
- After-tax cash flow
- $4,686/yr
For passive investors: Depreciation is non-cash, so a rental often shows a tax loss while cash-flowing — sheltering income. Rental losses are passive: they offset passive income freely, and up to $25,000/yr can offset ordinary (W-2) income if you actively participate and your MAGI is under $100k (phasing out to $0 by $150k); unused losses carry forward. On sale, claimed depreciation is recaptured at up to 25%, and gains may owe capital-gains tax (a 1031 exchange can defer both). Figures are a year-1 estimate at your 24.0% rate — not tax advice; consult a CPA.
Schools (NCES district)
- District
- Newport Independent
- NCES district ID
- 2104440
- Math proficiency
- 14% ▼ -11.00%
- Reading proficiency
- 26% ▼ -6.00%
- Median HH income
- $35,783
- Composite
- 16.51/100
- National rank
- #9182
- State rank
- #160 of 165 in KY
Livability — Newport
- Score
- 82/100
- State rank
- #58
- US rank
- #1070
Category grades
Schools grade is shown separately in the Schools card above.
Census & demographics
- Census place
- Newport, KY
- County
- Campbell County · 84,793 people
- Metro
- Cincinnati, OH-KY-IN
- Population (ZIP)
- 19,680
- Household income
- $59,976
- Rent vs Own
- Severe rent burden
- 1136.0
Population outlook (Campbell County) Hauer SSP2
- Today (2025)
- 95,668 people
- By 2030
- 96,886 · +1.3%
- By 2040
- 97,734 · +2.2%
- By 2050
- 96,413 · +0.8%
- By 2075
- 90,211 · -5.7%
- By 2100
- 79,434 · -17.0%
Race, ethnicity, and origin ACS 2023
- Neighborhood character
- Predominantly White (84%)
- Race & ethnicity
- White 84% Black 7% Two or more races 6% Hispanic / Latino 5%
- Common ancestry
- Slovak 3% Lithuanian 2% Italian 2%
- Foreign-born
- 4% · Canada
- Languages at home
- 95% English-only · Spanish 3% Other Indo-European 1%
Political lean MEDSL · Campbell
- 2024 margin
- R (+19.7) · D 39.2% · R 58.9% · Other 1.9%
- 2008→2024 swing
- +1.2pp toward D · 2008: -20.9pp · 2024: -19.7pp
- All cycles
- 2024: R+19.7 2020: R+18.6 2016: R+24.5 2012: R+22.8 2008: R+20.9
Not yet ingested
- Civics
- —
Market trends
- HPI YoY
- ▼ -193.38%
- Current HPI
- 244.9069
- Rent YoY
- ▲ 4.64%
- Metro
- Cincinnati, OH-KY-IN
- State GDP YoY
- ▲ 1.81%
- F500 in state
- 4
Industry mix (Fortune 500 HQ in KY)
| Industry | F500 HQs | Revenue |
|---|---|---|
| Healthcare | 1 | $118B |
|
||
| Food / Beverage | 1 | $7B |
|
||
Price history
+721.8% since first listed5 events — show timeline
- 2026-06-05 Price Changed $184,900 NKMLS
- 2026-06-05 Listed $184,000 NKMLS
- 2009-03-24 Sold (MLS) $10,775 NKMLS
- 2008-12-26 Listed $13,600 NKMLS
- 1988-02-29 Sold (Public Records) $22,500 Public Records
Property tax history
+8.0%/yrLatest (2025): $339 · -3.3% YoY. Source: county tax records.
Cash-flow waterfall
monthlySold comps — $/sqft
last 12 mo · ≤1 miLoading sold comps…