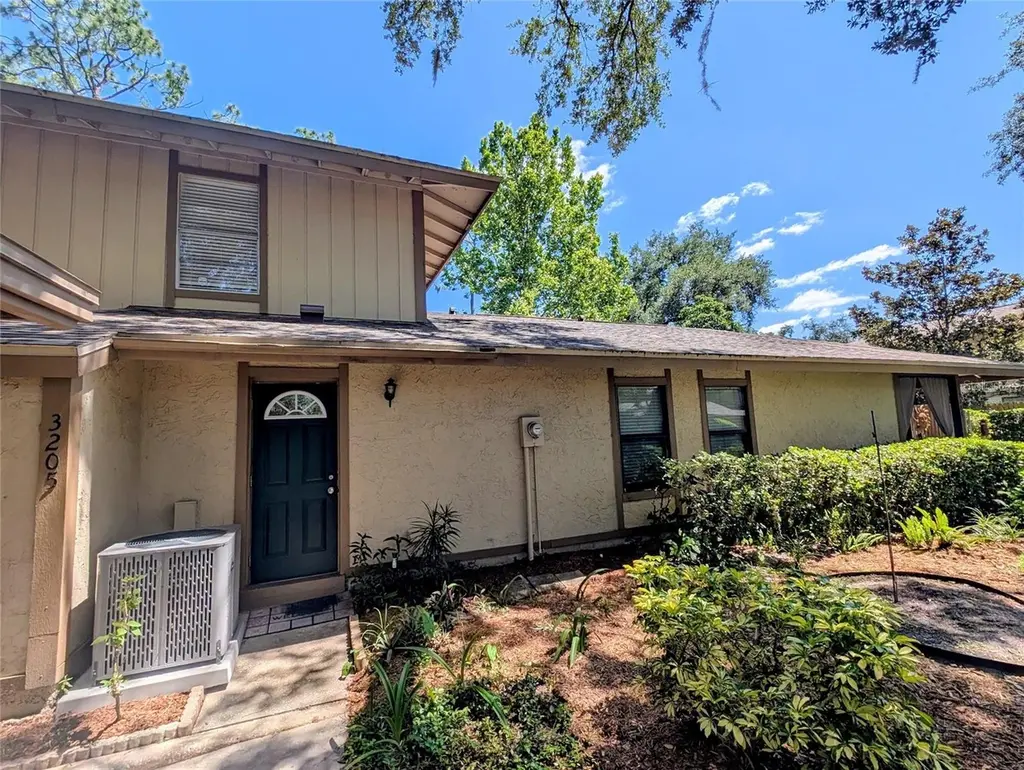
3205 Deer Ct · Brandon, FL
Flood risk 1/10 · Minimal
- FEMA flood zone
- X (unshaded)
- Chance of flooding over 30 yrs
- 0.0%
- Est. flood insurance / yr
- $507 – $1,088
Fire risk 1/10 · Minimal
- Est. fire insurance / yr
- $947 – $1,759
Heat risk 10/10 · Severe
- Hot days now (above 109°F)
- 7 days/yr
- Hot days in 30 yrs
- 25 days/yr
Wind risk 9/10 · Severe
- Chance of severe wind over 30 yrs
- 99.0%
Air-quality risk 4/10 · Minor
- Unhealthy air days now
- 4 days/yr
- Unhealthy air days in 30 yrs
- 5 days/yr
Risk factors via First Street. Map © Google.
Why this score? — see what drove the D grade
The composite is a weighted blend of 9 inputs, each scored 0–100. Each bar is that input's sub-score; the figure is the points it added to the 100-point composite (weight × sub-score).
- Cash flow +12.3/30.0
- ARV discount +7.5/15.0
- Schools +4.2/10.0
- Livability +4.2/5.0
- 1% rule +3.9/10.0
- DSCR +3.7/10.0
- Condition / age +2.5/5.0
- Rent growth +2.2/5.0
- Appreciation +0.0/10.0
$242,000
🖨 Deal sheet 📄 Offer letter ✓ Due diligence
Listing remarks MLS
Location! Location! Location! Great opportunity to own in Buckhorn Creek Town Homes. This townhome has 3 bedrooms and 1.5 baths with 1256 sq. ft. of living space. Galley style kitchen also has the washer/dryer hook ups for easy access. Plenty of cabinet & counter space with a closet pantry. There is a breakfast bar and a large dining room. Laminate flooring through out the dining/living room combo. Sliding glass doors open to 2 fenced patios; one with a storage closest. There is a big storage closet downstairs with additional storage under the staircase if needed. 3 spacious bedrooms upstairs and the master features a closet with additional shelving. Large bathroom upstairs and a half bath downstairs. The back patio has a drop down fence for you to enjoy the creek running behind the building. There are 2 assigned parking spaces -one covered. The resort style community pool with gated access has a large area for parties and cookouts. This townhome is move in ready, but you will want to put your personal style in it. Walk to Big Lots, Dining and Post Office - close to Bloomindale and main streets. Townhome will be sold "as is" and owner will not make any repairs. This townhome is priced to sell - do not wait.
Key facts
- Community pool
- Tennis courts
- Ample cabinet space
Tags
Property features AI
Finance
- Financial info: Total monthly HOA fees shown as $268 (total annual fees $3,216); Lease/restrictions apply
- HOA & community: Buckhorn HOA with required monthly fee of $268; HOA fee covers cable TV, community pool, structure maintenance, and grounds maintenance; Association approval required; Community clubhouse, pool, and sidewalks; Deed-restricted community; Pets allowed
Exterior
- Parking: Carport with 2 spaces
- Utilities: Public water; Private sewer; Electricity connected; Cable connected; High-speed internet available
- Home design: Townhouse (residential); Two levels; East-facing entry
- Construction: Block construction; Shingle roof; Slab foundation; Built as part of building number 3205
- Exterior features: Front and rear porches; Sidewalk; Storage
Interior
- Kitchen: Dishwasher; Disposal; Microwave; Range; Refrigerator; Electric water heater
- Bedrooms: 3 bedrooms
- Flooring: Hardwood
- Bathrooms: 1 full bathroom; 1 half bathroom
- Heating & cooling: Central heating; Central air
- Interior features: Ceiling fans; Open floor plan; Tray and vaulted ceilings; Window treatments; Exhaust fan
- Laundry & utility: Inside laundry with washer and dryer
Neighborhood map
What this means for you Summary
Snapshot
- This is a 3-bed/2.0-bath townhouse listed at $242k.
Deal economics
- At list price, monthly cash flow is $-43 ($-519/yr) — negative.
- To cash-flow at today's rent, offer at most $234k (3.2% below list).
- To meet the 1% rule (rent ≥ 1% of price), the offer needs to be $216k (10.8% below list).
- Recommended offer: $216k (10.8% below list) — sets the bar for 1% rule.
Location & tenants
- Location reads 85/100 on livability (#26 in FL, #507 nationally) — a professional / high-income tenant draw. Strengths: amenities A+, housing A+, health & safety A+.
- Hillsborough (suburban): math 47% / reading 50% proficiency, ranked #41 of 73 in FL (top 56%) — families likely to look elsewhere, expect single-tenant / working-renter base with shorter leases.
- Zoned schools: Riverview High School (math 37% / reading 50%, grade F, #248 of 667 statewide, top 38%, 2,599 students, 46% FRL).
- Market conditions: Rents soft (-1.2%/yr); 313 active listings in the ZIP; 29 comparable units currently listed for rent nearby; rentals at typical pace (median 18d on market — plan ~3-4 weeks tenant-placement turnaround); solid renter incomes; 9,053 units permitted in Hillsborough County in 2024 (4,555 in 5+ unit buildings).
- This rent runs 32% of the median local income ($81k/yr) — at the standard rent-burdened threshold; future hikes will face affordability resistance.
Forward outlook
- Local home prices are declining (-3.0%/yr); year-one equity from $2k of loan paydown is wiped out by about $7k of value loss. Plan a longer hold.
- Hillsborough County population projected at +37% by 2050 — long-run rental-demand tailwind backs the buy-and-hold thesis.
Negotiation context
- Only 12 days on market — expect competitive offers; lowballing is unlikely to land.
- 6 sale attempts since 22y ago with the ask held roughly flat each time — persistent listings suggest the price (not the market) is what's stuck; bring a comps-based counter.
- Current owner paid $171k; 42% above their basis — modest negotiation headroom, anchor on the comps not their cost.
Risks & watch-outs
- Climate carrying-cost: severe wind risk, 99% chance of damaging wind over 30y; extreme-heat days projected 7→25/yr by 2055 (HVAC capex compounding) — expect insurance premiums to compound above CPI over the hold.
Questions for the listing agent
- What do current leases actually rent for vs. the listed asking? Can we see a recent rent roll and the last 12 months of T-12 income?
- Built in 1975 — when were the roof, HVAC, electrical panel, plumbing, and water heater last replaced?
- What does the HOA fee cover, when was the last increase, and are there any pending special assessments or reserve-fund shortfalls?
- Is there a deadline driving the sale (1031 exchange, divorce, estate, relocation)? That informs how much negotiation room exists.
- The area grade is low — what's the realistic commute time and amenity access for the typical tenant pool here? Any planned neighborhood developments (good or bad) we should know about?
- What's the average days-on-market for RENTAL listings here right now (not sales)? A rising rental-DOM trend means longer vacancies and softer asking-rent achievability than the comps imply.
- What's the recent tenant-quality profile in this submarket — average credit score on applications, eviction rate, late-payment / NSF rate, and stable-employment percentage? A property-management company in the area should have these aggregated.
- How much new for-sale + rental construction is in the pipeline within 1–3 miles? Heavy new supply typically softens prices + rents 12–24 months out; constrained supply supports both.
Investment metrics
- 1% rule
- 0.89% ✗
- Cap rate
- 6.08%
- Cash-on-cash
- -0.77%
- DSCR
- 0.97
- GRM
- 9.3
CMA / ARV
No comps found within radius.
Projected returns pro-forma
-3.0% appreciation · 0.0% rent growth · sell at horizon
- IRR
- -21.1%
- Equity multiple
- 0.29×
- Total profit
- $-48,218
- Equity at exit
- $36,083
- IRR
- -24.2%
- Equity multiple
- -0.03×
- Total profit
- $-69,667
- Equity at exit
- $20,924
Cash invested: $67,760 (down + closing). Projections, not guarantees.
Landlord ↔ Tenant lean methodology
- Overall (STATE)
- 87 Strongly Landlord-Friendly
- State Florida
- 87 Strongly Landlord-Friendly · R+3
- County
- — inherits STATE
- City
- — inherits STATE
ZIP-level market 33511
- Rents YoY
- -1.2%
- Active inventory
- 313
- Price-to-rent
- 9.3×
Monthly cashflow live
- Estimated rent
- $2,159 high interval (Pro) →
- Mortgage (P&I)
- −$1,269
- Tax from tax record
- −$111 /mo · $1,335/yr
- Insurance
- −$101
- HOA
- −$268
- Vacancy / Maint / Mgmt
- −$453
- Net cashflow
- $-43
Break-even live
UW: 25.0% down · 7.5% · 30yr · 1.5% tax · 5.0% vac · 8.0% maint · 8.0% mgmt
Financing live
Cash to close
- Down payment
- $60,500
- Closing costs
- $7,260
- Reserves months
- —
- Total cash needed
- —
Loan-product check · same deal, 3 products live
Conventional
25% down · 7.5% · 30yr
- Down + closing
- —
- Monthly P&I
- —
- Monthly cashflow
- —
- DSCR
- —
- Eligible?
- —
Personal DTI + credit; lowest rate.
DSCR
20% down · 8.5% · 30yr
- Down + closing
- —
- Monthly P&I
- —
- Monthly cashflow
- —
- DSCR
- —
- Eligible?
- —
No personal income docs; deal must DSCR.
Hard money
10% down · 12.0% · 12mo
- Down + closing
- —
- Monthly P&I
- —
- Monthly cashflow
- —
- DSCR
- —
- Eligible?
- —
Short-term bridge; refi at stabilization.
Rent comps 29 comps
| Address | Beds | Baths | Sqft | Rent | $/sqft | DOM | Units | Dist |
|---|---|---|---|---|---|---|---|---|
| 856 Creekway Ct Brandon, FL | 3.0 | 2.0 | 1556 | $2,045 | $1.31 | 22d | 1 | 0.12mi |
| 1002 Creekbridge Rd Brandon, FL | 2.0–3.0 | 2.0 | 1062 | $1,736 | $1.63 | 1d | 6 | 0.17mi |
| 1024 Hallwood Loop Brandon, FL | 3.0 | 2.0 | 1466 | $2,295 | $1.57 | 24d | 1 | 0.37mi |
| 1407 Trail Boss Ln Brandon, FL | 4.0 | 2.0 | 1857 | $2,395 | $1.29 | 18d | 1 | 0.38mi |
| 609 Princeton St Brandon, FL | 4.0 | 2.0 | 1681 | $2,150 | $1.28 | 24d | 1 | 0.38mi |
| 826 Milano Cir Brandon, FL | 1.0–3.0 | 1.0–2.0 | 1034 | $2,029 | $1.96 | 1d | 17 | 0.51mi |
| 816 Centerwood Ct Brandon, FL | 3.0 | 2.0 | 1391 | $2,009 | $1.44 | 24d | 1 | 0.53mi |
| 808 Pebblewood Dr Brandon, FL | 3.0 | 2.0 | 1145 | $2,075 | $1.81 | 12d | 1 | 0.58mi |
| 3812 Pinedale St Brandon, FL | 4.0 | 2.0 | 1586 | $2,295 | $1.45 | 18d | 1 | 0.69mi |
| 3124 Bloomingdale Villas Ct Brandon, FL | 3.0 | 2.0 | 1200 | $1,800 | $1.50 | 24d | 1 | 0.75mi |
| 3818 Southview Dr Brandon, FL | 3.0 | 2.0 | 1373 | $2,245 | $1.64 | 24d | 1 | 0.78mi |
| 602 Pine Forest Dr Brandon, FL | 3.0 | 2.0 | 1450 | $2,595 | $1.79 | 24d | 1 | 0.81mi |
| 1407 Wakefield Dr Brandon, FL | 3.0 | 2.0 | 1728 | $2,200 | $1.27 | 22d | 1 | 0.82mi |
| 622 Breezeway Ct Brandon, FL | 4.0 | 2.5 | 1854 | $2,300 | $1.24 | 3d | 1 | 0.94mi |
| 5790 Stockport St Riverview, FL | 1.0–2.0 | 1.0–2.0 | 936 | $2,180 | $2.33 | 3d | 37 | 1.00mi |
| 5403 Lindburg St Riverview, FL | 4.0 | 2.0 | 1830 | $2,300 | $1.26 | 24d | 1 | 1.02mi |
| 11112 Swansea St Riverview, FL | 2.0 | 2.0 | 1731 | $2,500 | $1.44 | 17d | 1 | 1.13mi |
| 1904 Firethorn Ct Brandon, FL | 3.0 | 2.0 | 1773 | $2,095 | $1.18 | 22d | 1 | 1.19mi |
| 1904 Firethorn Ct Brandon, FL | 3.0 | 2.0 | 1773 | $2,095 | $1.18 | 16d | 1 | 1.19mi |
| 3039 Annadale Cir Brandon, FL | 4.0 | 2.0 | 1549 | $2,320 | $1.50 | 3d | 1 | 1.22mi |
| 557 Rapid Falls Dr Brandon, FL | 3.0 | 2.0 | 1348 | $2,300 | $1.71 | 18d | 1 | 1.25mi |
| 2023 Green Juniper Ln Brandon, FL | 3.0 | 2.0 | 1306 | $2,125 | $1.63 | 18d | 1 | 1.25mi |
| 2810 Manor Hill Dr Brandon, FL | 4.0 | 2.0 | 1649 | $2,279 | $1.38 | 1d | 1 | 1.29mi |
| 2442 Knight Island Dr Brandon, FL | 4.0 | 2.0 | 1846 | $2,500 | $1.35 | 24d | 1 | 1.30mi |
| 2704 Manor Hill Dr Brandon, FL | 3.0 | 2.0 | 1130 | $2,139 | $1.89 | 3d | 1 | 1.37mi |
| 2709 Manor Hill Dr Brandon, FL | 3.0 | 2.0 | 1358 | $2,350 | $1.73 | 20d | 1 | 1.37mi |
| 1413 Tiverton Dr Brandon, FL | 3.0 | 2.0 | 1303 | $2,200 | $1.69 | 18d | 1 | 1.37mi |
| 1540 Chepacket St Brandon, FL | 3.0 | 2.0 | 1417 | $2,220 | $1.57 | 24d | 1 | 1.43mi |
| 1440 Tiverton Dr Brandon, FL | 3.0 | 2.0 | 1246 | $1,995 | $1.60 | 20d | 1 | 1.46mi |
HOA detail
- Monthly dues
- $268 · $3,216/yr
- Likely covers
- poolsecurityparking
Listing history 10 events
-
2026-06-18days on market $242,000 Active 12 DOM
-
2026-06-17days on market $242,000 Active 11 DOM
-
2026-06-16days on market $242,000 Active 10 DOM
-
2026-06-15days on market $242,000 Active 9 DOM
-
2026-06-13days on market $242,000 Active 7 DOM
-
2026-06-13days on market $242,000 Active 6 DOM
-
2026-06-09days on market $242,000 Active 3 DOM
-
2026-06-08days on market $242,000 Active 2 DOM
-
2026-06-07remarks 683-char remark
-
2026-06-07$242,000 Active 1 DOM
ⓘ Source: listings_history table (triggers on properties + properties_extension) + one-shot
backfill from property_details.listing_events for pre-trigger history.
Tax reassessment forecast FL · Resets to sale price
- Current annual tax
- $1,335 · $111/mo
- Projected year-2 tax
- $2,009 · $167/mo
- Expected delta
- +$674/yr (+$56/mo · 50.5%)
ⓘ Screening estimate from a state-policy table — verify with the county assessor before closing.
Climate risk First Street
- Flood 1/10 Low FEMA zone X (unshaded) · 0% chance over 30 yrs
- Wildfire 1/10 Low
- Heat 10/10 Extreme 7 d/yr ≥109°F today · 25 d/yr by 30 yrs out
- Wind 9/10 Extreme 99% chance of damaging wind over 30 yrs
- Air quality 4/10 Moderate 4 unhealthy d/yr today · 5 by 30 yrs out
Nearby sold comps map
Loading sold comps map…
Walkable amenities ~0.75 mi
Loading nearby amenities…
Taxation est. · year 1
- Rental income
- $25,912
- − Mortgage interest
- −$13,556
- − Property taxes
- −$1,335
- − Insurance
- −$1,210
- − Repairs & maintenance
- −$2,073
- − Management
- −$2,073
- − HOA
- −$3,216
- − Depreciation
- −$7,040
- Taxable loss
- −$4,590
- Est. tax savings @ 24.0%
- +$1,102
- After-tax cash flow
- $583/yr
For passive investors: Depreciation is non-cash, so a rental often shows a tax loss while cash-flowing — sheltering income. Rental losses are passive: they offset passive income freely, and up to $25,000/yr can offset ordinary (W-2) income if you actively participate and your MAGI is under $100k (phasing out to $0 by $150k); unused losses carry forward. On sale, claimed depreciation is recaptured at up to 25%, and gains may owe capital-gains tax (a 1031 exchange can defer both). Figures are a year-1 estimate at your 24.0% rate — not tax advice; consult a CPA.
Schools (NCES district)
- District
- Hillsborough
- NCES district ID
- 1200870
- Math proficiency
- 47% ▼ -8.00%
- Reading proficiency
- 50% ▼ -4.00%
- Median HH income
- $50,622
- Composite
- 41.6/100
- National rank
- #3435
- State rank
- #41 of 73 in FL
Livability — Brandon
- Score
- 85/100
- State rank
- #26
- US rank
- #507
Category grades
Schools grade is shown separately in the Schools card above.
Census & demographics
- Census place
- Brandon, FL
- County
- Hillsborough County · 1,540,968 people
- City population
- 92,716
- Metro
- Tampa-St. Petersburg-Clearwater, FL
- Population (ZIP)
- 62,138
- Household income
- $81,301
- Rent vs Own
- Severe rent burden
- 3073.0
Population outlook (Hillsborough County) Hauer SSP2
- Today (2025)
- 1,607,022 people
- By 2030
- 1,733,968 · +7.9%
- By 2040
- 1,979,565 · +23.2%
- By 2050
- 2,203,427 · +37.1%
- By 2075
- 2,667,893 · +66.0%
- By 2100
- 2,891,558 · +79.9%
Race, ethnicity, and origin ACS 2023
- Neighborhood character
- Diverse neighborhood (Simpson 0.68)
- Race & ethnicity
- White 45% Hispanic / Latino 30% Two or more races 18% Black 15% Asian 4%
- Hispanic origin (detail)
- Mexican 3% Puerto Rican 10% Cuban 6% Dominican 2%
- Common ancestry
- Romanian 2% Lithuanian 2% Slovak 2%
- Foreign-born
- 18% · Canada, Jamaica
- Languages at home
- 72% English-only · Spanish 22% Other Indo-European 2% Other Asian/Pacific 1%
Political lean MEDSL · Hillsborough
- 2024 margin
- Toss-up / Even · D 47.8% · R 50.9% · Other 1.3%
- 2008→2024 swing
- -10.2pp toward R · 2008: 7.1pp · 2024: -3.1pp
- All cycles
- 2024: R+3.1 2020: D+6.9 2016: D+6.8 2012: D+6.7 2008: D+7.1
Not yet ingested
- Civics
- —
Market trends
- HPI YoY
- ▼ -279.49%
- Current HPI
- 333.4744
- Rent YoY
- ▼ -1.17%
- Metro
- Tampa-St. Petersburg-Clearwater, FL
- State GDP YoY
- ▲ 3.28%
- F500 in state
- 36
Industry mix (Fortune 500 HQ in FL)
| Industry | F500 HQs | Revenue |
|---|---|---|
| Industrial Technology | 2 | $29B |
|
||
| Insurance | 2 | $17B |
|
||
| Retail | 1 | $60B |
|
||
| Technology Distribution | 1 | $58B |
|
||
| Homebuilding | 1 | $35B |
|
||
| Technology Manufacturing | 1 | $35B |
|
||
Price history
+696.1% since first listed18 events — show timeline
- 2026-06-06 Listed $242,000 Stellar MLS as Distributed by MLS Grid
- 2025-10-08 Sold (Public Records) $171,000 Public Records
- 2017-12-22 Sold (Public Records) $115,000 Public Records
- 2017-12-20 Sold (MLS) $115,000 Stellar MLS as Distributed by MLS Grid
- 2017-11-15 Pending — Stellar MLS as Distributed by MLS Grid
- 2017-10-26 Listed $118,000 Stellar MLS as Distributed by MLS Grid
- 2015-05-06 Sold (Public Records) $76,800 Public Records
- 2015-05-01 Sold (MLS) $76,750 Stellar MLS as Distributed by MLS Grid
- 2015-03-10 Pending — Stellar MLS as Distributed by MLS Grid
- 2015-03-04 Listed $77,900 Stellar MLS as Distributed by MLS Grid
- 2014-06-10 Listing Removed — Stellar MLS as Distributed by MLS Grid
- 2013-10-08 Listed $69,500 Stellar MLS as Distributed by MLS Grid
- 2009-08-24 Listing Removed — Stellar MLS as Distributed by MLS Grid
- 2009-06-23 Listed $125,500 Stellar MLS as Distributed by MLS Grid
- 2004-09-15 Listing Removed — Stellar MLS as Distributed by MLS Grid
- 2004-09-09 Listed $102,000 Stellar MLS as Distributed by MLS Grid
- 1988-09-01 Sold (Public Records) $43,100 Public Records
- 1977-08-01 Sold (Public Records) $30,400 Public Records
Property tax history
+9.1%/yrLatest (2025): $1,335 · +9.7% YoY. Source: county tax records.
Cash-flow waterfall
monthlySold comps — $/sqft
last 12 mo · ≤1 miLoading sold comps…