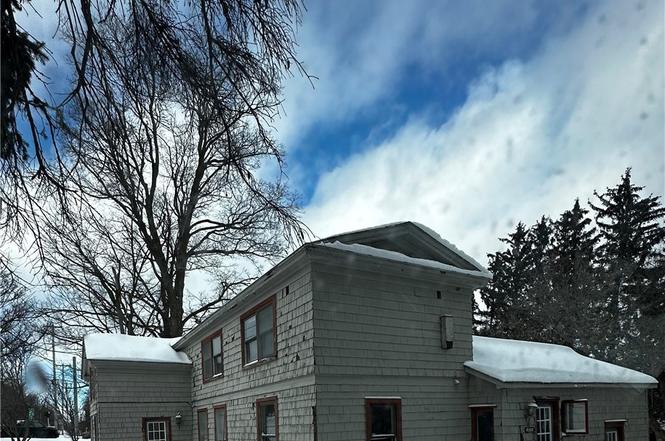
4880 Onondaga Rd · Syracuse, NY
Flood risk 1/10 · Minimal
- FEMA flood zone
- X (unshaded)
- Chance of flooding over 30 yrs
- 0.0%
- Est. flood insurance / yr
- $473 – $860
Fire risk 2/10 · Minimal
- Est. fire insurance / yr
- $691 – $1,283
Heat risk 2/10 · Minimal
- Hot days now (above 92°F)
- 7 days/yr
- Hot days in 30 yrs
- 16 days/yr
Wind risk 1/10 · Minimal
- Chance of severe wind over 30 yrs
- 0.0%
Air-quality risk 2/10 · Minimal
- Unhealthy air days now
- 0 days/yr
- Unhealthy air days in 30 yrs
- 1 days/yr
Risk factors via First Street. Map © Google.
Why this score? — see what drove the B grade
The composite is a weighted blend of 9 inputs, each scored 0–100. Each bar is that input's sub-score; the figure is the points it added to the 100-point composite (weight × sub-score).
- Cash flow +30.0/30.0
- 1% rule +10.0/10.0
- DSCR +10.0/10.0
- ARV discount +7.5/15.0
- Schools +5.3/10.0
- Rent growth +4.1/5.0
- Livability +3.9/5.0
- Condition / age +2.5/5.0
- Appreciation +0.0/10.0
$90,000
🖨 Deal sheet (PDF) 📄 Offer letter ✓ Due diligence
Key facts
- 0.5 acre lot
- Built 1880
- Listed 130 days
Property features AI
Exterior
- Parking: No garage
- Utilities: Public water (connected/available); Sewer (connected/available)
- Home design: 2-story house; Existing construction
- Construction: Cedar, shake siding and vinyl siding exterior; Block foundation
- Exterior features: Gravel driveway; Corner lot; Irregular lot; Near public transit; Main thoroughfare frontage
Interior
- Kitchen: Eat-in kitchen
- Bedrooms: One bedroom on the main level
- Flooring: Carpet; Laminate; Varies
- Bathrooms: Two full bathrooms; One main-level bathroom
- Heating & cooling: Gas heating; Hot water heat; Heating present (see remarks)
- Interior features: Den; Separate/formal dining room; Eat-in kitchen; Separate/formal living room; Home office; Has basement (partial)
- Laundry & utility: Main-level laundry
Neighborhood map
What this means for you Summary
Snapshot
- This is a 3-bed/2.0-bath single-family listed at $90k.
Deal economics
- At list price, monthly cash flow is $765 ($9k/yr) — positive.
- The deal already cash-flows at list — no discount required.
- Meets the 1% rule at list price ($2k rent vs $90k).
- Recommended offer: $79k (12.0% below list) — sets the bar for market timing.
- Cap rate 16.5% vs local median 8.2% in Syracuse — top-decile yield for the area; either an underpriced asset or a hidden risk that comps aren't pricing in. Stress-test before assuming the spread holds.
Location & tenants
- Location reads 77/100 on livability (#187 in NY, #2,869 nationally) — a middle-class / working-renter tenant base. Strengths: amenities A+, commute A+, cost of living A+; Watch: crime F, employment D-.
- Westhill Central School District (suburban): math 57% / reading 64% proficiency, ranked #212 of 590 in NY (top 36%) — acceptable for families but not a draw, mixed tenant base, ~2y average lease; only 11% free/reduced lunch — higher-income household profile.
- Zoned schools: Cherry Road Elementary School (math 65% / reading 72%, grade B+, #517 of 2,108 statewide, top 25%, 365 students, 32% FRL); Onondaga Hill Middle School (math 39% / reading 60%, grade C, #280 of 729 statewide, top 40%, 554 students, 32% FRL); Westhill High School (math 98% / reading 70%, grade A, #409 of 1,100 statewide, top 39%, 550 students, 25% FRL) — zoned schools average 29% FRL vs 11% district-wide (18 pts higher); higher-poverty schools than district average — tighter screening recommended.
- Market conditions: Rents rising fast (+6.4%/yr); 64 active listings in the ZIP; 4 comparable units currently listed for rent nearby; rentals at typical pace (median 15d on market — plan ~3-4 weeks tenant-placement turnaround); high-income renter base; 616 units permitted in Onondaga County in 2024 (256 in 5+ unit buildings).
Forward outlook
- Local home prices are declining (-3.0%/yr); year-one equity from $622 of loan paydown is wiped out by about $3k of value loss. Plan a longer hold.
- Onondaga County population projected to shrink 9% by 2050 — rents likely to lag national; underwrite the cash flow, not the appreciation.
- At projected returns (-3.0% appreciation + 6.4% rent growth), your $25k cash investment doubles in ~4 years — after that, you're playing with house money.
Negotiation context
- It's been on market 130 days — a 12% lower offer ($79k) is reasonable based on typical stale-listing flexibility.
Risks & watch-outs
- Watch-outs: built in 1880 — expect roof / HVAC / electrical / plumbing capex.
Questions for the listing agent
- It's been on market 130 days. Have you received any prior offers? Is the seller open to a 12% concession, seller financing, or rate buy-down credit?
- Built in 1880 — when were the roof, HVAC, electrical panel, plumbing, and water heater last replaced?
- Why hasn't it sold? Are there any deal-killer items the seller is aware of (foundation, flood, title, zoning, code violations)?
- Is there a deadline driving the sale (1031 exchange, divorce, estate, relocation)? That informs how much negotiation room exists.
- Schools are D-rated, which usually means shorter tenancies and higher turnover. Who's the typical renter profile here, and what's been the actual vacancy rate?
- Crime grade is F in this area — have there been break-ins, vandalism, or insurance claims at this property in the last 3 years? What carrier currently insures it and at what premium?
- What's the average days-on-market for RENTAL listings here right now (not sales)? A rising rental-DOM trend means longer vacancies and softer asking-rent achievability than the comps imply.
- What's the recent tenant-quality profile in this submarket — average credit score on applications, eviction rate, late-payment / NSF rate, and stable-employment percentage? A property-management company in the area should have these aggregated.
- How much new for-sale + rental construction is in the pipeline within 1–3 miles? Heavy new supply typically softens prices + rents 12–24 months out; constrained supply supports both.
Investment metrics
- 1% rule
- 1.95% ✓
- Cap rate
- 16.49%
- Cash-on-cash
- 36.43%
- DSCR
- 2.62
- GRM
- 4.3
CMA / ARV
- ARV (on-the-fly)
- $242,190
- Comps found
- 8
Show comp detail 8 sales within ~0.75 mi
| Address | Dist | Beds/Ba | Sqft | Sold | Price | $/sf | Match |
|---|---|---|---|---|---|---|---|
| 4904 Velasko Rd | 0.08mi | 3/2.0 | 1,363 (+10%) | 20mo | $245,000 | $180 | 63 |
| 4895 South Ave Ave | 0.52mi | 3/2.0 | 1,296 (+4%) | 8mo | $275,000 | $212 | 62 |
| 4891 Onondaga Rd | 0.12mi | 4/2.0 (+1) | 1,368 (+10%) | 13mo | $267,000 | $195 | 62 |
| 4790 W Seneca Tpke | 0.24mi | 3/1.0 | 1,380 (+11%) | 8mo | $205,000 | $149 | 60 |
| 4814 Mcdonald Rd | 0.62mi | 3/1.0 | 1,204 (-3%) | 6mo | $280,000 | $233 | 57 |
| 4796 Makyes Rd | 0.30mi | 3/1.5 | 1,344 (+8%) | 19mo | $209,000 | $156 | 54 |
| 4753 W Seneca | 0.29mi | 3/1.5 | 1,413 (+14%) | 11mo | $170,000 | $120 | 52 |
| 4874 Glenfield Dr | 0.71mi | 4/2.0 (+1) | 1,398 (+13%) | 10mo | $325,000 | $232 | 33 |
Match score weights: distance 35% · size 25% · config 20% · recency 20%. Top-matched comps best support the ARV.
Projected returns pro-forma
-3.0% appreciation · 6.42% rent growth · sell at horizon
- IRR
- 36.1%
- Equity multiple
- 2.60×
- Total profit
- $40,414
- Equity at exit
- $13,419
- IRR
- 44.5%
- Equity multiple
- 5.98×
- Total profit
- $125,549
- Equity at exit
- $7,782
Cash invested: $25,200 (down + closing). Projections, not guarantees.
Landlord ↔ Tenant lean methodology
- Overall (STATE)
- 15 Strongly Tenant-Friendly
- State New York
- 15 Strongly Tenant-Friendly · D+10
- County
- — inherits STATE
- City
- — inherits STATE
ZIP-level market 13215
- Home prices YoY
- -8.0%
- Rents YoY
- 6.4%
- Active inventory
- 64
- Price-to-rent
- 4.3×
Monthly cashflow live
- Estimated rent
- $1,756 medium interval (Pro) →
- Mortgage (P&I)
- −$472
- Tax est. 1.5%
- −$112 /mo · $1,350/yr
- Insurance
- −$38
- HOA
- −$0
- Vacancy / Maint / Mgmt
- −$369
- Net cashflow
- $765
Break-even live
Sensitivity live
| Price | -10% $827 | -5% $796 | +0% $765 | +5% $734 | +10% $703 |
|---|---|---|---|---|---|
| Rent | -10% $626 | -5% $696 | +0% $765 | +5% $834 | +10% $904 |
| Rate | -1.0pp $810 | -0.5pp $788 | base $765 | +0.5pp $742 | +1.0pp $718 |
UW: 25.0% down · 7.5% · 30yr · 1.5% tax · 5.0% vac · 8.0% maint · 8.0% mgmt
Financing live
Cash to close
- Down payment
- $22,500
- Closing costs
- $2,700
- Reserves months
- —
- Total cash needed
- —
Loan-product check · same deal, 3 products live
Conventional
25% down · 7.5% · 30yr
- Down + closing
- —
- Monthly P&I
- —
- Monthly cashflow
- —
- DSCR
- —
- Eligible?
- —
Personal DTI + credit; lowest rate.
DSCR
20% down · 8.5% · 30yr
- Down + closing
- —
- Monthly P&I
- —
- Monthly cashflow
- —
- DSCR
- —
- Eligible?
- —
No personal income docs; deal must DSCR.
Hard money
10% down · 12.0% · 12mo
- Down + closing
- —
- Monthly P&I
- —
- Monthly cashflow
- —
- DSCR
- —
- Eligible?
- —
Short-term bridge; refi at stabilization.
Rent comps 4 comps
| Address | Beds | Baths | Sqft | Rent | $/sqft | DOM | Units | Dist |
|---|---|---|---|---|---|---|---|---|
| 140 Westbrook Hills Dr Syracuse, NY | 1.0–2.0 | 1.0 | 942 | $1,665 | $1.77 | 15d | 21 | 0.61mi |
| 213 Fletcher Ave Unit 2 Syracuse, NY | 3.0 | 1.0 | 1200 | $1,700 | $1.42 | 15d | 1 | 1.03mi |
| 5111 Ball Rd Syracuse, NY | 1.0–2.0 | 1.0–1.5 | 1138 | $1,820 | $1.60 | 15d | 16 | 1.06mi |
| 300 Mains Ave Unit Bradford-7 Syracuse, NY | 2.0 | 1.0 | 1200 | $1,100 | $0.92 | 15d | 1 | 1.34mi |
Listing history 3 events
-
2026-04-26status Pending
-
2026-04-09price $90,000
-
2025-12-17$149,900 Active
ⓘ Source: listings_history table (triggers on properties + properties_extension) + one-shot
backfill from property_details.listing_events for pre-trigger history.
Climate risk First Street
- Flood 1/10 Low FEMA zone X (unshaded) · 0% chance over 30 yrs
- Wildfire 2/10 Low
- Heat 2/10 Low 7 d/yr ≥92°F today · 16 d/yr by 30 yrs out
- Wind 1/10 Low 0% chance of damaging wind over 30 yrs
- Air quality 2/10 Low 0 unhealthy d/yr today · 1 by 30 yrs out
Nearby sold comps map
Loading sold comps map…
Walkable amenities ~0.75 mi
Loading nearby amenities…
Taxation est. · year 1
- Rental income
- $21,068
- − Mortgage interest
- −$5,041
- − Property taxes
- −$1,350
- − Insurance
- −$450
- − Repairs & maintenance
- −$1,685
- − Management
- −$1,685
- − Depreciation
- −$2,618
- Taxable income
- $8,237
- Est. tax owed @ 24.0%
- −$1,977
- After-tax cash flow
- $7,203/yr
For passive investors: Depreciation is non-cash, so a rental often shows a tax loss while cash-flowing — sheltering income. Rental losses are passive: they offset passive income freely, and up to $25,000/yr can offset ordinary (W-2) income if you actively participate and your MAGI is under $100k (phasing out to $0 by $150k); unused losses carry forward. On sale, claimed depreciation is recaptured at up to 25%, and gains may owe capital-gains tax (a 1031 exchange can defer both). Figures are a year-1 estimate at your 24.0% rate — not tax advice; consult a CPA.
Schools (NCES district)
- District
- Westhill Central School District
- NCES district ID
- 3607320
- Math proficiency
- 57% ▼ -10.00%
- Reading proficiency
- 64% ▲ 9.00%
- Median HH income
- $66,976
- Composite
- 53.09/100
- National rank
- #1516
- State rank
- #212 of 590 in NY
Livability — Syracuse
- Score
- 77/100
- State rank
- #187
- US rank
- #2869
Category grades
Schools grade is shown separately in the Schools card above.
Census & demographics
- County
- Onondaga County · 247,257 people
- City population
- 152,627
- Metro
- Syracuse, NY
- Population (ZIP)
- 14,751
- Household income
- $113,864
- Rent vs Own
- Severe rent burden
- 254.0
Population outlook (Onondaga County) Hauer SSP2
- Today (2025)
- 467,894 people
- By 2030
- 463,381 · -1.0%
- By 2040
- 447,697 · -4.3%
- By 2050
- 426,399 · -8.9%
- By 2075
- 373,661 · -20.1%
- By 2100
- 307,967 · -34.2%
Race, ethnicity, and origin ACS 2023
- Neighborhood character
- Predominantly White (84%)
- Race & ethnicity
- White 84% Black 7% Two or more races 5% Hispanic / Latino 4% Asian 1%
- Common ancestry
- Romanian 8% Lithuanian 4% Subsaharan African 3%
- Foreign-born
- 4% · Canada, China, South Korea
- Languages at home
- 94% English-only · Spanish 2% Russian/Polish/Slavic 1% Chinese 1%
Political lean MEDSL · Onondaga
- 2024 margin
- D (+17.3) · D 58.6% · R 41.4%
- 2008→2024 swing
- -3.0pp toward R · 2008: 20.3pp · 2024: 17.3pp
- All cycles
- 2024: D+17.3 2020: D+20.6 2016: D+12.8 2012: D+21.1 2008: D+20.3
Not yet ingested
- Civics
- —
Market trends
- HPI YoY
- ▼ -25.54%
- Current HPI
- 294.8783
- Rent YoY
- ▲ 6.42%
- Metro
- Syracuse, NY
- State GDP YoY
- ▲ 2.60%
- F500 in state
- 92
Industry mix (Fortune 500 HQ in NY)
| Industry | F500 HQs | Revenue |
|---|---|---|
| Financial Services | 10 | $950B |
|
||
| Consumer Goods | 9 | $162B |
|
||
| Insurance | 4 | $225B |
|
||
| Telecommunications | 2 | $144B |
|
||
| Pharmaceuticals | 2 | $112B |
|
||
| Media / Entertainment | 2 | $69B |
|
||
Price history
-40.0% since first listed3 events — show timeline
- 2026-04-26 Pending — CNYIS
- 2026-04-09 Price Changed $90,000 CNYIS
- 2025-12-17 Listed $149,900 CNYIS
Cash-flow waterfall
monthlySold comps — $/sqft
last 12 mo · ≤1 miLoading sold comps…