8086 Mission Blvd #20 · Jurupa Valley, CA
Flood risk 1/10 · Minimal
- FEMA flood zone
- X (unshaded)
- Chance of flooding over 30 yrs
- 0.0%
- Est. flood insurance / yr
- $507 – $1,088
Fire risk 8/10 · Major
- Est. fire insurance / yr
- $659 – $1,223
Heat risk 8/10 · Major
- Hot days now (above 103°F)
- 7 days/yr
- Hot days in 30 yrs
- 21 days/yr
Wind risk 1/10 · Minimal
- Chance of severe wind over 30 yrs
- —
Air-quality risk 10/10 · Severe
- Unhealthy air days now
- 28 days/yr
- Unhealthy air days in 30 yrs
- 34 days/yr
Risk factors via First Street. Map © Google.
Why this score? — see what drove the B- grade
The composite is a weighted blend of 9 inputs, each scored 0–100. Each bar is that input's sub-score; the figure is the points it added to the 100-point composite (weight × sub-score).
- Cash flow +29.0/30.0
- DSCR +10.0/10.0
- 1% rule +8.1/10.0
- ARV discount +7.5/15.0
- Condition / age +5.0/5.0
- Schools +3.1/10.0
- Rent growth +2.8/5.0
- Livability +2.5/5.0
- Appreciation +0.0/10.0
$209,900
🖨 Deal sheet 📄 Offer letter ✓ Due diligence
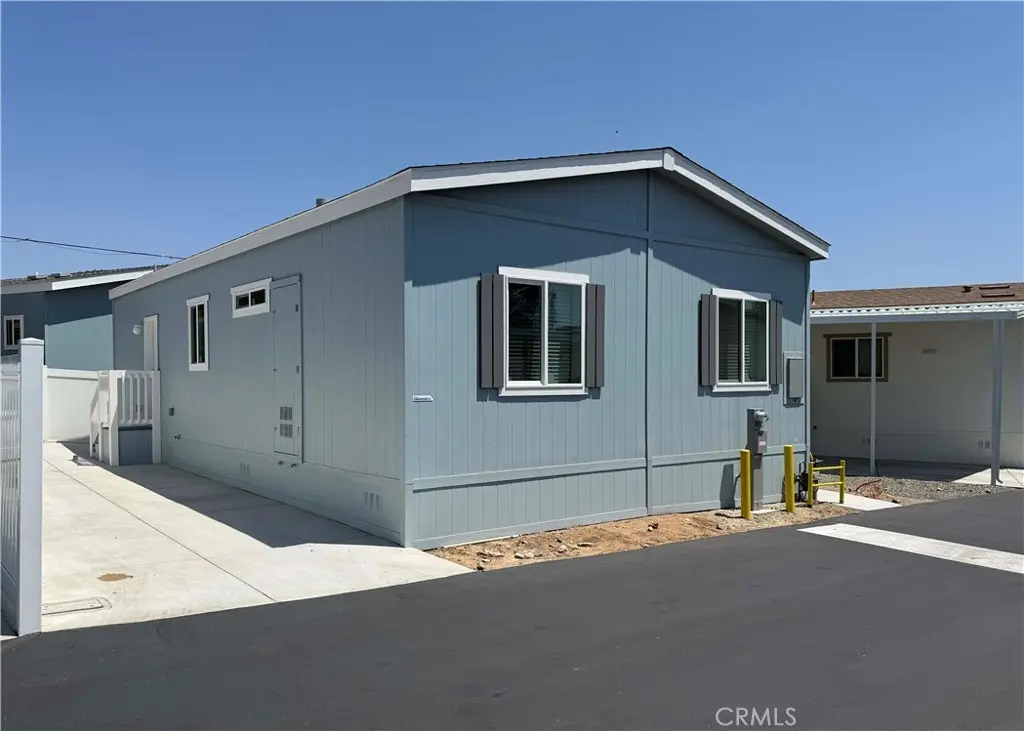
Listing remarks
This charming 2026 Silvercrest home features three bedrooms and two bathrooms, offering approximately 960 square feet of living space. Situated in the all-age, land-leased community of Jurupa Hills, this residence boasts a spacious floor plan with 9-foot sidewalls and a flat ceiling. The kitchen is equipped with Whirlpool appliances, quartz countertops, a subway-tile backsplash, a Kohler stainless-steel sink, and white cabinets. Laminate flooring runs throughout the home, adding to its appeal. Jurupa Hills is conveniently located near various shops, restaurants, and entertainment options. Don't miss out on this opportunity! For more details, please get in touch with the property manager reg
Key facts
- 2 parking spots
- Community pool
- Built 2026
Property features AI
Finance
- Other: Lot density approx. 11–15 units per acre; Elevation units listed in feet
- Financial info: Monthly land lease of $1,100 (park-provided)
- HOA & community: Located in Jurupa Hills Mobile Home Park; Park has manager approval for residency; Pets allowed with breed restrictions; Land lease required
Exterior
- Parking: Covered carport; Concrete driveway; Two parking spaces (including 2 carport spaces)
- Utilities: Standard electric service; Natural gas connected; Public/district water; Public sewer; Electricity connected; Sewer connected
- Home design: Single-story; Mobile home model BD-92; Turnkey condition; 20 ft wide by 40 ft long
- Construction: Shingle roof; Pier jacks foundation; Builder-reported year built source
- Exterior features: In-ground, fenced community pool; Paved roads; Community street lighting; Suburban setting; 2+ access exits
Interior
- Kitchen: Gas range; Dishwasher; Microwave; Garbage disposal; Refrigerator; Quartz countertops
- Flooring: Laminate flooring
- Bathrooms: Two full bathrooms; Showers and shower-in-tub combos with quartz counters
- Heating & cooling: Central cooling; Forced-air heating
- Interior features: Quartz counters throughout; Open floor plan; Recessed lighting; Unfurnished; Two staircases; Blinds on windows; Main-level entry
- Laundry & utility: Indoor laundry room; Washer included; Dryer included; Washer hookup; Gas dryer hookup
Neighborhood map
What this means for you Summary
Snapshot
- This is a 3-bed/2.0-bath manufactured listed at $210k. Condition is rated excellent.
Deal economics
- At list price, monthly cash flow is $720 ($9k/yr) — positive.
- The deal already cash-flows at list — no discount required.
- Meets the 1% rule at list price ($3k rent vs $210k).
- Cap rate 10.4% vs local median 2.9% in Jurupa Valley — top-decile yield for the area; either an underpriced asset or a hidden risk that comps aren't pricing in. Stress-test before assuming the spread holds.
Location & tenants
- Location reads 49/100 on livability (#1,170 in CA) — a working-class tenant base; expect higher turnover. Strengths: housing A+, employment A-; Watch: schools F, amenities F, commute F.
- Jurupa Unified (suburban): math 25% / reading 38% proficiency, ranked #953 of 1,400 in CA (top 68%) — families likely to look elsewhere, expect single-tenant / working-renter base with shorter leases; 64% free/reduced lunch — lower-income household profile, screen leases tightly.
- Market conditions: Rents rising (+1.3%/yr); 202 active listings in the ZIP; 2 comparable units currently listed for rent nearby; solid renter incomes; 9,195 units permitted in Riverside County in 2024 (1,512 in 5+ unit buildings).
- This rent runs 35% of the median local income ($95k/yr) — at the standard rent-burdened threshold; future hikes will face affordability resistance.
Forward outlook
- Local home prices are declining (-3.0%/yr); year-one equity from $1k of loan paydown is wiped out by about $6k of value loss. Plan a longer hold.
- Riverside County population projected at +22% by 2050 — long-run rental-demand tailwind backs the buy-and-hold thesis.
- At projected returns (-3.0% appreciation + 1.3% rent growth), your $59k cash investment doubles in ~10 years — after that, you're playing with house money.
Negotiation context
- Only 8 days on market — expect competitive offers; lowballing is unlikely to land.
Risks & watch-outs
- Climate carrying-cost: severe wildfire risk; extreme-heat days projected 7→21/yr by 2055 (HVAC capex compounding) — expect insurance premiums to compound above CPI over the hold.
Questions for the listing agent
- Is there a deadline driving the sale (1031 exchange, divorce, estate, relocation)? That informs how much negotiation room exists.
- Schools are F-rated, which usually means shorter tenancies and higher turnover. Who's the typical renter profile here, and what's been the actual vacancy rate?
- What's the average days-on-market for RENTAL listings here right now (not sales)? A rising rental-DOM trend means longer vacancies and softer asking-rent achievability than the comps imply.
- What's the recent tenant-quality profile in this submarket — average credit score on applications, eviction rate, late-payment / NSF rate, and stable-employment percentage? A property-management company in the area should have these aggregated.
- How much new for-sale + rental construction is in the pipeline within 1–3 miles? Heavy new supply typically softens prices + rents 12–24 months out; constrained supply supports both.
Investment metrics
- 1% rule
- 1.31% ✓
- Cap rate
- 10.41%
- Cash-on-cash
- 14.71%
- DSCR
- 1.65
- GRM
- 6.4
CMA / ARV
No comps found within radius.
Projected returns pro-forma
-3.0% appreciation · 1.31% rent growth · sell at horizon
- IRR
- 3.3%
- Equity multiple
- 1.12×
- Total profit
- $7,307
- Equity at exit
- $31,297
- IRR
- 11.2%
- Equity multiple
- 1.81×
- Total profit
- $47,373
- Equity at exit
- $18,148
Cash invested: $58,772 (down + closing). Projections, not guarantees.
Landlord ↔ Tenant lean methodology
- Overall (STATE)
- 18 Strongly Tenant-Friendly
- State California
- 18 Strongly Tenant-Friendly · D+13
- County
- — inherits STATE
- City
- — inherits STATE
ZIP-level market 92509
- Rents YoY
- 1.3%
- Active inventory
- 202
- Price-to-rent
- 6.4×
Monthly cashflow live
- Estimated rent
- $2,748 medium interval (Pro) →
- Mortgage (P&I)
- −$1,101
- Tax est. 1.5%
- −$262 /mo · $3,148/yr
- Insurance
- −$87
- HOA
- −$0
- Vacancy / Maint / Mgmt
- −$577
- Net cashflow
- $720
Break-even live
UW: 25.0% down · 7.5% · 30yr · 1.5% tax · 5.0% vac · 8.0% maint · 8.0% mgmt
Financing live
Cash to close
- Down payment
- $52,475
- Closing costs
- $6,297
- Reserves months
- —
- Total cash needed
- —
Loan-product check · same deal, 3 products live
Conventional
25% down · 7.5% · 30yr
- Down + closing
- —
- Monthly P&I
- —
- Monthly cashflow
- —
- DSCR
- —
- Eligible?
- —
Personal DTI + credit; lowest rate.
DSCR
20% down · 8.5% · 30yr
- Down + closing
- —
- Monthly P&I
- —
- Monthly cashflow
- —
- DSCR
- —
- Eligible?
- —
No personal income docs; deal must DSCR.
Hard money
10% down · 12.0% · 12mo
- Down + closing
- —
- Monthly P&I
- —
- Monthly cashflow
- —
- DSCR
- —
- Eligible?
- —
Short-term bridge; refi at stabilization.
Rent comps 2 comps
| Address | Beds | Baths | Sqft | Rent | $/sqft | DOM | Units | Dist |
|---|---|---|---|---|---|---|---|---|
| 4254 Avon St Riverside, CA | 2.0 | 1.0 | 825 | $2,195 | $2.66 | 44d | 1 | 1.11mi |
| 5100 Agate St Riverside, CA | 2.0 | 1.0 | 800 | $2,400 | $3.00 | 44d | 1 | 1.24mi |
Listing history 15 events
-
2026-06-18days on market $209,900 Active 8 DOM
-
2026-06-17days on market $209,900 Active 7 DOM
-
2026-06-16days on market $209,900 Active 6 DOM
-
2026-06-15days on market $209,900 Active 5 DOM
-
2026-06-13days on market $209,900 Active 3 DOM
-
2026-06-13statusdays on market $209,900 Active 2 DOM
-
2026-06-09days on market $209,900 Coming Soon 18 DOM
-
2026-06-08days on market $209,900 Coming Soon 17 DOM
-
2026-06-07days on market $209,900 Coming Soon 16 DOM
-
2026-06-04days on market $209,900 Coming Soon 13 DOM
-
2026-06-03days on market $209,900 Coming Soon 12 DOM
-
2026-06-02days on market $209,900 Coming Soon 11 DOM
-
2026-06-01days on market $209,900 Coming Soon 10 DOM
-
2026-05-31days on market $209,900 Coming Soon 9 DOM
-
2026-05-23historical $209,900
ⓘ Source: listings_history table (triggers on properties + properties_extension) + one-shot
backfill from property_details.listing_events for pre-trigger history.
Climate risk First Street
- Flood 1/10 Low FEMA zone X (unshaded) · 0% chance over 30 yrs
- Wildfire 8/10 Severe
- Heat 8/10 Severe 7 d/yr ≥103°F today · 21 d/yr by 30 yrs out
- Wind 1/10 Low
- Air quality 10/10 Extreme 28 unhealthy d/yr today · 34 by 30 yrs out
Nearby sold comps map
Loading sold comps map…
Walkable amenities ~0.75 mi
Loading nearby amenities…
Taxation est. · year 1
- Rental income
- $32,975
- − Mortgage interest
- −$11,758
- − Property taxes
- −$3,148
- − Insurance
- −$1,050
- − Repairs & maintenance
- −$2,638
- − Management
- −$2,638
- − Depreciation
- −$6,106
- Taxable income
- $5,637
- Est. tax owed @ 24.0%
- −$1,353
- After-tax cash flow
- $7,290/yr
For passive investors: Depreciation is non-cash, so a rental often shows a tax loss while cash-flowing — sheltering income. Rental losses are passive: they offset passive income freely, and up to $25,000/yr can offset ordinary (W-2) income if you actively participate and your MAGI is under $100k (phasing out to $0 by $150k); unused losses carry forward. On sale, claimed depreciation is recaptured at up to 25%, and gains may owe capital-gains tax (a 1031 exchange can defer both). Figures are a year-1 estimate at your 24.0% rate — not tax advice; consult a CPA.
Condition & rehab AI · 3 photos
This 2026 Silvercrest home in Jurupa Hills is in excellent condition with no visible repairs needed. It offers a spacious floor plan, quartz countertops, and laminate flooring. Upgrades to the exterior and interior, as well as kitchen and bathroom updates, would significantly increase its value.
Value-add opportunities
- Both Paint exterior and interior walls — Enhances curb appeal and interior aesthetics
- Both Install new landscaping — Improves curb appeal and adds value
- Both Upgrade kitchen appliances — Modernizes the kitchen and adds value
- Both Install new flooring in bathrooms — Enhances the bathrooms and adds value
Renovation cost estimate screening
Value-add ROI direction
- Both Paint exterior and interior walls — Enhances curb appeal and interior aesthetics ↑
- Both Install new landscaping — Improves curb appeal and adds value ↑
- Both Upgrade kitchen appliances — Modernizes the kitchen and adds value ↑
- Both Install new flooring in bathrooms — Enhances the bathrooms and adds value ↑
ⓘ Cost ranges are severity-bucket heuristics (US national rule-of-thumb). Get contractor quotes + a written scope before underwriting a rehab budget.
Schools (NCES district)
- District
- Jurupa Unified
- NCES district ID
- 0619260
- Math proficiency
- 25% ▲ 2.00%
- Reading proficiency
- 38% ▲ 2.00%
- Median HH income
- $58,100
- Composite
- 30.97/100
- National rank
- #11327
- State rank
- #953 of 1400 in CA
Livability — Jurupa Valley
- Score
- 49/100
- State rank
- #1170
- US rank
- #25915
Category grades
Schools grade is shown separately in the Schools card above.
Census & demographics
- Census place
- Jurupa Valley, CA
- County
- Riverside County · 2,287,001 people
- City population
- 119,165
- Metro
- Riverside-San Bernardino-Ontario, CA
- Population (ZIP)
- 81,182
- Household income
- $95,355
- Rent vs Own
- Severe rent burden
- 1694.0
Population outlook (Riverside County) Hauer SSP2
- Today (2025)
- 2,664,475 people
- By 2030
- 2,802,692 · +5.2%
- By 2040
- 3,050,904 · +14.5%
- By 2050
- 3,256,783 · +22.2%
- By 2075
- 3,655,058 · +37.2%
- By 2100
- 3,766,594 · +41.4%
Race, ethnicity, and origin ACS 2023
- Neighborhood character
- Predominantly Hispanic (74%)
- Race & ethnicity
- Hispanic / Latino 74% White 17% Two or more races 16% Black 4% Asian 4% Native American 1%
- Hispanic origin (detail)
- Mexican 67%
- Common ancestry
- Lithuanian 1%
- Foreign-born
- 28% · Canada, China, Vietnam
- Languages at home
- 42% English-only · Spanish 54% Other Indo-European 1% Tagalog/Filipino 1%
Political lean MEDSL · Riverside
- 2024 margin
- Toss-up / Even · D 48.0% · R 49.3% · Other 2.6%
- 2008→2024 swing
- -3.6pp toward R · 2008: 2.3pp · 2024: -1.3pp
- All cycles
- 2024: R+1.3 2020: D+8.0 2016: D+4.3 2012: R+0.4 2008: D+2.3
Not yet ingested
- Civics
- —
Market trends
- HPI YoY
- ▼ -374.91%
- Current HPI
- 464.8939
- Rent YoY
- ▲ 1.31%
- Metro
- Riverside-San Bernardino-Ontario, CA
- State GDP YoY
- ▲ 3.21%
- F500 in state
- 116
Industry mix (Fortune 500 HQ in CA)
| Industry | F500 HQs | Revenue |
|---|---|---|
| Technology | 27 | $1,492B |
|
||
| Financial Services | 3 | $174B |
|
||
| Retail | 3 | $44B |
|
||
| Insurance | 3 | $26B |
|
||
| Media / Entertainment | 2 | $115B |
|
||
| Pharmaceuticals / Biotech | 2 | $62B |
|
||
Price history
1 event — show timeline
- 2026-05-23 Coming Soon $209,900 CRMLS
Cash-flow waterfall
monthlySold comps — $/sqft
last 12 mo · ≤1 miLoading sold comps…