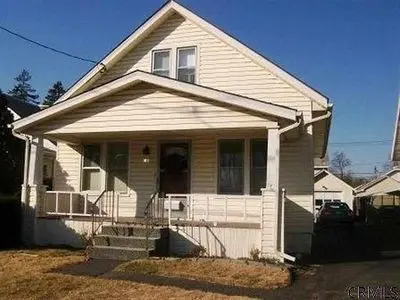
51 Oakland Ave · Roessleville, NY
Flood risk 4/10 · Minor
- FEMA flood zone
- X (unshaded)
- Chance of flooding over 30 yrs
- 0.21%
- Est. flood insurance / yr
- $473 – $860
Fire risk 1/10 · Minimal
- Est. fire insurance / yr
- $691 – $1,283
Heat risk 4/10 · Minor
- Hot days now (above 96°F)
- 7 days/yr
- Hot days in 30 yrs
- 16 days/yr
Wind risk 3/10 · Minor
- Chance of severe wind over 30 yrs
- 6.0%
Air-quality risk 1/10 · Minimal
- Unhealthy air days now
- 0 days/yr
- Unhealthy air days in 30 yrs
- 0 days/yr
Risk factors via First Street. Map © Google.
Why this score? — see what drove the B grade
The composite is a weighted blend of 9 inputs, each scored 0–100. Each bar is that input's sub-score; the figure is the points it added to the 100-point composite (weight × sub-score).
- Cash flow +26.5/30.0
- ARV discount +15.0/15.0
- DSCR +9.1/10.0
- 1% rule +7.7/10.0
- Schools +5.3/10.0
- Rent growth +2.5/5.0
- Livability +2.5/5.0
- Condition / age +2.5/5.0
- Appreciation +0.0/10.0
$175,000
🖨 Deal sheet (PDF) 📄 Offer letter ✓ Due diligence
Listing remarks MLS
REDUCED! Owner recently updated this 3BR, 1.5BA Colonie Bungalow. Updated Kitchen, New Bath, HW Floors & freshly painted throughout! Huge 2nd floor Master BR. Fenced in yard on a landscaped lot. Low South Colonie Taxes. Excellent Condition
Key facts
- New bath
- Landscaped lot
- Updated kitchen
Tags
Neighborhood map
What this means for you Summary
Snapshot
- This is a 3-bed/1.5-bath single-family listed at $175k.
Deal economics
- At list price, monthly cash flow is $464 ($6k/yr) — positive.
- The deal already cash-flows at list — no discount required.
- Meets the 1% rule at list price ($2k rent vs $175k).
- Recommended offer: $172k (1.5% below list) — sets the bar for market timing.
- Cap rate 9.5% vs local median 5.3% in Roessleville — top-decile yield for the area; either an underpriced asset or a hidden risk that comps aren't pricing in. Stress-test before assuming the spread holds.
Location & tenants
- Location reads: area grade B — affects rentability + tenant quality, not the cash-flow math above.
- South Colonie Central School District (suburban): math 63% / reading 57% proficiency, ranked #215 of 590 in NY (top 36%) — acceptable for families but not a draw, mixed tenant base, ~2y average lease; only 19% free/reduced lunch — higher-income household profile.
- Zoned schools: Roessleville School (math 52% / reading 57%, grade C, #908 of 2,108 statewide, top 46%, 350 students, 44% FRL); Sand Creek Middle School (math 49% / reading 49%, grade C-, #294 of 729 statewide, top 41%, 868 students, 46% FRL); Colonie Central High School (math 96% / reading 72%, grade A, #404 of 1,100 statewide, top 37%, 1,538 students, 39% FRL) — zoned schools average 43% FRL vs 19% district-wide (24 pts higher); higher-poverty schools than district average — tighter screening recommended.
- Market conditions: 105 active listings in the ZIP; 16 comparable units currently listed for rent nearby; rentals at typical pace (median 23d on market — plan ~3-4 weeks tenant-placement turnaround); solid renter incomes; 675 units permitted in Albany County in 2024 (451 in 5+ unit buildings).
Forward outlook
- Local home prices are declining (-3.0%/yr); year-one equity from $1k of loan paydown is wiped out by about $5k of value loss. Plan a longer hold.
- Albany County population projected at +9% by 2050 — modest demand growth; plan on rents tracking national, not racing it.
- At projected returns (-3.0% appreciation + 3.0% rent growth), your $49k cash investment doubles in ~10 years — after that, you're playing with house money.
Negotiation context
- It's been on market 15 days — a 2% lower offer ($172k) is reasonable based on typical stale-listing flexibility.
- 2 sale attempts since 15y ago; this cycle's ask is 17% above the opening price — seller raised mid-cycle; expect resistance to lowballs.
Risks & watch-outs
- Watch-outs: built in 1932 — expect roof / HVAC / electrical / plumbing capex.
Questions for the listing agent
- Built in 1932 — when were the roof, HVAC, electrical panel, plumbing, and water heater last replaced?
- Is there a deadline driving the sale (1031 exchange, divorce, estate, relocation)? That informs how much negotiation room exists.
- What's the average days-on-market for RENTAL listings here right now (not sales)? A rising rental-DOM trend means longer vacancies and softer asking-rent achievability than the comps imply.
- What's the recent tenant-quality profile in this submarket — average credit score on applications, eviction rate, late-payment / NSF rate, and stable-employment percentage? A property-management company in the area should have these aggregated.
- How much new for-sale + rental construction is in the pipeline within 1–3 miles? Heavy new supply typically softens prices + rents 12–24 months out; constrained supply supports both.
Investment metrics
- 1% rule
- 1.27% ✓
- Cap rate
- 9.47%
- Cash-on-cash
- 11.35%
- DSCR
- 1.51
- GRM
- 6.6
CMA / ARV
- ARV (median comp)
- $288,588
- List price
- $175,000
- Delta
- -39.36%
- Verdict
- UNDERPRICED
- Comps
- 20 within 1.0 mi
Show comp detail 12 sales within ~0.75 mi
| Address | Dist | Beds/Ba | Sqft | Sold | Price | $/sf | Match |
|---|---|---|---|---|---|---|---|
| 12 Arcadia Ct | 0.22mi | 3/2.0 | 1,142 (-4%) | 2mo | $292,000 | $256 | 80 |
| 9 Corthell St | 0.32mi | 3/2.0 | 1,209 (+2%) | 5mo | $263,000 | $218 | 75 |
| 14 Woodside Ave | 0.04mi | 4/3.0 (+1) | 1,248 (+5%) | 5mo | $300,000 | $240 | 74 |
| 20 N Elmhurst Ave | 0.27mi | 4/1.5 (+1) | 1,116 (-6%) | 1mo | $315,000 | $282 | 72 |
| 34 Highland Ave | 0.13mi | 3/1.0 | 1,300 (+10%) | 7mo | $265,000 | $204 | 70 |
| 65 Frederick Ave | 0.53mi | 3/1.0 | 1,168 (-1%) | 7mo | $350,000 | $300 | 65 |
| 5 Lockrow Blvd | 0.51mi | 3/1.0 | 1,127 (-5%) | 4mo | $135,000 | $120 | 63 |
| 15 Braintree St | 0.54mi | 3/1.0 | 1,080 (-9%) | 1mo | $270,000 | $250 | 58 |
| 28 Rooney Ave | 0.32mi | 3/1.0 | 1,014 (-14%) | 2mo | $252,000 | $249 | 57 |
| 4 Frost Pl | 0.67mi | 4/1.0 (+1) | 1,162 (-2%) | 6mo | $249,000 | $214 | 54 |
| 21 Tremont St | 0.73mi | 3/2.0 | 1,133 (-4%) | 5mo | $170,000 | $150 | 53 |
| 38 Grounds Pl | 0.64mi | 3/1.0 | 1,050 (-11%) | 6mo | $325,000 | $310 | 45 |
Match score weights: distance 35% · size 25% · config 20% · recency 20%. Top-matched comps best support the ARV.
Projected returns pro-forma
-3.0% appreciation · 3.0% rent growth · sell at horizon
- IRR
- 0.7%
- Equity multiple
- 1.03×
- Total profit
- $1,255
- Equity at exit
- $26,093
- IRR
- 10.3%
- Equity multiple
- 1.81×
- Total profit
- $39,456
- Equity at exit
- $15,131
Cash invested: $49,000 (down + closing). Projections, not guarantees.
Landlord ↔ Tenant lean methodology
- Overall (STATE)
- 15 Strongly Tenant-Friendly
- State New York
- 15 Strongly Tenant-Friendly · D+10
- County
- — inherits STATE
- City
- — inherits STATE
ZIP-level market 12205
- Active inventory
- 105
- Price-to-rent
- 6.6×
Monthly cashflow live
- Estimated rent
- $2,221 high interval (Pro) →
- Mortgage (P&I)
- −$918
- Tax from tax record
- −$301 /mo · $3,608/yr
- Insurance
- −$73
- HOA
- −$0
- Vacancy / Maint / Mgmt
- −$466
- Net cashflow
- $464
Break-even live
Sensitivity live
| Price | -10% $563 | -5% $513 | +0% $464 | +5% $414 | +10% $365 |
|---|---|---|---|---|---|
| Rent | -10% $288 | -5% $376 | +0% $464 | +5% $551 | +10% $639 |
| Rate | -1.0pp $552 | -0.5pp $508 | base $464 | +0.5pp $418 | +1.0pp $372 |
UW: 25.0% down · 7.5% · 30yr · 1.5% tax · 5.0% vac · 8.0% maint · 8.0% mgmt
Financing live
Cash to close
- Down payment
- $43,750
- Closing costs
- $5,250
- Reserves months
- —
- Total cash needed
- —
Loan-product check · same deal, 3 products live
Conventional
25% down · 7.5% · 30yr
- Down + closing
- —
- Monthly P&I
- —
- Monthly cashflow
- —
- DSCR
- —
- Eligible?
- —
Personal DTI + credit; lowest rate.
DSCR
20% down · 8.5% · 30yr
- Down + closing
- —
- Monthly P&I
- —
- Monthly cashflow
- —
- DSCR
- —
- Eligible?
- —
No personal income docs; deal must DSCR.
Hard money
10% down · 12.0% · 12mo
- Down + closing
- —
- Monthly P&I
- —
- Monthly cashflow
- —
- DSCR
- —
- Eligible?
- —
Short-term bridge; refi at stabilization.
Rent comps 16 comps
| Address | Beds | Baths | Sqft | Rent | $/sqft | DOM | Units | Dist |
|---|---|---|---|---|---|---|---|---|
| 14 Woodside Ave Albany, NY | 4.0 | 3.0 | 1248 | $2,700 | $2.16 | 45d | 1 | 0.06mi |
| 14 Orford St Unit 1 1s Albany, NY | 2.0 | 1.0 | 800 | $1,700 | $2.12 | 16d | 1 | 0.27mi |
| 8 Norton St Albany, NY | 2.0 | 1.0 | 1100 | $1,695 | $1.54 | 16d | 1 | 0.32mi |
| 8 Norton St Trlr 10 Albany, NY | 2.0 | 1.0 | 1100 | $1,695 | $1.54 | 25d | 1 | 0.32mi |
| 11 Brayton St Albany, NY | 3.0 | 1.5 | 1414 | $1,950 | $1.38 | 23d | 1 | 0.44mi |
| 50 Rooney Ave Albany, NY | 2.0 | 1.0 | 714 | $2,000 | $2.80 | 45d | 1 | 0.44mi |
| 34 B Commodore St Colonie, NY | 3.0 | 1.5 | 1200 | $2,200 | $1.83 | 16d | 1 | 0.57mi |
| 2 Van Buren Ave Albany, NY | 3.0 | 1.0 | 1500 | $2,350 | $1.57 | 45d | 1 | 0.66mi |
| 255 Patroon Creek Blvd Albany, NY | 1.0–3.0 | 1.0–2.0 | 1080 | $2,559 | $2.37 | 16d | 22 | 0.66mi |
| 35 Cherry St Apt B Albany, NY | 2.0 | 1.0 | 1400 | $1,800 | $1.29 | 45d | 1 | 0.70mi |
| 12 California Ave Albany, NY | 2.0 | 1.0 | 685 | $1,825 | $2.66 | 16d | 1 | 0.88mi |
| 33 A Ledgewood Dr Colonie, NY | 2.0 | 1.5 | 1300 | $2,100 | $1.62 | 16d | 1 | 1.18mi |
| 41 Oakwood Dr Albany, NY | 2.0 | 1.0 | 1008 | $2,600 | $2.58 | 45d | 1 | 1.30mi |
| 41 Oakwood Dr Albany, NY | 2.0 | 1.0 | 1008 | $2,600 | $2.58 | 25d | 1 | 1.30mi |
| 420 Sand Creek Rd Albany, NY | 1.0–2.0 | 1.0 | 720 | $1,755 | $2.44 | 16d | 1 | 1.37mi |
| 32 Richmond St Unit 2 Albany, NY | 3.0 | 3.0 | 1248 | $2,500 | $2.00 | 16d | 1 | 1.41mi |
Listing history 7 events
-
2026-05-12$175,000 Active 275-char remark
-
2013-06-26soldstatus $155,000
-
2013-06-19soldstatus $154,760 243-char remark
Show marketing remark (243 chars)
REDUCED! Owner recently updated this 3BR, 1.5BA Colonie Bungalow. Updated Kitchen, New Bath, HW Floors & freshly painted throughout! Huge 2nd floor Master BR. Fenced in yard on a landscaped lot. Low South Colonie Taxes. Excellent Condition
-
2013-03-23historical 243-char remark
Show marketing remark (243 chars)
REDUCED! Owner recently updated this 3BR, 1.5BA Colonie Bungalow. Updated Kitchen, New Bath, HW Floors & freshly painted throughout! Huge 2nd floor Master BR. Fenced in yard on a landscaped lot. Low South Colonie Taxes. Excellent Condition
-
2012-12-17$149,900 243-char remark
Show marketing remark (243 chars)
REDUCED! Owner recently updated this 3BR, 1.5BA Colonie Bungalow. Updated Kitchen, New Bath, HW Floors & freshly painted throughout! Huge 2nd floor Master BR. Fenced in yard on a landscaped lot. Low South Colonie Taxes. Excellent Condition
-
2011-10-24historical
-
2011-02-18$154,900
ⓘ Source: listings_history table (triggers on properties + properties_extension) + one-shot
backfill from property_details.listing_events for pre-trigger history.
Tax reassessment forecast NY · Partial reset (capped growth)
- Current annual tax
- $3,608 · $301/mo
- Projected year-2 tax
- $3,608 · $301/mo
- Expected delta
- $0/yr ($0/mo · 0.0%)
ⓘ Screening estimate from a state-policy table — verify with the county assessor before closing.
Climate risk First Street
- Flood 4/10 Moderate FEMA zone X (unshaded) · 21% chance over 30 yrs
- Wildfire 1/10 Low
- Heat 4/10 Moderate 7 d/yr ≥96°F today · 16 d/yr by 30 yrs out
- Wind 3/10 Moderate 6% chance of damaging wind over 30 yrs
- Air quality 1/10 Low 0 unhealthy d/yr today · 0 by 30 yrs out
Nearby sold comps map
Loading sold comps map…
Walkable amenities ~0.75 mi
Loading nearby amenities…
Taxation est. · year 1
- Rental income
- $26,657
- − Mortgage interest
- −$9,803
- − Property taxes
- −$3,608
- − Insurance
- −$875
- − Repairs & maintenance
- −$2,133
- − Management
- −$2,133
- − Depreciation
- −$5,091
- Taxable income
- $3,015
- Est. tax owed @ 24.0%
- −$724
- After-tax cash flow
- $4,840/yr
For passive investors: Depreciation is non-cash, so a rental often shows a tax loss while cash-flowing — sheltering income. Rental losses are passive: they offset passive income freely, and up to $25,000/yr can offset ordinary (W-2) income if you actively participate and your MAGI is under $100k (phasing out to $0 by $150k); unused losses carry forward. On sale, claimed depreciation is recaptured at up to 25%, and gains may owe capital-gains tax (a 1031 exchange can defer both). Figures are a year-1 estimate at your 24.0% rate — not tax advice; consult a CPA.
Schools (NCES district)
- District
- South Colonie Central School District
- NCES district ID
- 3627210
- Math proficiency
- 63% ▼ -1.00%
- Reading proficiency
- 57% ▲ 4.00%
- Median HH income
- $69,499
- Composite
- 52.97/100
- National rank
- #1527
- State rank
- #215 of 590 in NY
Livability — Roessleville
No livability data for this city. (Only ~50 U.S. cities are tracked.)
Census & demographics
- Census place
- Roessleville, NY
- County
- Albany County · 196,626 people
- Metro
- Albany-Schenectady-Troy, NY
- Population (ZIP)
- 25,838
- Household income
- $91,020
- Rent vs Own
- Severe rent burden
- 530.0
Population outlook (Albany County) Hauer SSP2
- Today (2025)
- 320,794 people
- By 2030
- 327,401 · +2.1%
- By 2040
- 338,218 · +5.4%
- By 2050
- 348,467 · +8.6%
- By 2075
- 381,693 · +19.0%
- By 2100
- 393,809 · +22.8%
Race, ethnicity, and origin ACS 2023
- Neighborhood character
- Predominantly White (73%)
- Race & ethnicity
- White 73% Asian 8% Black 8% Two or more races 6% Hispanic / Latino 5%
- Hispanic origin (detail)
- Puerto Rican 3%
- Common ancestry
- Romanian 6% Lithuanian 3% Iranian 2%
- Foreign-born
- 13% · Canada, China, Vietnam
- Languages at home
- 84% English-only · Other Indo-European 4% Russian/Polish/Slavic 3% Tagalog/Filipino 2%
Political lean MEDSL · Albany
- 2024 margin
- Strong D (+25.8) · D 62.9% · R 37.1%
- 2008→2024 swing
- -3.6pp toward R · 2008: 29.4pp · 2024: 25.8pp
- All cycles
- 2024: D+25.8 2020: D+31.4 2016: D+24.3 2012: D+31.0 2008: D+29.4
Not yet ingested
- Civics
- —
Market trends
- HPI YoY
- ▼ -182.10%
- Current HPI
- 302.9752
- Rent YoY
- —
- Metro
- Albany-Schenectady-Troy, NY
- State GDP YoY
- ▲ 2.60%
- F500 in state
- 92
Industry mix (Fortune 500 HQ in NY)
| Industry | F500 HQs | Revenue |
|---|---|---|
| Financial Services | 10 | $950B |
|
||
| Consumer Goods | 9 | $162B |
|
||
| Insurance | 4 | $225B |
|
||
| Telecommunications | 2 | $144B |
|
||
| Pharmaceuticals | 2 | $112B |
|
||
| Media / Entertainment | 2 | $69B |
|
||
Price history
+0.1% since first listed6 events — show timeline
- 2013-06-26 Sold (Public Records) $155,000 Public Records
- 2013-06-19 Sold (MLS) $154,760 Global MLS
- 2013-03-23 Listing Removed — Global MLS
- 2012-12-17 Listed $149,900 Global MLS
- 2011-10-24 Listing Removed — Global MLS
- 2011-02-18 Listed $154,900 Global MLS
Property tax history
+2.6%/yrLatest (2025): $3,608 · -3.6% YoY. Source: county tax records.
Cash-flow waterfall
monthlySold comps — $/sqft
last 12 mo · ≤1 miLoading sold comps…