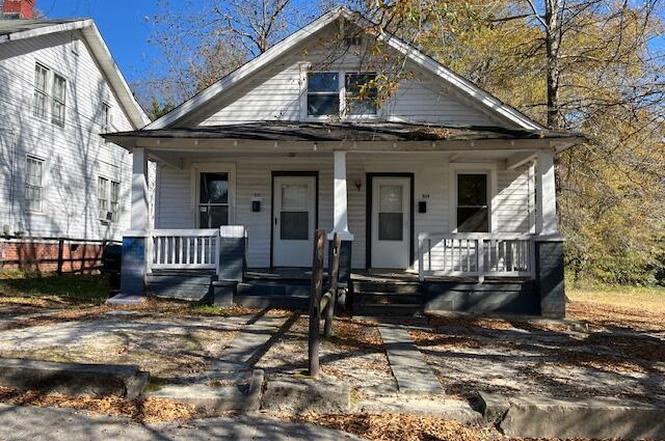
311 Arch St · Henderson, NC
Flood risk 1/10 · Minimal
- FEMA flood zone
- X (unshaded)
- Chance of flooding over 30 yrs
- 0.0%
- Est. flood insurance / yr
- $507 – $1,088
Fire risk 3/10 · Minor
- Est. fire insurance / yr
- $906 – $1,684
Heat risk 6/10 · Moderate
- Hot days now (above 104°F)
- 7 days/yr
- Hot days in 30 yrs
- 17 days/yr
Wind risk 6/10 · Moderate
- Chance of severe wind over 30 yrs
- 41.0%
Air-quality risk 1/10 · Minimal
- Unhealthy air days now
- 0 days/yr
- Unhealthy air days in 30 yrs
- 0 days/yr
Risk factors via First Street. Map © Google.
Why this score? — see what drove the C- grade
The composite is a weighted blend of 9 inputs, each scored 0–100. Each bar is that input's sub-score; the figure is the points it added to the 100-point composite (weight × sub-score).
- Cash flow +23.8/30.0
- DSCR +7.7/10.0
- ARV discount +7.5/15.0
- 1% rule +5.5/10.0
- Livability +2.9/5.0
- Rent growth +2.5/5.0
- Condition / age +2.5/5.0
- Schools +1.9/10.0
- Appreciation +0.0/10.0
$125,000
🖨 Deal sheet (PDF) 📄 Offer letter ✓ Due diligence
Listing remarks
Duplex, 311 Arch: Ocupied, Main floor- LR, BR. kitchen, gas upright wall heater & Upstairs- 25'x14 open room, full bath, no heat, renting @ $475/month. 313 Arch: (Vacant) LR BR, multipurpose room, kitchen, full bath, carpet/vinyl floors, electric wall heater, ready for occupancy.
Key facts
- 2 parking spots
- Built 1950
- Listed 193 days
Property features AI
Finance
- Financial info: 4 total units; Owner pays: none
- HOA & community: No association
Exterior
- Parking: On-site and on-street parking; 2 open parking spaces
- Utilities: Public water; Public sewer; Electric and natural gas service
- Home design: Duplex; One and one-half stories; Frame construction
- Construction: Frame construction; Block foundation; Asphalt roof; Built as a duplex
- Exterior features: Lot approximately 0.14 acres (about 48 x 125); Public-maintained road access
Interior
- Bedrooms: 4 bedrooms
- Flooring: Carpet; Vinyl
- Bathrooms: 2 full bathrooms
- Heating & cooling: Electric heating; Natural gas heating; Space heaters; Separate meters for utilities; No cooling
- Interior features: Carpet and vinyl flooring
Neighborhood map
What this means for you Summary
Snapshot
- This is a 4-bed/2.0-bath townhouse listed at $125k.
Deal economics
- At list price, monthly cash flow is $241 ($3k/yr) — positive.
- The deal already cash-flows at list — no discount required.
- Meets the 1% rule at list price ($1k rent vs $125k).
- Recommended offer: $110k (12.0% below list) — sets the bar for market timing.
- Cap rate 8.6% vs local median 4.3% in Henderson — top-decile yield for the area; either an underpriced asset or a hidden risk that comps aren't pricing in. Stress-test before assuming the spread holds.
Location & tenants
- Location reads 58/100 on livability (#583 in NC) — a working-class tenant base; expect higher turnover. Strengths: cost of living A+, health & safety A+, housing B; Watch: crime F, amenities F, commute F.
- Vance County Schools (rural): math 20% / reading 27% proficiency, ranked #166 of 178 in NC (top 93%) — low school quality limits family demand, transient renter base, plan for 1-2y turnover; 81% free/reduced lunch — lower-income household profile, screen leases tightly.
- Zoned schools: Vance County Middle School (math 13% / reading 17%, grade F, #459 of 475 statewide, top 97%, 797 students, 100% FRL); Vance County High School (math 12% / reading 27%, grade F, #499 of 535 statewide, top 94%, 958 students, 100% FRL) — zoned schools average 100% FRL vs 81% district-wide (19 pts higher); higher-poverty schools than district average — tighter screening recommended.
- Market conditions: 115 active listings in the ZIP; 9 comparable units currently listed for rent nearby; rentals at typical pace (median 25d on market — plan ~3-4 weeks tenant-placement turnaround); lower-income renter base — watch delinquency; 73 units permitted in Vance County in 2024 (0 in 5+ unit buildings).
- This rent runs 39% of the median local income ($40k/yr) — at the standard rent-burdened threshold; future hikes will face affordability resistance.
Forward outlook
- Local home prices are declining (-3.0%/yr); year-one equity from $864 of loan paydown is wiped out by about $4k of value loss. Plan a longer hold.
- Vance County population projected at -23% by 2050 — secular population decline; favor cash flow + early exit over multi-decade hold.
Negotiation context
- It's been on market 194 days — a 12% lower offer ($110k) is reasonable based on typical stale-listing flexibility.
Risks & watch-outs
- Watch-outs: built in 1950 — expect roof / HVAC / electrical / plumbing capex.
- Climate carrying-cost: major wind risk, 41% chance of damaging wind over 30y; extreme-heat days projected 7→17/yr by 2055 (HVAC capex compounding) — expect insurance premiums to compound above CPI over the hold.
Questions for the listing agent
- It's been on market 194 days. Have you received any prior offers? Is the seller open to a 12% concession, seller financing, or rate buy-down credit?
- Built in 1950 — when were the roof, HVAC, electrical panel, plumbing, and water heater last replaced?
- Why hasn't it sold? Are there any deal-killer items the seller is aware of (foundation, flood, title, zoning, code violations)?
- Is there a deadline driving the sale (1031 exchange, divorce, estate, relocation)? That informs how much negotiation room exists.
- Schools are F-rated, which usually means shorter tenancies and higher turnover. Who's the typical renter profile here, and what's been the actual vacancy rate?
- Crime grade is F in this area — have there been break-ins, vandalism, or insurance claims at this property in the last 3 years? What carrier currently insures it and at what premium?
- What's the average days-on-market for RENTAL listings here right now (not sales)? A rising rental-DOM trend means longer vacancies and softer asking-rent achievability than the comps imply.
- What's the recent tenant-quality profile in this submarket — average credit score on applications, eviction rate, late-payment / NSF rate, and stable-employment percentage? A property-management company in the area should have these aggregated.
- How much new for-sale + rental construction is in the pipeline within 1–3 miles? Heavy new supply typically softens prices + rents 12–24 months out; constrained supply supports both.
Investment metrics
- 1% rule
- 1.05% ✓
- Cap rate
- 8.61%
- Cash-on-cash
- 8.26%
- DSCR
- 1.37
- GRM
- 8.0
CMA / ARV
No comps found within radius.
Projected returns pro-forma
-3.0% appreciation · 3.0% rent growth · sell at horizon
- IRR
- -3.8%
- Equity multiple
- 0.86×
- Total profit
- $-4,938
- Equity at exit
- $18,638
- IRR
- 5.9%
- Equity multiple
- 1.44×
- Total profit
- $15,356
- Equity at exit
- $10,808
Cash invested: $35,000 (down + closing). Projections, not guarantees.
Landlord ↔ Tenant lean methodology
- Overall (STATE)
- 85 Strongly Landlord-Friendly
- State North Carolina
- 85 Strongly Landlord-Friendly · R+3
- County
- — inherits STATE
- City
- — inherits STATE
ZIP-level market 27536
- Active inventory
- 115
- Price-to-rent
- 8.0×
Monthly cashflow live
- Estimated rent
- $1,308 high interval (Pro) →
- Mortgage (P&I)
- −$656
- Tax from tax record
- −$85 /mo · $1,015/yr
- Insurance
- −$52
- HOA
- −$0
- Vacancy / Maint / Mgmt
- −$275
- Net cashflow
- $241
Break-even live
Sensitivity live
| Price | -10% $312 | -5% $276 | +0% $241 | +5% $205 | +10% $170 |
|---|---|---|---|---|---|
| Rent | -10% $138 | -5% $189 | +0% $241 | +5% $293 | +10% $344 |
| Rate | -1.0pp $304 | -0.5pp $273 | base $241 | +0.5pp $208 | +1.0pp $176 |
UW: 25.0% down · 7.5% · 30yr · 1.5% tax · 5.0% vac · 8.0% maint · 8.0% mgmt
Financing live
Cash to close
- Down payment
- $31,250
- Closing costs
- $3,750
- Reserves months
- —
- Total cash needed
- —
Loan-product check · same deal, 3 products live
Conventional
25% down · 7.5% · 30yr
- Down + closing
- —
- Monthly P&I
- —
- Monthly cashflow
- —
- DSCR
- —
- Eligible?
- —
Personal DTI + credit; lowest rate.
DSCR
20% down · 8.5% · 30yr
- Down + closing
- —
- Monthly P&I
- —
- Monthly cashflow
- —
- DSCR
- —
- Eligible?
- —
No personal income docs; deal must DSCR.
Hard money
10% down · 12.0% · 12mo
- Down + closing
- —
- Monthly P&I
- —
- Monthly cashflow
- —
- DSCR
- —
- Eligible?
- —
Short-term bridge; refi at stabilization.
Rent comps 9 comps
| Address | Beds | Baths | Sqft | Rent | $/sqft | DOM | Units | Dist |
|---|---|---|---|---|---|---|---|---|
| 913 Lehman St Henderson, NC | 3.0 | 1.0 | 966 | $795 | $0.82 | 25d | 1 | 0.36mi |
| 434 Owen St Henderson, NC | 3.0 | 1.5 | 1154 | $795 | $0.69 | 17d | 1 | 0.38mi |
| 515 Owen St Henderson, NC | 4.0 | 2.0 | 920 | $925 | $1.01 | 25d | 1 | 0.42mi |
| 312 E Andrews Ave Henderson, NC | 4.0 | 1.0 | 1719 | $2,500 | $1.45 | 5d | 1 | 0.55mi |
| 726 E Andrews Ave Henderson, NC | 3.0 | 2.0 | 1068 | $795 | $0.74 | 25d | 1 | 0.65mi |
| 210 Corbitt Rd Unit 220 Henderson, NC | 3.0 | 2.5 | 1606 | $1,450 | $0.90 | 25d | 1 | 0.71mi |
| 1637 Berry Ave Henderson, NC | 3.0 | 2.5 | 1396 | $1,850 | $1.33 | 13d | 1 | 0.96mi |
| 943 Patton Cir Henderson, NC | 3.0 | 2.0 | 1200 | $1,499 | $1.25 | 22d | 1 | 1.09mi |
| 229 Lowry St Henderson, NC | 3.0 | 1.0 | 1578 | $1,500 | $0.95 | 25d | 1 | 1.14mi |
Listing history 15 events
-
2026-06-21days on market $125,000 Active 194 DOM
-
2026-06-18days on market $125,000 Active 191 DOM
-
2026-06-17days on market $125,000 Active 190 DOM
-
2026-06-16days on market $125,000 Active 189 DOM
-
2026-06-15days on market $125,000 Active 188 DOM
-
2026-06-13days on market $125,000 Active 186 DOM
-
2026-06-09days on market $125,000 Active 182 DOM
-
2026-06-08days on market $125,000 Active 181 DOM
-
2026-06-07days on market $125,000 Active 180 DOM
-
2026-06-03days on market $125,000 Active 176 DOM
-
2026-06-02days on market $125,000 Active 175 DOM
-
2026-06-01days on market $125,000 Active 174 DOM
-
2026-05-31days on market $125,000 Active 173 DOM
-
2026-04-07price $125,000
-
2025-12-08$150,000 Active
ⓘ Source: listings_history table (triggers on properties + properties_extension) + one-shot
backfill from property_details.listing_events for pre-trigger history.
Tax reassessment forecast NC · Resets to sale price
- Current annual tax
- $1,015 · $85/mo
- Projected year-2 tax
- $1,025 · $85/mo
- Expected delta
- +$10/yr (+$1/mo · 1.0%)
ⓘ Screening estimate from a state-policy table — verify with the county assessor before closing.
Climate risk First Street
- Flood 1/10 Low FEMA zone X (unshaded) · 0% chance over 30 yrs
- Wildfire 3/10 Moderate
- Heat 6/10 Major 7 d/yr ≥104°F today · 17 d/yr by 30 yrs out
- Wind 6/10 Major 41% chance of damaging wind over 30 yrs
- Air quality 1/10 Low 0 unhealthy d/yr today · 0 by 30 yrs out
Nearby sold comps map
Loading sold comps map…
Walkable amenities ~0.75 mi
Loading nearby amenities…
Taxation est. · year 1
- Rental income
- $15,692
- − Mortgage interest
- −$7,002
- − Property taxes
- −$1,015
- − Insurance
- −$625
- − Repairs & maintenance
- −$1,255
- − Management
- −$1,255
- − Depreciation
- −$3,636
- Taxable income
- $903
- Est. tax owed @ 24.0%
- −$217
- After-tax cash flow
- $2,674/yr
For passive investors: Depreciation is non-cash, so a rental often shows a tax loss while cash-flowing — sheltering income. Rental losses are passive: they offset passive income freely, and up to $25,000/yr can offset ordinary (W-2) income if you actively participate and your MAGI is under $100k (phasing out to $0 by $150k); unused losses carry forward. On sale, claimed depreciation is recaptured at up to 25%, and gains may owe capital-gains tax (a 1031 exchange can defer both). Figures are a year-1 estimate at your 24.0% rate — not tax advice; consult a CPA.
Schools (NCES district)
- District
- Vance County Schools
- NCES district ID
- 3704650
- Math proficiency
- 20% ▼ -7.00%
- Reading proficiency
- 27% ▼ -5.00%
- Median HH income
- $34,323
- Composite
- 19.29/100
- National rank
- #8801
- State rank
- #166 of 178 in NC
Livability — Henderson
- Score
- 58/100
- State rank
- #583
- US rank
- #21468
Category grades
Schools grade is shown separately in the Schools card above.
Census & demographics
- Census place
- Henderson, NC
- County
- Vance County · 15,298 people
- City population
- 15,298
- Metro
- Henderson, NC
- Population (ZIP)
- 15,298
- Household income
- $39,985
- Rent vs Own
- Severe rent burden
- 1110.0
Population outlook (Vance County) Hauer SSP2
- Today (2025)
- 41,985 people
- By 2030
- 40,286 · -4.0%
- By 2040
- 36,372 · -13.4%
- By 2050
- 32,466 · -22.7%
- By 2075
- 24,229 · -42.3%
- By 2100
- 17,784 · -57.6%
Race, ethnicity, and origin ACS 2023
- Neighborhood character
- Diverse neighborhood (Simpson 0.56)
- Race & ethnicity
- Black 60% White 26% Hispanic / Latino 12% Two or more races 5%
- Hispanic origin (detail)
- Mexican 9%
- Common ancestry
- Serbian 1% Italian 1% Iranian 1%
- Foreign-born
- 6% · Canada
- Languages at home
- 91% English-only · Spanish 6% Arabic 1% French/Haitian/Cajun 1%
Political lean MEDSL · Vance
- 2024 margin
- D (+13.3) · D 56.3% · R 42.9%
- 2008→2024 swing
- -13.3pp toward R · 2008: 26.6pp · 2024: 13.3pp
- All cycles
- 2024: D+13.3 2020: D+19.2 2016: D+24.6 2012: D+28.3 2008: D+26.6
Not yet ingested
- Civics
- —
Market trends
- HPI YoY
- ▼ -122.23%
- Current HPI
- 198.8762
- Rent YoY
- —
- Metro
- Henderson, NC
- State GDP YoY
- ▲ 3.28%
- F500 in state
- 26
Industry mix (Fortune 500 HQ in NC)
| Industry | F500 HQs | Revenue |
|---|---|---|
| Financial Services | 2 | $213B |
|
||
| Retail | 2 | $95B |
|
||
| Industrial Conglomerate | 1 | $38B |
|
||
| Metals / Steel | 1 | $35B |
|
||
| Utilities | 1 | $30B |
|
||
| Industrial Machinery | 1 | $19B |
|
||
Price history
-16.7% since first listed2 events — show timeline
- 2026-04-07 Price Changed $125,000 TMLS
- 2025-12-08 Listed $150,000 TMLS
Property tax history
+8.9%/yrLatest (2025): $1,015 · +2.1% YoY. Source: county tax records.
Cash-flow waterfall
monthlySold comps — $/sqft
last 12 mo · ≤1 miLoading sold comps…