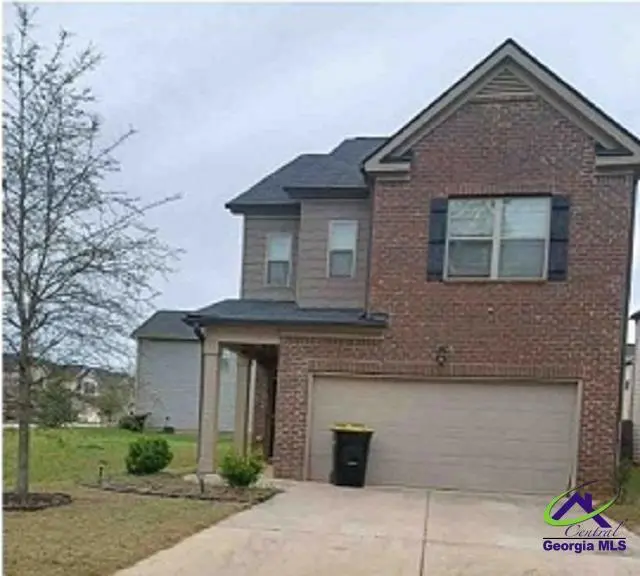
11740 Lovejoy Crossing Blvd · Lovejoy, GA
Flood risk 1/10 · Minimal
- FEMA flood zone
- X (unshaded)
- Chance of flooding over 30 yrs
- 0.0%
- Est. flood insurance / yr
- $507 – $1,088
Fire risk 2/10 · Minimal
- Est. fire insurance / yr
- $963 – $1,789
Heat risk 6/10 · Moderate
- Hot days now (above 105°F)
- 7 days/yr
- Hot days in 30 yrs
- 19 days/yr
Wind risk 6/10 · Moderate
- Chance of severe wind over 30 yrs
- 27.0%
Air-quality risk 4/10 · Minor
- Unhealthy air days now
- 4 days/yr
- Unhealthy air days in 30 yrs
- 5 days/yr
Risk factors via First Street. Map © Google.
Why this score? — see what drove the C grade
The composite is a weighted blend of 9 inputs, each scored 0–100. Each bar is that input's sub-score; the figure is the points it added to the 100-point composite (weight × sub-score).
- Cash flow +18.8/30.0
- ARV discount +15.0/15.0
- DSCR +5.9/10.0
- 1% rule +5.8/10.0
- Rent growth +3.1/5.0
- Livability +3.1/5.0
- Condition / age +2.5/5.0
- Schools +1.3/10.0
- Appreciation +0.0/10.0
$192,200
🖨 Deal sheet (PDF) 📄 Offer letter ✓ Due diligence
Listing remarks
Offers to be placed on Xome.com. Interior inspections are not available, do not trespass! Forward all inquiries and questions to Xome Customer Service. NO REPRESENTATION TO VALIDITY OF INFORMATION IS MADE, BUYER TO VERIFY ALL INFORMATION WHERIN.
Key facts
- 3,920 sq ft lot
- 2 garage spots
- Built 2020
Property features AI
Exterior
- Parking: 2 total parking spaces; 2 covered parking spaces; 2-car garage
- Utilities: Sewer: unknown
- Home design: Single-family residence; Residential property
- Construction: Slab foundation; Above-grade finished area approximately 1,985
- Exterior features: No pool
Interior
- Bathrooms: 2 full bathrooms; 1 half bathroom
- Heating & cooling: Heating available (see remarks)
- Interior features: Heating present (details: see remarks)
Neighborhood map
What this means for you Summary
Snapshot
- This is a 3-bed/2.0-bath single-family listed at $192k.
Deal economics
- At list price, monthly cash flow is $195 ($2k/yr) — positive.
- The deal already cash-flows at list — no discount required.
- Meets the 1% rule at list price ($2k rent vs $192k).
- Cap rate 7.5% vs local median 4.4% in Lovejoy — top-decile yield for the area; either an underpriced asset or a hidden risk that comps aren't pricing in. Stress-test before assuming the spread holds.
Location & tenants
- Location reads 62/100 on livability (#317 in GA) — a middle-class / working-renter tenant base. Strengths: cost of living A+, housing A+; Watch: employment C-, amenities F, commute F.
- Clayton County (suburban): math 11% / reading 20% proficiency, ranked #155 of 174 in GA (top 89%) — low school quality limits family demand, transient renter base, plan for 1-2y turnover; 78% free/reduced lunch — lower-income household profile, screen leases tightly.
- Zoned schools: Eddie White Middle School (math 8% / reading 22%, grade F, #399 of 470 statewide, top 86%, 1,438 students, 90% FRL); Lovejoy High School (math 7% / reading 8%, grade F, #378 of 424 statewide, top 91%, 2,136 students, 90% FRL).
- Market conditions: Rents rising (+2.2%/yr); 561 active listings in the ZIP; 29 comparable units currently listed for rent nearby; rentals at typical pace (median 27d on market — plan ~3-4 weeks tenant-placement turnaround); solid renter incomes; 865 units permitted in Clayton County in 2024 (448 in 5+ unit buildings).
- This rent runs 30% of the median local income ($83k/yr) — at the standard rent-burdened threshold; future hikes will face affordability resistance.
Forward outlook
- Local home prices are declining (-3.0%/yr); year-one equity from $1k of loan paydown is wiped out by about $6k of value loss. Plan a longer hold.
- Clayton County population projected at +29% by 2050 — long-run rental-demand tailwind backs the buy-and-hold thesis.
Negotiation context
- Only 11 days on market — expect competitive offers; lowballing is unlikely to land.
- 6 sale attempts since 7y ago with the ask held roughly flat each time — persistent listings suggest the price (not the market) is what's stuck; bring a comps-based counter.
Risks & watch-outs
- Climate carrying-cost: major wind risk, 27% chance of damaging wind over 30y; extreme-heat days projected 7→19/yr by 2055 (HVAC capex compounding) — expect insurance premiums to compound above CPI over the hold.
Questions for the listing agent
- Is there a deadline driving the sale (1031 exchange, divorce, estate, relocation)? That informs how much negotiation room exists.
- Schools are F-rated, which usually means shorter tenancies and higher turnover. Who's the typical renter profile here, and what's been the actual vacancy rate?
- What's the average days-on-market for RENTAL listings here right now (not sales)? A rising rental-DOM trend means longer vacancies and softer asking-rent achievability than the comps imply.
- What's the recent tenant-quality profile in this submarket — average credit score on applications, eviction rate, late-payment / NSF rate, and stable-employment percentage? A property-management company in the area should have these aggregated.
- How much new for-sale + rental construction is in the pipeline within 1–3 miles? Heavy new supply typically softens prices + rents 12–24 months out; constrained supply supports both.
Investment metrics
- 1% rule
- 1.08% ✓
- Cap rate
- 7.51%
- Cash-on-cash
- 4.35%
- DSCR
- 1.19
- GRM
- 7.7
CMA / ARV
- ARV (on-the-fly)
- $299,886
- Comps found
- 12
Show comp detail 12 sales within ~0.75 mi
| Address | Dist | Beds/Ba | Sqft | Sold | Price | $/sf | Match |
|---|---|---|---|---|---|---|---|
| 11911 Lovejoy Crossing Way | 0.10mi | 3/2.5 | 1,990 (+0%) | 3mo | $293,000 | $147 | 91 |
| 11765 Lovejoy Crossing Blvd | 0.06mi | 3/2.5 | 1,872 (-6%) | 5mo | $267,500 | $143 | 82 |
| 11860 Lovejoy Crossing Blvd | 0.14mi | 3/2.5 | 1,872 (-6%) | 5mo | $275,000 | $147 | 78 |
| 2598 Lovejoy Crossing Trl | 0.19mi | 3/2.5 | 2,040 (+3%) | 10mo | $264,950 | $130 | 76 |
| 11909 Lovejoy Crossing Blvd | 0.19mi | 3/2.5 | 1,794 (-10%) | 1mo | $270,000 | $151 | 72 |
| 12093 Conrad Cir | 0.66mi | 3/3.0 | 2,001 (+1%) | 6mo | $340,575 | $170 | 59 |
| 12079 Conrad Cir | 0.66mi | 4/2.5 (+1) | 2,003 (+1%) | 3mo | $327,545 | $164 | 58 |
| 11929 Aukerman Way | 0.73mi | 4/2.5 (+1) | 2,017 (+2%) | 3mo | $332,990 | $165 | 54 |
| 2275 Church St | 0.70mi | 4/2.5 (+1) | 1,963 (-1%) | 6mo | $295,000 | $150 | 53 |
| 11899 Aukerman Way | 0.74mi | 4/2.5 (+1) | 2,017 (+2%) | 10mo | $324,990 | $161 | 48 |
| 2317 Church St | 0.70mi | 4/2.5 (+1) | 1,883 (-5%) | 8mo | $294,000 | $156 | 45 |
| 2354 Hamilton St | 0.67mi | 2/2.0 (-1) | 1,729 (-13%) | 10mo | $180,000 | $104 | 34 |
Match score weights: distance 35% · size 25% · config 20% · recency 20%. Top-matched comps best support the ARV.
Projected returns pro-forma
-3.0% appreciation · 2.2% rent growth · sell at horizon
- IRR
- -10.4%
- Equity multiple
- 0.62×
- Total profit
- $-20,273
- Equity at exit
- $28,658
- IRR
- -2.3%
- Equity multiple
- 0.85×
- Total profit
- $-7,925
- Equity at exit
- $16,618
Cash invested: $53,816 (down + closing). Projections, not guarantees.
Landlord ↔ Tenant lean methodology
- Overall (STATE)
- 90 Strongly Landlord-Friendly
- State Georgia
- 90 Strongly Landlord-Friendly · R+3
- County
- — inherits STATE
- City
- — inherits STATE
ZIP-level market 30228
- Home prices YoY
- -24.3%
- Rents YoY
- 2.2%
- Active inventory
- 561
- Price-to-rent
- 7.7×
Monthly cashflow live
- Estimated rent
- $2,074 high interval (Pro) →
- Mortgage (P&I)
- −$1,008
- Tax from tax record
- −$356 /mo · $4,266/yr
- Insurance
- −$80
- HOA
- −$0
- Vacancy / Maint / Mgmt
- −$436
- Net cashflow
- $195
Break-even live
Sensitivity live
| Price | -10% $304 | -5% $250 | +0% $195 | +5% $141 | +10% $86 |
|---|---|---|---|---|---|
| Rent | -10% $31 | -5% $113 | +0% $195 | +5% $277 | +10% $359 |
| Rate | -1.0pp $292 | -0.5pp $244 | base $195 | +0.5pp $145 | +1.0pp $95 |
UW: 25.0% down · 7.5% · 30yr · 1.5% tax · 5.0% vac · 8.0% maint · 8.0% mgmt
Financing live
Cash to close
- Down payment
- $48,050
- Closing costs
- $5,766
- Reserves months
- —
- Total cash needed
- —
Loan-product check · same deal, 3 products live
Conventional
25% down · 7.5% · 30yr
- Down + closing
- —
- Monthly P&I
- —
- Monthly cashflow
- —
- DSCR
- —
- Eligible?
- —
Personal DTI + credit; lowest rate.
DSCR
20% down · 8.5% · 30yr
- Down + closing
- —
- Monthly P&I
- —
- Monthly cashflow
- —
- DSCR
- —
- Eligible?
- —
No personal income docs; deal must DSCR.
Hard money
10% down · 12.0% · 12mo
- Down + closing
- —
- Monthly P&I
- —
- Monthly cashflow
- —
- DSCR
- —
- Eligible?
- —
Short-term bridge; refi at stabilization.
Rent comps 29 comps
| Address | Beds | Baths | Sqft | Rent | $/sqft | DOM | Units | Dist |
|---|---|---|---|---|---|---|---|---|
| 11899 Conrad Cir Lovejoy, GA | 4.0 | 2.5 | 1966 | $2,300 | $1.17 | 6d | 1 | 0.71mi |
| 10938 Wheeler Trce Lovejoy, GA | 3.0 | 3.0 | 1692 | $1,879 | $1.11 | 46d | 1 | 0.79mi |
| 11688 Brightside Pkwy Lovejoy, GA | 4.0 | 2.5 | 2089 | $2,200 | $1.05 | 1d | 1 | 0.91mi |
| 12227 Tara Blvd Lovejoy, GA | 1.0–3.0 | 1.0–2.0 | 1179 | $1,913 | $1.62 | 0d | 14 | 0.96mi |
| 11940 Fuller St Lovejoy, GA | 3.0 | 2.5 | 1421 | $1,699 | $1.20 | 46d | 1 | 0.96mi |
| 11942 Fuller St Lovejoy, GA | 3.0 | 2.5 | 1421 | $1,639 | $1.15 | 46d | 1 | 0.96mi |
| 11877 Fuller St Lovejoy, GA | 3.0 | 2.5 | 1386 | $1,609 | $1.16 | 26d | 1 | 0.97mi |
| 11560 Winston Dr Lovejoy, GA | 3.0 | 3.0 | 1710 | $2,710 | $1.58 | 46d | 1 | 1.00mi |
| 221 Christopher Michael Ln Hampton, GA | 4.0 | 2.5 | 2370 | $2,480 | $1.05 | 13d | 1 | 1.08mi |
| 11722 Chatham Dr Hampton, GA | 3.0 | 2.5 | 1600 | $2,300 | $1.44 | 26d | 1 | 1.08mi |
| 11649 Mendenhall Ct Hampton, GA | 3.0 | 2.5 | 1568 | $2,300 | $1.47 | 23d | 1 | 1.10mi |
| 2257 Sugarleaf Trl Lovejoy, GA | 3.0 | 2.0 | 1624 | $1,775 | $1.09 | 46d | 1 | 1.12mi |
| 11523 Vinea Ln Lovejoy, GA | 3.0 | 2.0 | 1557 | $1,850 | $1.19 | 46d | 1 | 1.15mi |
| 2056 Registry Pl Lovejoy, GA | 3.0 | 2.0 | 1488 | $1,825 | $1.23 | 46d | 1 | 1.19mi |
| 2411 Brianna Dr Lovejoy, GA | 3.0 | 2.0 | 1432 | $1,826 | $1.28 | 5d | 1 | 1.21mi |
| 11866 Registry Blvd Unit 1 Hampton, GA | 3.0 | 2.0 | 1488 | $1,650 | $1.11 | 26d | 1 | 1.23mi |
| 2051 Registry Ct Lovejoy, GA | 4.0 | 3.0 | 2188 | $1,940 | $0.89 | 46d | 1 | 1.25mi |
| 11352 Michelle Way Lovejoy, GA | 3.0 | 2.5 | 1440 | $1,485 | $1.03 | 15d | 1 | 1.25mi |
| 2367 Brianna Dr Lovejoy, GA | 3.0 | 2.5 | 1440 | $1,695 | $1.18 | 46d | 1 | 1.27mi |
| 2361 Brianna Dr Lovejoy, GA | 3.0 | 2.5 | 1384 | $1,525 | $1.10 | 24d | 1 | 1.28mi |
| 2355 Brianna Dr Lovejoy, GA | 3.0 | 2.5 | 1876 | $1,476 | $0.79 | 15d | 1 | 1.30mi |
| 2306 Nicole Dr Lovejoy, GA | 3.0 | 2.5 | 1324 | $1,800 | $1.36 | 46d | 1 | 1.31mi |
| 2251 Nicole Dr #119 Hampton, GA | 3.0 | 2.5 | 1324 | $1,700 | $1.28 | 26d | 1 | 1.31mi |
| 2275 Nicole Dr Lovejoy, GA | 4.0 | 2.0 | 1800 | $1,835 | $1.02 | 7d | 1 | 1.32mi |
| 11531 Kimberly Way Lovejoy, GA | 3.0 | 2.5 | 1579 | $2,200 | $1.39 | 6d | 1 | 1.32mi |
| 11522 Kimberly Way Lovejoy, GA | 3.0 | 2.5 | 1700 | $2,200 | $1.29 | 6d | 1 | 1.32mi |
| 11540 Alicias Ct Lovejoy, GA | 3.0 | 2.5 | 1876 | $1,711 | $0.91 | 7d | 1 | 1.32mi |
| 2195 Bridgewater Pass Lovejoy, GA | 4.0 | 2.0 | 2430 | $2,800 | $1.15 | 46d | 1 | 1.35mi |
| 202 Goldleaf Dr Hampton, GA | 3.0 | 2.5 | 1667 | $2,065 | $1.24 | 0d | 1 | 1.46mi |
Listing history 7 events
-
2026-06-21days on market $192,200 Active 11 DOM
-
2026-06-18days on market $192,200 Active 8 DOM
-
2026-06-17days on market $192,200 Active 7 DOM
-
2026-06-16days on market $192,200 Active 6 DOM
-
2026-06-15days on market $192,200 Active 5 DOM
-
2026-06-13remarks 245-char remark
-
2026-06-13$192,200 Active 3 DOM
ⓘ Source: listings_history table (triggers on properties + properties_extension) + one-shot
backfill from property_details.listing_events for pre-trigger history.
Tax reassessment forecast GA · Resets to sale price
- Current annual tax
- $4,266 · $356/mo
- Projected year-2 tax
- $4,266 · $356/mo
- Expected delta
- $0/yr ($0/mo · 0.0%)
ⓘ Screening estimate from a state-policy table — verify with the county assessor before closing.
Climate risk First Street
- Flood 1/10 Low FEMA zone X (unshaded) · 0% chance over 30 yrs
- Wildfire 2/10 Low
- Heat 6/10 Major 7 d/yr ≥105°F today · 19 d/yr by 30 yrs out
- Wind 6/10 Major 27% chance of damaging wind over 30 yrs
- Air quality 4/10 Moderate 4 unhealthy d/yr today · 5 by 30 yrs out
Nearby sold comps map
Loading sold comps map…
Walkable amenities ~0.75 mi
Loading nearby amenities…
Taxation est. · year 1
- Rental income
- $24,891
- − Mortgage interest
- −$10,766
- − Property taxes
- −$4,266
- − Insurance
- −$961
- − Repairs & maintenance
- −$1,991
- − Management
- −$1,991
- − Depreciation
- −$5,591
- Taxable loss
- −$677
- Est. tax savings @ 24.0%
- +$162
- After-tax cash flow
- $2,504/yr
For passive investors: Depreciation is non-cash, so a rental often shows a tax loss while cash-flowing — sheltering income. Rental losses are passive: they offset passive income freely, and up to $25,000/yr can offset ordinary (W-2) income if you actively participate and your MAGI is under $100k (phasing out to $0 by $150k); unused losses carry forward. On sale, claimed depreciation is recaptured at up to 25%, and gains may owe capital-gains tax (a 1031 exchange can defer both). Figures are a year-1 estimate at your 24.0% rate — not tax advice; consult a CPA.
Schools (NCES district)
- District
- Clayton County
- NCES district ID
- 1301230
- Math proficiency
- 11% ▼ -13.00%
- Reading proficiency
- 20% ▼ -9.00%
- Median HH income
- $42,266
- Composite
- 13.41/100
- National rank
- #9527
- State rank
- #155 of 174 in GA
Livability — Lovejoy
- Score
- 62/100
- State rank
- #317
- US rank
- #17071
Category grades
Schools grade is shown separately in the Schools card above.
Census & demographics
- Census place
- Lovejoy, GA
- County
- Henry County · 316,359 people
- City population
- 606
- Metro
- Atlanta-Sandy Springs-Alpharetta, GA
- Population (ZIP)
- 52,402
- Household income
- $82,619
- Rent vs Own
- Severe rent burden
- 1285.0
Population outlook (Clayton County) Hauer SSP2
- Today (2025)
- 310,777 people
- By 2030
- 329,762 · +6.1%
- By 2040
- 368,052 · +18.4%
- By 2050
- 401,196 · +29.1%
- By 2075
- 472,488 · +52.0%
- By 2100
- 500,446 · +61.0%
Race, ethnicity, and origin ACS 2023
- Neighborhood character
- Majority Black (63%)
- Race & ethnicity
- Black 63% White 23% Hispanic / Latino 8% Two or more races 6% Asian 2%
- Hispanic origin (detail)
- Mexican 5% Puerto Rican 1%
- Common ancestry
- Hispanic 4% Lithuanian 1% Italian 1%
- Foreign-born
- 9% · Canada, Vietnam, Jamaica
- Languages at home
- 89% English-only · Spanish 6% French/Haitian/Cajun 2% Vietnamese 1%
Political lean MEDSL · Clayton
- 2024 margin
- Solid D (+69.2) · D 84.3% · R 15.1%
- 2008→2024 swing
- +2.8pp toward D · 2008: 66.4pp · 2024: 69.2pp
- All cycles
- 2024: D+69.2 2020: D+70.9 2016: D+71.9 2012: D+70.1 2008: D+66.4
Not yet ingested
- Civics
- —
Market trends
- HPI YoY
- ▼ -71.11%
- Current HPI
- 222.0357
- Rent YoY
- ▲ 2.20%
- Metro
- Atlanta-Sandy Springs-Alpharetta, GA
- State GDP YoY
- ▲ 2.66%
- F500 in state
- 28
Industry mix (Fortune 500 HQ in GA)
| Industry | F500 HQs | Revenue |
|---|---|---|
| Paper / Packaging | 2 | $29B |
|
||
| Retail | 1 | $160B |
|
||
| Transportation / Logistics | 1 | $91B |
|
||
| Airlines | 1 | $62B |
|
||
| Consumer Goods | 1 | $47B |
|
||
| Utilities | 1 | $25B |
|
||
Price history
-64.5% since first listed14 events — show timeline
- 2026-06-11 Listed $192,200 CGMLS
- 2024-05-22 Listing Removed — FMLS
- 2024-04-30 Listing Removed — GAMLS
- 2024-02-21 Listed $300,000 GAMLS
- 2024-02-21 Listed $300,000 FMLS
- 2024-02-15 Listing Removed — GAMLS
- 2023-11-21 Listed $305,000 GAMLS
- 2023-10-16 Listing Removed — GAMLS
- 2023-07-14 Price Changed $315,000 GAMLS
- 2023-06-19 Listed $330,000 GAMLS
- 2019-05-21 Sold (MLS) $191,990 FMLS
- 2019-04-03 Pending — FMLS
- 2019-03-06 Listed $194,490 FMLS
- 2018-10-26 Sold (Public Records) $541,500 Public Records
Property tax history
+40.8%/yrLatest (2025): $4,266 · -8.9% YoY. Source: county tax records.
Cash-flow waterfall
monthlySold comps — $/sqft
last 12 mo · ≤1 miLoading sold comps…