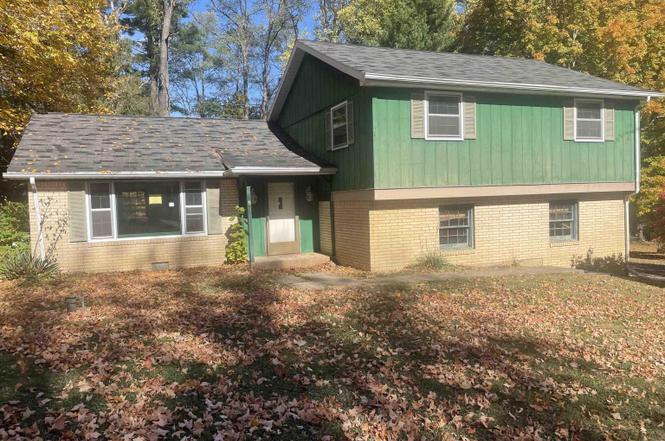
1906 W James Dr · Marion, IN
Flood risk 1/10 · Minimal
- FEMA flood zone
- X (unshaded)
- Chance of flooding over 30 yrs
- 0.0%
- Est. flood insurance / yr
- $473 – $860
Fire risk 1/10 · Minimal
- Est. fire insurance / yr
- $717 – $1,331
Heat risk 3/10 · Minor
- Hot days now (above 101°F)
- 7 days/yr
- Hot days in 30 yrs
- 18 days/yr
Wind risk 2/10 · Minimal
- Chance of severe wind over 30 yrs
- —
Air-quality risk 2/10 · Minimal
- Unhealthy air days now
- 1 days/yr
- Unhealthy air days in 30 yrs
- 3 days/yr
Risk factors via First Street. Map © Google.
Why this score? — see what drove the D+ grade
The composite is a weighted blend of 9 inputs, each scored 0–100. Each bar is that input's sub-score; the figure is the points it added to the 100-point composite (weight × sub-score).
- Cash flow +19.6/30.0
- ARV discount +7.5/15.0
- DSCR +6.2/10.0
- 1% rule +6.1/10.0
- Livability +3.2/5.0
- Rent growth +2.5/5.0
- Condition / age +2.5/5.0
- Schools +1.7/10.0
- Appreciation +0.0/10.0
$109,000
🖨 Deal sheet 📄 Offer letter ✓ Due diligence
Listing remarks MLS
Beautiful large home in north Grant County subdivision. Formal, living dining with hardwood and open to wonderful, updated kitchen featuring solid surface granite countertops and abundance of quality wood cabinets for storage, walk in pantry and stainless appliances. 3 bedrooms, one with attic access, on second floor all with hardwood and full bath. Wonderful family room with gas log fireplace and French doors to deck. Very large master suite features double closets, private French door entrance to deck, bath and laundry in private hall. Sun room off main area surrounded by windows on 2 sides overlooking wooded back yard. Finished basement features second gas log fireplace, walkout patio and spiral staircase from main floor. Large storage shed for outside storage. Gas log fireplaces supplied by Ferrell gas propane. Elec. average is 222.00 mo. Whole house exhaust on second floor works beautifully. Beautiful semi wooded lot with landscaping surrounding home. Quiet dead-end street. This one won?t last long!
Key facts
- Gas log fireplace
- Walk-out basement
- Granite countertops
Tags
Neighborhood map
What this means for you Summary
Snapshot
- This is a 3-bed/2.5-bath single-family listed at $109k.
Deal economics
- At list price, monthly cash flow is $126 ($2k/yr) — positive.
- The deal already cash-flows at list — no discount required.
- Meets the 1% rule at list price ($1k rent vs $109k).
- Recommended offer: $96k (12.0% below list) — sets the bar for market timing.
Location & tenants
- Location reads 65/100 on livability (#337 in IN) — a middle-class / working-renter tenant base. Strengths: crime A+, cost of living A+, housing A+; Watch: amenities F, commute F, employment F.
- Marion Community Schools (town): math 18% / reading 24% proficiency, ranked #277 of 301 in IN (top 92%) — low school quality limits family demand, transient renter base, plan for 1-2y turnover; 67% free/reduced lunch — lower-income household profile, screen leases tightly.
- Zoned schools: Riverview Elementary School (math 42% / reading 27%, grade F, #597 of 994 statewide, top 63%, 396 students, 72% FRL); John L Mcculloch Junior High Sch (math 11% / reading 22%, grade F, #287 of 330 statewide, top 88%, 524 students, 74% FRL); Marion High School (math 12% / reading 47%, grade F, #308 of 369 statewide, top 84%, 1,050 students, 66% FRL) — zoned schools at 71% FRL track the district average.
- Market conditions: 124 active listings in the ZIP; 52 units permitted in Grant County in 2024 (8 in 5+ unit buildings).
Forward outlook
- Local home prices are declining (-3.0%/yr); year-one equity from $754 of loan paydown is wiped out by about $3k of value loss. Plan a longer hold.
- Grant County population projected at -18% by 2050 — secular population decline; favor cash flow + early exit over multi-decade hold.
Negotiation context
- It's been on market 124 days — a 12% lower offer ($96k) is reasonable based on typical stale-listing flexibility.
- 5 sale attempts since 12y ago; this cycle's ask has dropped $50k (31%) from the opening price — seller is motivated, your offer sets the floor, not the list.
Questions for the listing agent
- It's been on market 124 days. Have you received any prior offers? Is the seller open to a 12% concession, seller financing, or rate buy-down credit?
- Built in 1970 — when were the roof, HVAC, electrical panel, plumbing, and water heater last replaced?
- Why hasn't it sold? Are there any deal-killer items the seller is aware of (foundation, flood, title, zoning, code violations)?
- Is there a deadline driving the sale (1031 exchange, divorce, estate, relocation)? That informs how much negotiation room exists.
- Schools are F-rated, which usually means shorter tenancies and higher turnover. Who's the typical renter profile here, and what's been the actual vacancy rate?
- The area grade is low — what's the realistic commute time and amenity access for the typical tenant pool here? Any planned neighborhood developments (good or bad) we should know about?
- What's the average days-on-market for RENTAL listings here right now (not sales)? A rising rental-DOM trend means longer vacancies and softer asking-rent achievability than the comps imply.
- What's the recent tenant-quality profile in this submarket — average credit score on applications, eviction rate, late-payment / NSF rate, and stable-employment percentage? A property-management company in the area should have these aggregated.
- How much new for-sale + rental construction is in the pipeline within 1–3 miles? Heavy new supply typically softens prices + rents 12–24 months out; constrained supply supports both.
Investment metrics
- 1% rule
- 1.11% ✓
- Cap rate
- 7.68%
- Cash-on-cash
- 4.94%
- DSCR
- 1.22
- GRM
- 7.5
CMA / ARV
- ARV (on-the-fly)
- $218,572
- Comps found
- 5
Show comp detail 5 sales within ~0.75 mi
| Address | Dist | Beds/Ba | Sqft | Sold | Price | $/sf | Match |
|---|---|---|---|---|---|---|---|
| 1906 W James Dr | 0.00mi | 4/2.5 (+1) | 2,062 (0%) | 0mo | $105,000 | $51 | 95 |
| 3112 N Coats Rd | 0.24mi | 3/2.0 | 1,972 (-4%) | 3mo | $210,000 | $106 | 77 |
| 2214 N Wabash Rd | 0.48mi | 3/3.0 | 2,064 (+0%) | 2mo | $260,000 | $126 | 74 |
| 2625 W Lawson Rd | 0.53mi | 3/1.5 | 1,850 (-10%) | 9mo | $199,900 | $108 | 46 |
| 3750 N Penbrook Dr | 0.53mi | 4/3.0 (+1) | 2,190 (+6%) | 14mo | $229,900 | $105 | 46 |
Match score weights: distance 35% · size 25% · config 20% · recency 20%. Top-matched comps best support the ARV.
Projected returns pro-forma
-3.0% appreciation · 3.0% rent growth · sell at horizon
- IRR
- -8.6%
- Equity multiple
- 0.69×
- Total profit
- $-9,596
- Equity at exit
- $16,252
- IRR
- 1.0%
- Equity multiple
- 1.07×
- Total profit
- $2,205
- Equity at exit
- $9,424
Cash invested: $30,520 (down + closing). Projections, not guarantees.
Landlord ↔ Tenant lean methodology
- Overall (STATE)
- 90 Strongly Landlord-Friendly
- State Indiana
- 90 Strongly Landlord-Friendly · R+11
- County
- — inherits STATE
- City
- — inherits STATE
ZIP-level market 46952
- Home prices YoY
- -29.9%
- Active inventory
- 124
- Price-to-rent
- 7.5×
Monthly cashflow live
- Estimated rent
- $1,205 medium interval (Pro) →
- Mortgage (P&I)
- −$572
- Tax from tax record
- −$209 /mo · $2,512/yr
- Insurance
- −$45
- HOA
- −$0
- Vacancy / Maint / Mgmt
- −$253
- Net cashflow
- $126
Break-even live
UW: 25.0% down · 7.5% · 30yr · 1.5% tax · 5.0% vac · 8.0% maint · 8.0% mgmt
Financing live
Cash to close
- Down payment
- $27,250
- Closing costs
- $3,270
- Reserves months
- —
- Total cash needed
- —
Loan-product check · same deal, 3 products live
Conventional
25% down · 7.5% · 30yr
- Down + closing
- —
- Monthly P&I
- —
- Monthly cashflow
- —
- DSCR
- —
- Eligible?
- —
Personal DTI + credit; lowest rate.
DSCR
20% down · 8.5% · 30yr
- Down + closing
- —
- Monthly P&I
- —
- Monthly cashflow
- —
- DSCR
- —
- Eligible?
- —
No personal income docs; deal must DSCR.
Hard money
10% down · 12.0% · 12mo
- Down + closing
- —
- Monthly P&I
- —
- Monthly cashflow
- —
- DSCR
- —
- Eligible?
- —
Short-term bridge; refi at stabilization.
Listing history 14 events
-
2026-03-30status Pending
-
2026-03-30status Active
-
2026-03-30historical Active Under Contract
-
2026-03-27price $109,000
-
2026-03-06price $119,000
-
2026-01-28price $139,000
-
2026-01-02price $149,000
-
2025-11-24$159,000 Active
-
2022-12-07price $200,000
-
2022-11-16$235,900 Active
-
2021-12-15soldstatus $185,000 1019-char remark
Show marketing remark (1019 chars)
Beautiful large home in north Grant County subdivision. Formal, living dining with hardwood and open to wonderful, updated kitchen featuring solid surface granite countertops and abundance of quality wood cabinets for storage, walk in pantry and stainless appliances. 3 bedrooms, one with attic access, on second floor all with hardwood and full bath. Wonderful family room with gas log fireplace and French doors to deck. Very large master suite features double closets, private French door entrance to deck, bath and laundry in private hall. Sun room off main area surrounded by windows on 2 sides overlooking wooded back yard. Finished basement features second gas log fireplace, walkout patio and spiral staircase from main floor. Large storage shed for outside storage. Gas log fireplaces supplied by Ferrell gas propane. Elec. average is 222.00 mo. Whole house exhaust on second floor works beautifully. Beautiful semi wooded lot with landscaping surrounding home. Quiet dead-end street. This one won?t last long!
-
2021-11-09$178,000 1019-char remark
Show marketing remark (1019 chars)
Beautiful large home in north Grant County subdivision. Formal, living dining with hardwood and open to wonderful, updated kitchen featuring solid surface granite countertops and abundance of quality wood cabinets for storage, walk in pantry and stainless appliances. 3 bedrooms, one with attic access, on second floor all with hardwood and full bath. Wonderful family room with gas log fireplace and French doors to deck. Very large master suite features double closets, private French door entrance to deck, bath and laundry in private hall. Sun room off main area surrounded by windows on 2 sides overlooking wooded back yard. Finished basement features second gas log fireplace, walkout patio and spiral staircase from main floor. Large storage shed for outside storage. Gas log fireplaces supplied by Ferrell gas propane. Elec. average is 222.00 mo. Whole house exhaust on second floor works beautifully. Beautiful semi wooded lot with landscaping surrounding home. Quiet dead-end street. This one won?t last long!
-
2014-11-12soldstatus $145,000
-
2014-07-31$149,900
ⓘ Source: listings_history table (triggers on properties + properties_extension) + one-shot
backfill from property_details.listing_events for pre-trigger history.
Tax reassessment forecast IN · Partial reset (capped growth)
- Current annual tax
- $2,512 · $209/mo
- Projected year-2 tax
- $2,512 · $209/mo
- Expected delta
- $0/yr ($0/mo · 0.0%)
ⓘ Screening estimate from a state-policy table — verify with the county assessor before closing.
Climate risk First Street
- Flood 1/10 Low FEMA zone X (unshaded) · 0% chance over 30 yrs
- Wildfire 1/10 Low
- Heat 3/10 Moderate 7 d/yr ≥101°F today · 18 d/yr by 30 yrs out
- Wind 2/10 Low
- Air quality 2/10 Low 1 unhealthy d/yr today · 3 by 30 yrs out
Nearby sold comps map
Loading sold comps map…
Walkable amenities ~0.75 mi
Loading nearby amenities…
Taxation est. · year 1
- Rental income
- $14,460
- − Mortgage interest
- −$6,106
- − Property taxes
- −$2,512
- − Insurance
- −$545
- − Repairs & maintenance
- −$1,157
- − Management
- −$1,157
- − Depreciation
- −$3,171
- Taxable loss
- −$186
- Est. tax savings @ 24.0%
- +$45
- After-tax cash flow
- $1,553/yr
For passive investors: Depreciation is non-cash, so a rental often shows a tax loss while cash-flowing — sheltering income. Rental losses are passive: they offset passive income freely, and up to $25,000/yr can offset ordinary (W-2) income if you actively participate and your MAGI is under $100k (phasing out to $0 by $150k); unused losses carry forward. On sale, claimed depreciation is recaptured at up to 25%, and gains may owe capital-gains tax (a 1031 exchange can defer both). Figures are a year-1 estimate at your 24.0% rate — not tax advice; consult a CPA.
Schools (NCES district)
- District
- Marion Community Schools
- NCES district ID
- 1806390
- Math proficiency
- 18% ▼ -9.00%
- Reading proficiency
- 24% ▼ -6.00%
- Median HH income
- $33,415
- Composite
- 17.13/100
- National rank
- #9115
- State rank
- #277 of 301 in IN
Livability — Marion
- Score
- 65/100
- State rank
- #337
- US rank
- #13006
Category grades
Schools grade is shown separately in the Schools card above.
Census & demographics
- County
- Grant County · 41,561 people
- City population
- 41,561
- Metro
- Marion, IN
- Population (ZIP)
- 18,189
- Household income
- $52,880
- Rent vs Own
- Severe rent burden
- 662.0
Population outlook (Grant County) Hauer SSP2
- Today (2025)
- 64,394 people
- By 2030
- 62,145 · -3.5%
- By 2040
- 57,252 · -11.1%
- By 2050
- 52,968 · -17.7%
- By 2075
- 45,986 · -28.6%
- By 2100
- 39,400 · -38.8%
Race, ethnicity, and origin ACS 2023
- Neighborhood character
- Predominantly White (84%)
- Race & ethnicity
- White 84% Two or more races 7% Hispanic / Latino 5% Black 4% Asian 1%
- Hispanic origin (detail)
- Mexican 4%
- Common ancestry
- Italian 3% Romanian 1% Iranian 1%
- Foreign-born
- 4% · Canada
- Languages at home
- 96% English-only · Spanish 3%
Political lean MEDSL · Grant
- 2024 margin
- Solid R (+41.8) · D 28.2% · R 70.0% · Other 1.9%
- 2008→2024 swing
- -28.7pp toward R · 2008: -13.1pp · 2024: -41.8pp
- All cycles
- 2024: R+41.8 2020: R+38.8 2016: R+39.5 2012: R+22.0 2008: R+13.1
Not yet ingested
- Civics
- —
Market trends
- HPI YoY
- ▼ -76.69%
- Current HPI
- 180.1174
- Rent YoY
- —
- Metro
- Marion, IN
- State GDP YoY
- ▲ 2.90%
- F500 in state
- 18
Industry mix (Fortune 500 HQ in IN)
| Industry | F500 HQs | Revenue |
|---|---|---|
| Industrial Machinery | 2 | $37B |
|
||
| Healthcare | 1 | $177B |
|
||
| Pharmaceuticals | 1 | $45B |
|
||
| Metals / Steel | 1 | $18B |
|
||
| Agriculture | 1 | $17B |
|
||
| Packaging | 1 | $12B |
|
||
Price history
-27.3% since first listed14 events — show timeline
- 2026-03-30 Pending — IRMLS
- 2026-03-30 Relisted — IRMLS
- 2026-03-30 Contingent — IRMLS
- 2026-03-27 Price Changed $109,000 IRMLS
- 2026-03-06 Price Changed $119,000 IRMLS
- 2026-01-28 Price Changed $139,000 IRMLS
- 2026-01-02 Price Changed $149,000 IRMLS
- 2025-11-24 Listed $159,000 IRMLS
- 2022-12-07 Price Changed $200,000 IRMLS
- 2022-11-16 Listed $235,900 IRMLS
- 2021-12-15 Sold (MLS) $185,000 IRMLS
- 2021-11-09 Listed $178,000 IRMLS
- 2014-11-12 Sold (MLS) $145,000 IRMLS
- 2014-07-31 Listed $149,900 IRMLS
Property tax history
+8.5%/yrLatest (2025): $2,512 · -3.2% YoY. Source: county tax records.
Cash-flow waterfall
monthlySold comps — $/sqft
last 12 mo · ≤1 miLoading sold comps…