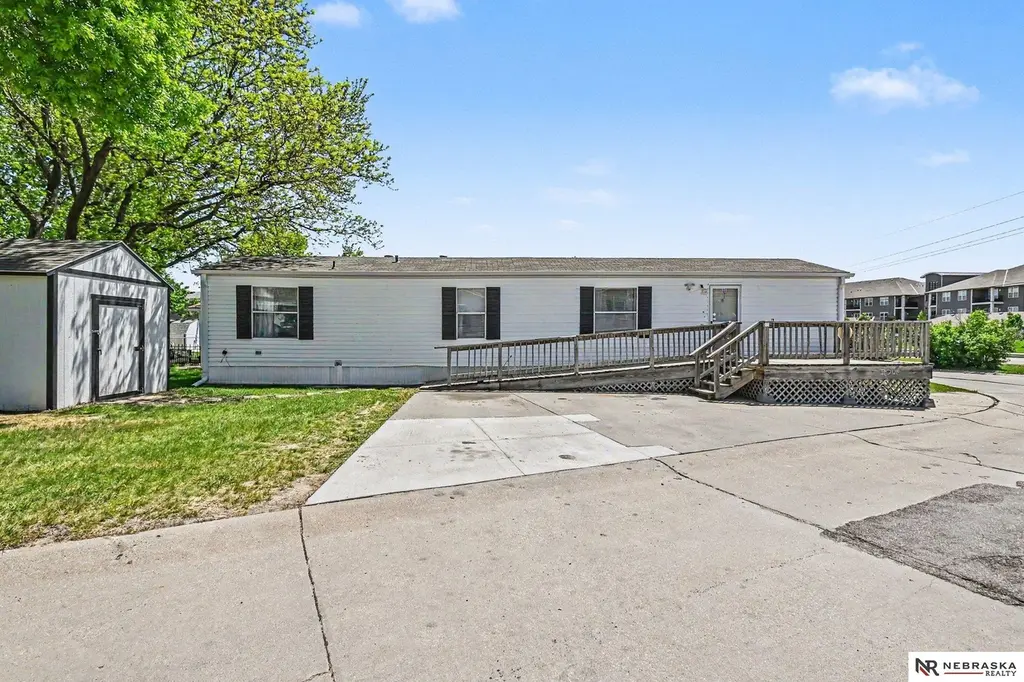
910 W 6th ST Lot 23 St · Papillion, NE
Flood risk No data
- FEMA flood zone
- —
- Chance of flooding over 30 yrs
- —
- Est. flood insurance / yr
- —
Fire risk No data
- Est. fire insurance / yr
- —
Heat risk No data
- Hot days now (above threshold)
- —
- Hot days in 30 yrs
- —
Wind risk No data
- Chance of severe wind over 30 yrs
- —
Air-quality risk 2/10 · Minimal
- Unhealthy air days now
- 1 days/yr
- Unhealthy air days in 30 yrs
- 1 days/yr
Risk factors via First Street. Map © Google.
Why this score? — see what drove the B grade
The composite is a weighted blend of 9 inputs, each scored 0–100. Each bar is that input's sub-score; the figure is the points it added to the 100-point composite (weight × sub-score).
- Cash flow +30.0/30.0
- 1% rule +10.0/10.0
- DSCR +10.0/10.0
- ARV discount +7.5/15.0
- Schools +5.0/10.0
- Livability +4.2/5.0
- Rent growth +2.9/5.0
- Condition / age +2.5/5.0
- Appreciation +0.0/10.0
$55,000
🖨 Deal sheet (PDF) 📄 Offer letter ✓ Due diligence
Listing remarks MLS
Perfect Condition! One owner, large mobile home on a beautiful lot! Large eat-in kitchen with bay window and all applicances stay! Large bathroom as well as Laundry - and the washer/dryer stays too!
Key facts
- Move-in ready
- Premium corner lot
- Walk-in shower
Tags
Property features AI
Finance
- HOA & community: Homeowners association with a monthly fee of $735
Exterior
- Parking: No garage
- Utilities: Public water; Public sewer
- Home design: Residential mobile home; Other number of levels; Built in 1999; 912 square feet of living area; Not new / not a model
- Construction: Other foundation
- Exterior features: Shed(s) on property
Interior
- Bedrooms: Master bedroom on the main floor; Second bedroom on the main floor
- Bathrooms: 1 bathroom (main level)
- Heating & cooling: Natural gas forced-air heating; Central air conditioning
- Interior features: No fireplaces; Main floor master bedroom; Additional bedroom on main floor
Neighborhood map
What this means for you Summary
Snapshot
- This is a 2-bed/1.0-bath manufactured listed at $55k.
Deal economics
- At list price, monthly cash flow is $258 ($3k/yr) — positive.
- The deal already cash-flows at list — no discount required.
- Meets the 1% rule at list price ($2k rent vs $55k).
- Recommended offer: $54k (1.5% below list) — sets the bar for market timing.
- Cap rate 11.9% vs local median 2.6% in Papillion — top-decile yield for the area; either an underpriced asset or a hidden risk that comps aren't pricing in. Stress-test before assuming the spread holds.
Location & tenants
- Location reads 85/100 on livability (#4 in NE, #482 nationally) — a professional / high-income tenant draw. Strengths: crime A+, employment A+, housing A+; Watch: amenities D-, commute F.
- Papillion La Vista Community Schools (suburban): math 54% / reading 58% proficiency, ranked #23 of 111 in NE (top 21%) — acceptable for families but not a draw, mixed tenant base, ~2y average lease; only 16% free/reduced lunch — higher-income household profile.
- Zoned schools: Tara Heights Elementary School (math 54% / reading 60%, grade C+, #136 of 502 statewide, top 31%, 437 students, 33% FRL); La Vista Middle School (math 48% / reading 56%, grade C+, #43 of 128 statewide, top 36%, 716 students, 33% FRL); Papillion La Vista South Hs (math 59% / reading 61%, grade C+, #48 of 261 statewide, top 18%, 1,965 students, 20% FRL).
- Market conditions: Rents rising (+1.5%/yr); 624 active listings in the ZIP; 11 comparable units currently listed for rent nearby; rentals leasing fast (median 5d on market — plan ~1-2 weeks tenant-placement turnaround); high-income renter base; 1,612 units permitted in Sarpy County in 2024 (364 in 5+ unit buildings).
- This rent is only 17% of the median local income ($117k/yr) — well below the 30% rent-burden line; pricing power to push rent on renewal without tenant pushback.
Forward outlook
- Local home prices are declining (-3.0%/yr); year-one equity from $380 of loan paydown is wiped out by about $2k of value loss. Plan a longer hold.
- Sarpy County population projected at +41% by 2050 — long-run rental-demand tailwind backs the buy-and-hold thesis.
- At projected returns (-3.0% appreciation + 1.5% rent growth), your $15k cash investment doubles in ~8 years — after that, you're playing with house money.
Negotiation context
- It's been on market 20 days — a 2% lower offer ($54k) is reasonable based on typical stale-listing flexibility.
- 2 sale attempts since 16y ago; this cycle's ask has dropped $6k (10%) from the opening price — seller is motivated, your offer sets the floor, not the list.
- Current owner paid $27k; list at $55k implies a 104% gain — meaningful room to come down on a strong offer.
Risks & watch-outs
- Watch-outs: HOA is 41% of rent.
Questions for the listing agent
- What does the HOA fee cover, when was the last increase, and are there any pending special assessments or reserve-fund shortfalls?
- Is there a deadline driving the sale (1031 exchange, divorce, estate, relocation)? That informs how much negotiation room exists.
- Schools are A-rated — typically a magnet for longer-tenancy family renters. What's the average tenant stay here, and is there a school-zone premium baked into asking?
- What's the average days-on-market for RENTAL listings here right now (not sales)? A rising rental-DOM trend means longer vacancies and softer asking-rent achievability than the comps imply.
- What's the recent tenant-quality profile in this submarket — average credit score on applications, eviction rate, late-payment / NSF rate, and stable-employment percentage? A property-management company in the area should have these aggregated.
- How much new for-sale + rental construction is in the pipeline within 1–3 miles? Heavy new supply typically softens prices + rents 12–24 months out; constrained supply supports both.
Investment metrics
- 1% rule
- 3.00% ✓
- Cap rate
- 11.93%
- Cash-on-cash
- 20.13%
- DSCR
- 1.90
- GRM
- 2.8
CMA / ARV
No comps found within radius.
Projected returns pro-forma
-3.0% appreciation · 1.52% rent growth · sell at horizon
- IRR
- 9.4%
- Equity multiple
- 1.36×
- Total profit
- $5,551
- Equity at exit
- $8,201
- IRR
- 16.3%
- Equity multiple
- 2.18×
- Total profit
- $18,131
- Equity at exit
- $4,755
Cash invested: $15,400 (down + closing). Projections, not guarantees.
Landlord ↔ Tenant lean methodology
- Overall (STATE)
- 83 Strongly Landlord-Friendly
- State Nebraska
- 83 Strongly Landlord-Friendly · R+13
- County
- — inherits STATE
- City
- — inherits STATE
ZIP-level market 68046
- Home prices YoY
- -34.3%
- Rents YoY
- 1.5%
- Active inventory
- 624
- Price-to-rent
- 2.8×
Monthly cashflow live
- Estimated rent
- $1,651 high interval (Pro) →
- Mortgage (P&I)
- −$288
- Tax from tax record
- −$50 /mo · $595/yr
- Insurance
- −$23
- HOA
- −$685
- Vacancy / Maint / Mgmt
- −$347
- Net cashflow
- $258
Break-even live
Sensitivity live
| Price | -10% $289 | -5% $274 | +0% $258 | +5% $243 | +10% $227 |
|---|---|---|---|---|---|
| Rent | -10% $128 | -5% $193 | +0% $258 | +5% $324 | +10% $389 |
| Rate | -1.0pp $286 | -0.5pp $272 | base $258 | +0.5pp $244 | +1.0pp $230 |
UW: 25.0% down · 7.5% · 30yr · 1.5% tax · 5.0% vac · 8.0% maint · 8.0% mgmt
Financing live
Cash to close
- Down payment
- $13,750
- Closing costs
- $1,650
- Reserves months
- —
- Total cash needed
- —
Loan-product check · same deal, 3 products live
Conventional
25% down · 7.5% · 30yr
- Down + closing
- —
- Monthly P&I
- —
- Monthly cashflow
- —
- DSCR
- —
- Eligible?
- —
Personal DTI + credit; lowest rate.
DSCR
20% down · 8.5% · 30yr
- Down + closing
- —
- Monthly P&I
- —
- Monthly cashflow
- —
- DSCR
- —
- Eligible?
- —
No personal income docs; deal must DSCR.
Hard money
10% down · 12.0% · 12mo
- Down + closing
- —
- Monthly P&I
- —
- Monthly cashflow
- —
- DSCR
- —
- Eligible?
- —
Short-term bridge; refi at stabilization.
Rent comps 11 comps
| Address | Beds | Baths | Sqft | Rent | $/sqft | DOM | Units | Dist |
|---|---|---|---|---|---|---|---|---|
| 1341 W 6th St Papillion, NE | 1.0–2.0 | 1.0–2.0 | 1302 | $2,401 | $1.84 | 5d | 35 | 0.24mi |
| 10532 S 97th Ct Papillion, NE | 2.0 | 1.0–2.0 | 975 | $2,101 | $2.15 | 5d | 32 | 0.78mi |
| 806 1/2 Janes View St Papillion, NE | 1.0–2.0 | 1.0–2.0 | 800 | $1,184 | $1.48 | 5d | 8 | 0.82mi |
| 8211 S 87th Plz La Vista, NE | 1.0–3.0 | 1.0–2.0 | 947 | $1,341 | $1.42 | 4d | 48 | 0.98mi |
| 8220 S 87th St La Vista, NE | 1.0–2.0 | 1.0–1.5 | 799 | $1,070 | $1.34 | 5d | 8 | 1.09mi |
| 9501 Brentwood Dr La Vista, NE | 1.0–3.0 | 1.0–2.0 | 1251 | $2,135 | $1.71 | 4d | 8 | 1.10mi |
| 9824 Hillcrest Plz La Vista, NE | 1.0–3.0 | 1.0–2.0 | 1017 | $1,895 | $1.86 | 4d | 113 | 1.12mi |
| 8500 Granville Pkwy Unit 9-935 La Vista, NE | 1.0 | 1.0 | 850 | $950 | $1.12 | 5d | 1 | 1.39mi |
| 8500 Granville Pkwy Unit 6-623 La Vista, NE | 1.0 | 1.0 | 850 | $975 | $1.15 | 25d | 1 | 1.39mi |
| 8500 Granville Pkwy Unit 8-827 La Vista, NE | 1.0 | 1.0 | 850 | $980 | $1.15 | 25d | 1 | 1.39mi |
| 8500 Granville Pkwy La Vista, NE | 1.0–2.0 | 1.0–1.5 | 1000 | $1,350 | $1.35 | 16d | 4 | 1.39mi |
HOA detail
- Monthly dues
- $685 · $8,220/yr
Listing history 19 events
-
2026-06-22days on market $55,000 Active 20 DOM
-
2026-06-18days on market $55,000 Active 17 DOM
-
2026-06-17days on market $55,000 Active 16 DOM
-
2026-06-16days on market $55,000 Active 15 DOM
-
2026-06-15days on market $55,000 Active 14 DOM
-
2026-06-13days on market $55,000 Active 12 DOM
-
2026-06-13days on market $55,000 Active 11 DOM
-
2026-06-10days on market $55,000 Active 9 DOM
-
2026-06-09days on market $55,000 Active 8 DOM
-
2026-06-08days on market $55,000 Active 7 DOM
-
2026-06-07statusdays on market $55,000 Active 6 DOM
-
2026-06-05days on market $55,000 New 3 DOM
-
2026-06-03days on market $55,000 New 2 DOM
-
2026-06-01pricestatusdays on market $55,000 New 1 DOM
-
2026-05-31days on market $58,000 Active 24 DOM
-
2026-05-07$61,000 New
-
2011-06-17soldstatus $26,925 201-char remark
Show marketing remark (201 chars)
Perfect Condition! One owner, large mobile home on a beautiful lot! Large eat-in kitchen with bay window and all applicances stay! Large bathroom as well as Laundry - and the washer/dryer stays too!
-
2011-06-14historical 201-char remark
Show marketing remark (201 chars)
Perfect Condition! One owner, large mobile home on a beautiful lot! Large eat-in kitchen with bay window and all applicances stay! Large bathroom as well as Laundry - and the washer/dryer stays too!
-
2010-08-28$27,500 201-char remark
Show marketing remark (201 chars)
Perfect Condition! One owner, large mobile home on a beautiful lot! Large eat-in kitchen with bay window and all applicances stay! Large bathroom as well as Laundry - and the washer/dryer stays too!
ⓘ Source: listings_history table (triggers on properties + properties_extension) + one-shot
backfill from property_details.listing_events for pre-trigger history.
Tax reassessment forecast NE · Resets to sale price
- Current annual tax
- $595 · $50/mo
- Projected year-2 tax
- $952 · $79/mo
- Expected delta
- +$357/yr (+$30/mo · 60.0%)
ⓘ Screening estimate from a state-policy table — verify with the county assessor before closing.
Climate risk First Street
- Air quality 2/10 Low 1 unhealthy d/yr today · 1 by 30 yrs out
Nearby sold comps map
Loading sold comps map…
Walkable amenities ~0.75 mi
Loading nearby amenities…
Taxation est. · year 1
- Rental income
- $19,811
- − Mortgage interest
- −$3,081
- − Property taxes
- −$595
- − Insurance
- −$275
- − Repairs & maintenance
- −$1,585
- − Management
- −$1,585
- − HOA
- −$8,220
- − Depreciation
- −$1,600
- Taxable income
- $2,870
- Est. tax owed @ 24.0%
- −$689
- After-tax cash flow
- $2,411/yr
For passive investors: Depreciation is non-cash, so a rental often shows a tax loss while cash-flowing — sheltering income. Rental losses are passive: they offset passive income freely, and up to $25,000/yr can offset ordinary (W-2) income if you actively participate and your MAGI is under $100k (phasing out to $0 by $150k); unused losses carry forward. On sale, claimed depreciation is recaptured at up to 25%, and gains may owe capital-gains tax (a 1031 exchange can defer both). Figures are a year-1 estimate at your 24.0% rate — not tax advice; consult a CPA.
Schools (NCES district)
- District
- Papillion La Vista Community Schools
- NCES district ID
- 3175270
- Math proficiency
- 54% ▼ -2.00%
- Reading proficiency
- 58% ▼ -2.00%
- Median HH income
- $72,684
- Composite
- 49.92/100
- National rank
- #1937
- State rank
- #23 of 111 in NE
Livability — Papillion
- Score
- 85/100
- State rank
- #4
- US rank
- #482
Category grades
Schools grade is shown separately in the Schools card above.
Census & demographics
- County
- Sarpy County · 161,202 people
- City population
- 35,085
- Metro
- Omaha-Council Bluffs, NE-IA
- Population (ZIP)
- 35,085
- Household income
- $116,907
- Rent vs Own
- Severe rent burden
- 565.0
Population outlook (Sarpy County) Hauer SSP2
- Today (2025)
- 211,769 people
- By 2030
- 229,365 · +8.3%
- By 2040
- 264,122 · +24.7%
- By 2050
- 298,087 · +40.8%
- By 2075
- 381,667 · +80.2%
- By 2100
- 448,180 · +111.6%
Race, ethnicity, and origin ACS 2023
- Neighborhood character
- Predominantly White (82%)
- Race & ethnicity
- White 82% Hispanic / Latino 7% Two or more races 6% Black 4% Asian 3%
- Hispanic origin (detail)
- Mexican 5%
- Common ancestry
- Romanian 5% Slovak 2% Italian 2%
- Foreign-born
- 4% · Canada
- Languages at home
- 95% English-only · Spanish 2%
Political lean MEDSL · Sarpy
- 2024 margin
- R (+11.7) · D 43.5% · R 55.2% · Other 1.3%
- 2008→2024 swing
- +4.2pp toward D · 2008: -15.9pp · 2024: -11.7pp
- All cycles
- 2024: R+11.7 2020: R+11.2 2016: R+21.8 2012: R+23.6 2008: R+15.9
Not yet ingested
- Civics
- —
Market trends
- HPI YoY
- ▼ -116.80%
- Current HPI
- 223.4436
- Rent YoY
- ▲ 1.52%
- Metro
- Omaha-Council Bluffs, NE-IA
- State GDP YoY
- ▲ 0.68%
- F500 in state
- 2
Industry mix (Fortune 500 HQ in NE)
| Industry | F500 HQs | Revenue |
|---|---|---|
| Conglomerate | 1 | $371B |
|
||
Price history
+121.8% since first listed4 events — show timeline
- 2026-05-07 Listed $61,000 GPRMLS
- 2011-06-17 Sold (MLS) $26,925 GPRMLS
- 2011-06-14 Listing Removed — GPRMLS
- 2010-08-28 Listed $27,500 GPRMLS
Property tax history
+2.2%/yrLatest (2025): $595 · +32.0% YoY. Source: county tax records.
Cash-flow waterfall
monthlySold comps — $/sqft
last 12 mo · ≤1 miLoading sold comps…