 Duplex
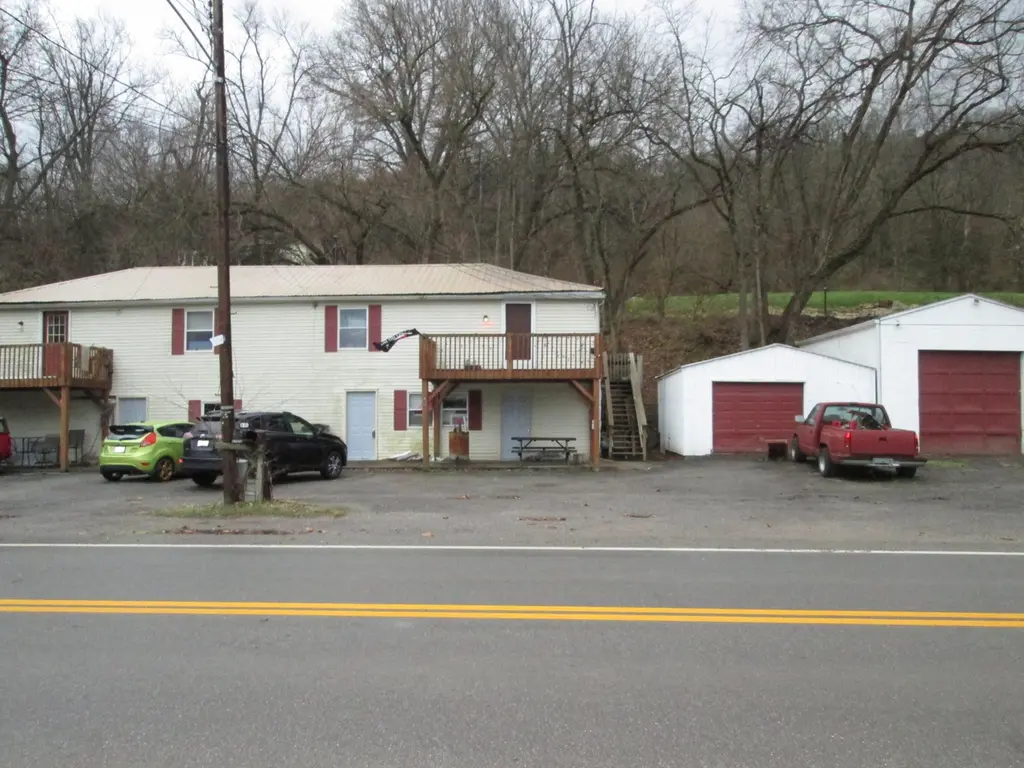
427 River Rd · Bromley, KY
Flood risk 1/10 · Minimal
- FEMA flood zone
- X (unshaded)
- Chance of flooding over 30 yrs
- 0.0%
- Est. flood insurance / yr
- $507 – $1,088
Fire risk 1/10 · Minimal
- Est. fire insurance / yr
- $839 – $1,559
Heat risk 4/10 · Minor
- Hot days now (above 102°F)
- 7 days/yr
- Hot days in 30 yrs
- 19 days/yr
Wind risk 2/10 · Minimal
- Chance of severe wind over 30 yrs
- 1.0%
Air-quality risk 3/10 · Minor
- Unhealthy air days now
- 3 days/yr
- Unhealthy air days in 30 yrs
- 5 days/yr
Risk factors via First Street. Map © Google.
Why this score? — see what drove the C grade
The composite is a weighted blend of 9 inputs, each scored 0–100. Each bar is that input's sub-score; the figure is the points it added to the 100-point composite (weight × sub-score).
- Cash flow +26.9/30.0
- DSCR +9.3/10.0
- 1% rule +6.4/10.0
- Schools +4.0/10.0
- Livability +3.7/5.0
- Rent growth +2.5/5.0
- Condition / age +2.5/5.0
- ARV discount +0.0/15.0
- Appreciation +0.0/10.0
$290,000
🖨 Deal sheet (PDF) 📄 Offer letter ✓ Due diligence
Multi-family units
County records classify this as Multi-Family (5+ Unit). Listing-text estimate: 2 units. estimate disagrees with records
5+ unit building — per-unit beds/baths from public records are typically unavailable; the breakdown below (if shown) is an estimate from the listing text.
Listing remarks MLS
Two unit Bldg with detached garage (2). Unit 1 2 bdrm/1 bath. Unit 2 3 bedroom/2 bath. Both MTM. Downstairs can be converted into more units or storage. Selling as is.
Key facts
- 2 garage spots
- Listed 185 days
Neighborhood map
What this means for you Summary
Snapshot
- This is a 1×2bd/1ba + 1×3bd/2ba units multifamily listed at $290k.
Deal economics
- At list price, monthly cash flow is $807 ($10k/yr) — positive. Per door: $403/mo.
- The deal already cash-flows at list — no discount required.
- Meets the 1% rule at list price ($3k rent vs $290k).
- Recommended offer: $255k (12.0% below list) — sets the bar for market timing.
Location & tenants
- Location reads 74/100 on livability (#106 in KY, #4,580 nationally) — a middle-class / working-renter tenant base. Strengths: crime A+, commute A+, cost of living A+; Watch: employment D, schools F, amenities F.
- Kenton County (suburban): math 42% / reading 48% proficiency, ranked #14 of 165 in KY (top 8%) — families likely to look elsewhere, expect single-tenant / working-renter base with shorter leases.
- Market conditions: 92 active listings in the ZIP; 699 units permitted in Kenton County in 2024 (287 in 5+ unit buildings).
- At $3,295/mo this rent would consume 56% of the median local household income ($71k/yr) (locally 95% of renters already pay >50% of income on rent) — very limited rent-growth headroom before tenants either downsize or default.
Forward outlook
- Local home prices are declining (-3.0%/yr); year-one equity from $2k of loan paydown is wiped out by about $9k of value loss. Plan a longer hold.
- Kenton County population projected at +5% by 2050 — modest demand growth; plan on rents tracking national, not racing it.
- At projected returns (-3.0% appreciation + 3.0% rent growth), your $81k cash investment doubles in ~10 years — after that, you're playing with house money.
Negotiation context
- It's been on market 186 days — a 12% lower offer ($255k) is reasonable based on typical stale-listing flexibility.
Risks & watch-outs
- Watch-outs: built in 1926 — expect roof / HVAC / electrical / plumbing capex.
Questions for the listing agent
- It's been on market 186 days. Have you received any prior offers? Is the seller open to a 12% concession, seller financing, or rate buy-down credit?
- Can we see the unit-by-unit rent roll, current vacancy, and any below-market leases? What's the average tenancy length?
- What capital expenditures (roof, boiler, parking lot, exteriors) have been made in the last 5 years, and what's planned in the next 2?
- Built in 1926 — when were the roof, HVAC, electrical panel, plumbing, and water heater last replaced?
- Why hasn't it sold? Are there any deal-killer items the seller is aware of (foundation, flood, title, zoning, code violations)?
- Is there a deadline driving the sale (1031 exchange, divorce, estate, relocation)? That informs how much negotiation room exists.
- Schools are F-rated, which usually means shorter tenancies and higher turnover. Who's the typical renter profile here, and what's been the actual vacancy rate?
- What's the average days-on-market for RENTAL listings here right now (not sales)? A rising rental-DOM trend means longer vacancies and softer asking-rent achievability than the comps imply.
- What's the recent tenant-quality profile in this submarket — average credit score on applications, eviction rate, late-payment / NSF rate, and stable-employment percentage? A property-management company in the area should have these aggregated.
- How much new apartment / multifamily construction is in the pipeline within 1–3 miles? Heavy new supply (>2% of stock underway) typically softens rents 12–24 months out; light construction supports rent growth.
Investment metrics
- 1% rule
- 1.14% ✓
- Cap rate
- 9.63%
- Cash-on-cash
- 11.93%
- DSCR
- 1.53
- GRM
- 7.3
CMA / ARV
- ARV (median comp)
- $197,791
- List price
- $290,000
- Delta
- 46.62%
- Verdict
- OVERPRICED
- Comps
- 20 within 2.0 mi
Show comp detail 1 sale within ~0.75 mi
| Address | Dist | Beds/Ba | Sqft | Sold | Price | $/sf | Match |
|---|---|---|---|---|---|---|---|
| 305 Main St | 0.43mi | —/— | 3,000 (-2%) | 17mo | $90,000 | $30 | 64 |
Match score weights: distance 35% · size 25% · config 20% · recency 20%. Top-matched comps best support the ARV.
Projected returns pro-forma
-3.0% appreciation · 3.0% rent growth · sell at horizon
- IRR
- 1.4%
- Equity multiple
- 1.05×
- Total profit
- $4,327
- Equity at exit
- $43,240
- IRR
- 11.0%
- Equity multiple
- 1.86×
- Total profit
- $69,632
- Equity at exit
- $25,074
Cash invested: $81,200 (down + closing). Projections, not guarantees.
Landlord ↔ Tenant lean methodology
- Overall (STATE)
- 83 Strongly Landlord-Friendly
- State Kentucky
- 83 Strongly Landlord-Friendly · R+16
- County
- — inherits STATE
- City
- — inherits STATE
ZIP-level market 41016
- Active inventory
- 92
- Price-to-rent
- 15.7×
Monthly cashflow live
- Estimated rent
- $3,295 medium interval (Pro) →
- Mortgage (P&I)
- −$1,521
- Tax from tax record
- −$154 /mo · $1,853/yr
- Insurance
- −$121
- HOA
- −$0
- Vacancy / Maint / Mgmt
- −$692
- Net cashflow
- $807
Break-even live
Sensitivity live
| Price | -10% $971 | -5% $889 | +0% $807 | +5% $725 | +10% $643 |
|---|---|---|---|---|---|
| Rent | -10% $547 | -5% $677 | +0% $807 | +5% $937 | +10% $1,067 |
| Rate | -1.0pp $953 | -0.5pp $881 | base $807 | +0.5pp $732 | +1.0pp $655 |
2-unit breakdown (identical units grouped — click to expand)
| Units | Beds | Baths | Est. rent |
|---|---|---|---|
| 1× unit | 2 | 1 | $1,538 |
| 1× unit | 3 | 2 | $1,758 |
| Total (2 units) | $3,295 | ||
UW: 25.0% down · 7.5% · 30yr · 1.5% tax · 5.0% vac · 8.0% maint · 8.0% mgmt
Financing live
Cash to close
- Down payment
- $72,500
- Closing costs
- $8,700
- Reserves months
- —
- Total cash needed
- —
Loan-product check · same deal, 3 products live
Conventional
25% down · 7.5% · 30yr
- Down + closing
- —
- Monthly P&I
- —
- Monthly cashflow
- —
- DSCR
- —
- Eligible?
- —
Personal DTI + credit; lowest rate.
DSCR
20% down · 8.5% · 30yr
- Down + closing
- —
- Monthly P&I
- —
- Monthly cashflow
- —
- DSCR
- —
- Eligible?
- —
No personal income docs; deal must DSCR.
Hard money
10% down · 12.0% · 12mo
- Down + closing
- —
- Monthly P&I
- —
- Monthly cashflow
- —
- DSCR
- —
- Eligible?
- —
Short-term bridge; refi at stabilization.
Listing history 16 events
-
2026-06-21days on market $290,000 Active 186 DOM
-
2026-06-18days on market $290,000 Active 183 DOM
-
2026-06-17days on market $290,000 Active 182 DOM
-
2026-06-16days on market $290,000 Active 181 DOM
-
2026-06-15days on market $290,000 Active 180 DOM
-
2026-06-13remarks 269-char remark
-
2026-06-13days on market $290,000 Active 178 DOM
-
2026-06-09days on market $290,000 Active 174 DOM
-
2026-06-08days on market $290,000 Active 173 DOM
-
2026-06-07days on market $290,000 Active 172 DOM
-
2026-06-03days on market $290,000 Active 168 DOM
-
2026-06-02days on market $290,000 Active 167 DOM
-
2026-06-01days on market $290,000 Active 166 DOM
-
2026-05-31days on market $290,000 Active 165 DOM
-
2026-04-27price $290,000 167-char remark
Show marketing remark (167 chars)
Two unit Bldg with detached garage (2). Unit 1 2 bdrm/1 bath. Unit 2 3 bedroom/2 bath. Both MTM. Downstairs can be converted into more units or storage. Selling as is.
-
2025-12-17$300,000 Active 167-char remark
Show marketing remark (167 chars)
Two unit Bldg with detached garage (2). Unit 1 2 bdrm/1 bath. Unit 2 3 bedroom/2 bath. Both MTM. Downstairs can be converted into more units or storage. Selling as is.
ⓘ Source: listings_history table (triggers on properties + properties_extension) + one-shot
backfill from property_details.listing_events for pre-trigger history.
Tax reassessment forecast KY · Resets to sale price
- Current annual tax
- $1,853 · $154/mo
- Projected year-2 tax
- $2,494 · $208/mo
- Expected delta
- +$641/yr (+$53/mo · 34.6%)
ⓘ Screening estimate from a state-policy table — verify with the county assessor before closing.
Climate risk First Street
- Flood 1/10 Low FEMA zone X (unshaded) · 0% chance over 30 yrs
- Wildfire 1/10 Low
- Heat 4/10 Moderate 7 d/yr ≥102°F today · 19 d/yr by 30 yrs out
- Wind 2/10 Low 100% chance of damaging wind over 30 yrs
- Air quality 3/10 Moderate 3 unhealthy d/yr today · 5 by 30 yrs out
Nearby sold comps map
Loading sold comps map…
Walkable amenities ~0.75 mi
Loading nearby amenities…
Taxation est. · year 1
- Rental income
- $39,540
- − Mortgage interest
- −$16,245
- − Property taxes
- −$1,853
- − Insurance
- −$1,450
- − Repairs & maintenance
- −$3,163
- − Management
- −$3,163
- − Depreciation
- −$8,436
- Taxable income
- $5,229
- Est. tax owed @ 24.0%
- −$1,255
- After-tax cash flow
- $8,429/yr
For passive investors: Depreciation is non-cash, so a rental often shows a tax loss while cash-flowing — sheltering income. Rental losses are passive: they offset passive income freely, and up to $25,000/yr can offset ordinary (W-2) income if you actively participate and your MAGI is under $100k (phasing out to $0 by $150k); unused losses carry forward. On sale, claimed depreciation is recaptured at up to 25%, and gains may owe capital-gains tax (a 1031 exchange can defer both). Figures are a year-1 estimate at your 24.0% rate — not tax advice; consult a CPA.
Schools (NCES district)
- District
- Kenton County
- NCES district ID
- 2103090
- Math proficiency
- 42% ▼ -13.00%
- Reading proficiency
- 48% ▼ -14.00%
- Median HH income
- $66,183
- Composite
- 40.17/100
- National rank
- #3789
- State rank
- #14 of 165 in KY
Livability — Bromley
- Score
- 74/100
- State rank
- #106
- US rank
- #4580
Category grades
Schools grade is shown separately in the Schools card above.
Census & demographics
- Census place
- Bromley, KY
- County
- Kenton County · 142,881 people
- Metro
- Cincinnati, OH-KY-IN
- Population (ZIP)
- 5,795
- Household income
- $71,172
- Rent vs Own
- Severe rent burden
- 95.0
Population outlook (Kenton County) Hauer SSP2
- Today (2025)
- 174,205 people
- By 2030
- 177,897 · +2.1%
- By 2040
- 182,671 · +4.9%
- By 2050
- 183,543 · +5.4%
- By 2075
- 178,977 · +2.7%
- By 2100
- 159,920 · -8.2%
Race, ethnicity, and origin ACS 2023
- Neighborhood character
- Predominantly White (79%)
- Race & ethnicity
- White 79% Two or more races 10% Hispanic / Latino 8% Black 2%
- Hispanic origin (detail)
- Mexican 5%
- Common ancestry
- Slovak 2% Romanian 1% Serbian 1%
- Foreign-born
- 1% · Canada
- Languages at home
- 95% English-only · Spanish 3% German/W. Germanic 1%
Political lean MEDSL · Kenton
- 2024 margin
- Strong R (+21.7) · D 38.2% · R 59.9% · Other 1.9%
- 2008→2024 swing
- -0.9pp no change · 2008: -20.9pp · 2024: -21.7pp
- All cycles
- 2024: R+21.7 2020: R+19.3 2016: R+26.1 2012: R+24.3 2008: R+20.9
Not yet ingested
- Civics
- —
Market trends
- HPI YoY
- ▼ -141.84%
- Current HPI
- 215.1436
- Rent YoY
- —
- Metro
- Cincinnati, OH-KY-IN
- State GDP YoY
- ▲ 1.81%
- F500 in state
- 4
Industry mix (Fortune 500 HQ in KY)
| Industry | F500 HQs | Revenue |
|---|---|---|
| Healthcare | 1 | $118B |
|
||
| Food / Beverage | 1 | $7B |
|
||
Price history
-3.3% since first listed2 events — show timeline
- 2026-04-27 Price Changed $290,000 NKMLS
- 2025-12-17 Listed $300,000 NKMLS
Property tax history
+4.9%/yrLatest (2025): $1,853 · -3.5% YoY. Source: county tax records.
Cash-flow waterfall
monthlySold comps — $/sqft
last 12 mo · ≤1 miLoading sold comps…