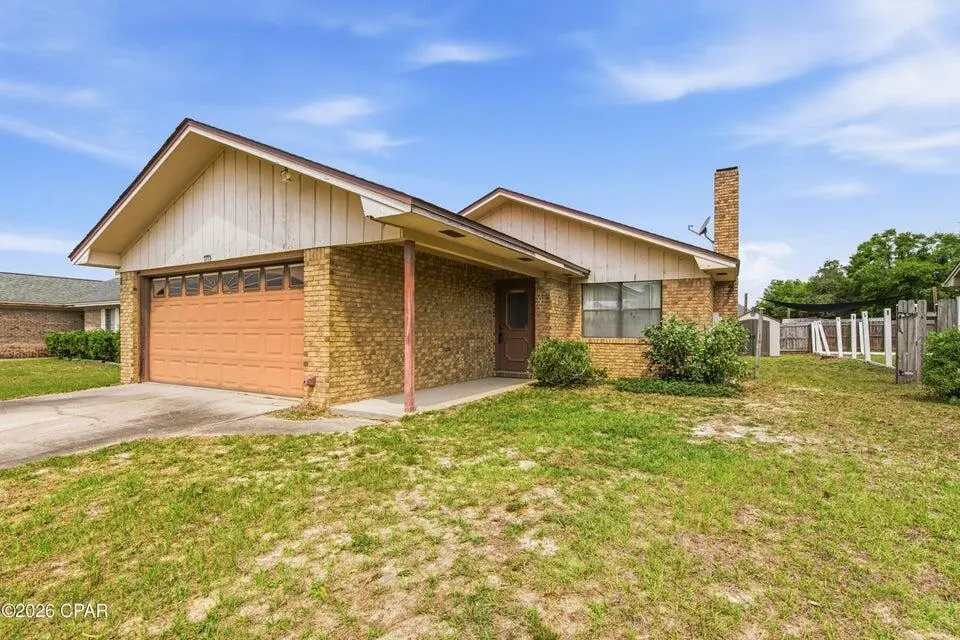
7775 Betty Louise Dr · Callaway, FL
Flood risk 1/10 · Minimal
- FEMA flood zone
- X (unshaded)
- Chance of flooding over 30 yrs
- 0.0%
- Est. flood insurance / yr
- $507 – $1,088
Fire risk 6/10 · Moderate
- Est. fire insurance / yr
- $947 – $1,759
Heat risk 10/10 · Severe
- Hot days now (above 104°F)
- 7 days/yr
- Hot days in 30 yrs
- 22 days/yr
Wind risk 9/10 · Severe
- Chance of severe wind over 30 yrs
- 99.0%
Air-quality risk 1/10 · Minimal
- Unhealthy air days now
- 0 days/yr
- Unhealthy air days in 30 yrs
- 0 days/yr
Risk factors via First Street. Map © Google.
Why this score? — see what drove the D+ grade
The composite is a weighted blend of 9 inputs, each scored 0–100. Each bar is that input's sub-score; the figure is the points it added to the 100-point composite (weight × sub-score).
- Cash flow +15.3/30.0
- ARV discount +14.2/15.0
- DSCR +4.7/10.0
- Schools +4.3/10.0
- Livability +3.2/5.0
- 1% rule +2.9/10.0
- Rent growth +2.8/5.0
- Condition / age +2.5/5.0
- Appreciation +0.0/10.0
$215,000
🖨 Deal sheet (PDF) 📄 Offer letter ✓ Due diligence
Listing remarks MLS
Home built in 1987 featuring 3 bedrooms and 2 bathrooms. This fixer upper is full of potential and perfect for investors or buyers looking to make it their own. The home offers a wood-burning fireplace, spacious yard, and solid flooring throughout most of the home, with carpeted bedrooms ready for updating. Great opportunity for a new owner to add personal touches and value.
Key facts
- Spacious yard
- Solid flooring
- 7,840 sq ft lot
Tags
Property features AI
Finance
- HOA & community: Subdivision: CALLAWAY FOREST UNIT 2
Exterior
- Parking: Attached 2-car garage
- Utilities: Electric service; Public sewer; TV cable available
- Home design: Ranch-style single-story home; Entry level: First floor; Zoned for single-family residential
- Construction: Built in 1987; Frame and trim wood construction; Shingle roof
- Exterior features: Within 1/2 mile to water; Paved road access; Paved road surface
Interior
- Kitchen: Kitchen on the first floor; Disposal; Microwave; Refrigerator
- Bedrooms: 3 bedrooms; Primary bedroom on the first floor; All bedrooms on the first floor
- Bathrooms: 2 full bathrooms
- Heating & cooling: Central heating; Central air conditioning; Ceiling fans; Electric heat controls
- Interior features: Breakfast bar; Cathedral ceilings; Fireplace; Skylight(s); Unfurnished
- Laundry & utility: Washer; Dryer; Electric water heater
Neighborhood map
What this means for you Summary
Snapshot
- This is a 3-bed/2.0-bath single-family listed at $215k.
Deal economics
- At list price, monthly cash flow is $78 ($940/yr) — positive.
- The deal already cash-flows at list — no discount required.
- To meet the 1% rule (rent ≥ 1% of price), the offer needs to be $171k (20.6% below list).
- Recommended offer: $171k (20.6% below list) — sets the bar for 1% rule.
- Cap rate 6.7% vs local median 5.1% in Callaway — top-decile yield for the area; either an underpriced asset or a hidden risk that comps aren't pricing in. Stress-test before assuming the spread holds.
Location & tenants
- Location reads 64/100 on livability (#690 in FL) — a middle-class / working-renter tenant base. Strengths: cost of living A+, housing A+; Watch: employment D+, amenities F, commute F.
- Bay (suburban): math 51% / reading 51% proficiency, ranked #29 of 73 in FL (top 40%) — acceptable for families but not a draw, mixed tenant base, ~2y average lease.
- Zoned schools: Callaway Elementary School (math 37% / reading 42%, grade F, #1,513 of 2,144 statewide, top 73%, 511 students, 72% FRL); Rutherford High School (math 24% / reading 29%, grade F, #489 of 667 statewide, top 74%, 1,337 students, 63% FRL) — zoned schools average 68% FRL vs 48% district-wide (19 pts higher); higher-poverty schools than district average — tighter screening recommended.
- Zoned-school proficiency averages 33% at this address vs 51% district-wide (-18 pts) — the specific schools serving this property underperform the Bay average; the district grade overstates school quality for this exact location.
- Market conditions: Rents rising (+1.1%/yr); 981 active listings in the ZIP; 14 comparable units currently listed for rent nearby; rentals at typical pace (median 23d on market — plan ~3-4 weeks tenant-placement turnaround); 2,473 units permitted in Bay County in 2024 (559 in 5+ unit buildings).
Forward outlook
- Local home prices are declining (-3.0%/yr); year-one equity from $1k of loan paydown is wiped out by about $6k of value loss. Plan a longer hold.
- Bay County population projected at +24% by 2050 — long-run rental-demand tailwind backs the buy-and-hold thesis.
Negotiation context
- It's been on market 40 days — a 3% lower offer ($209k) is reasonable based on typical stale-listing flexibility.
- 2 sale attempts with the ask held roughly flat each time — persistent listings suggest the price (not the market) is what's stuck; bring a comps-based counter.
- Current owner paid $64k; list at $215k implies a 238% gain — meaningful room to come down on a strong offer.
Risks & watch-outs
- Climate carrying-cost: severe wind risk, 99% chance of damaging wind over 30y; major wildfire risk; extreme-heat days projected 7→22/yr by 2055 (HVAC capex compounding) — expect insurance premiums to compound above CPI over the hold.
Questions for the listing agent
- It's been on market 40 days. Have you received any prior offers? Is the seller open to a 21% concession, seller financing, or rate buy-down credit?
- Is there a deadline driving the sale (1031 exchange, divorce, estate, relocation)? That informs how much negotiation room exists.
- Schools are F-rated, which usually means shorter tenancies and higher turnover. Who's the typical renter profile here, and what's been the actual vacancy rate?
- The area grade is low — what's the realistic commute time and amenity access for the typical tenant pool here? Any planned neighborhood developments (good or bad) we should know about?
- What's the average days-on-market for RENTAL listings here right now (not sales)? A rising rental-DOM trend means longer vacancies and softer asking-rent achievability than the comps imply.
- What's the recent tenant-quality profile in this submarket — average credit score on applications, eviction rate, late-payment / NSF rate, and stable-employment percentage? A property-management company in the area should have these aggregated.
- How much new for-sale + rental construction is in the pipeline within 1–3 miles? Heavy new supply typically softens prices + rents 12–24 months out; constrained supply supports both.
Investment metrics
- 1% rule
- 0.79% ✗
- Cap rate
- 6.73%
- Cash-on-cash
- 1.56%
- DSCR
- 1.07
- GRM
- 10.5
CMA / ARV
- ARV (median comp)
- $252,305
- List price
- $215,000
- Delta
- -14.79%
- Verdict
- UNDERPRICED
- Comps
- 20 within 1.0 mi
Show comp detail 12 sales within ~0.75 mi
| Address | Dist | Beds/Ba | Sqft | Sold | Price | $/sf | Match |
|---|---|---|---|---|---|---|---|
| 7740 Betty Louise Dr | 0.21mi | 3/2.0 | 1,322 (+6%) | 3mo | $215,000 | $163 | 77 |
| 411 Tanya Pass | 0.12mi | 3/2.0 | 1,373 (+10%) | 6mo | $145,500 | $106 | 72 |
| 7528 Harvey St | 0.49mi | 3/2.0 | 1,232 (-1%) | 5mo | $249,900 | $203 | 71 |
| 421 Tanya Pass Pass | 0.08mi | 3/2.0 | 1,094 (-12%) | 7mo | $220,000 | $201 | 70 |
| 7333 Claudia's Way | 0.57mi | 3/2.0 | 1,272 (+2%) | 4mo | $240,000 | $189 | 66 |
| 601 Diamonte Cir | 0.63mi | 3/2.0 | 1,357 (+9%) | 5mo | $295,000 | $217 | 51 |
| 7532 Shadow Bay Dr | 0.67mi | 3/2.0 | 1,383 (+11%) | 3mo | $255,000 | $184 | 48 |
| 259 Reddy Creek Dr | 0.71mi | 3/2.0 | 1,427 (+15%) | 2mo | $289,900 | $203 | 41 |
| 201 Beulah Ave | 0.72mi | 2/1.5 (-1) | 1,122 (-10%) | 3mo | $335,000 | $299 | 40 |
| 274 Reddy Creek Dr | 0.74mi | 3/2.0 | 1,427 (+15%) | 3mo | $284,900 | $200 | 39 |
| 282 Reddy Creek Dr | 0.75mi | 3/2.0 | 1,427 (+15%) | 4mo | $293,900 | $206 | 37 |
| 8400 Sun Point Dr | 0.74mi | 3/2.0 | 1,427 (+15%) | 8mo | $294,175 | $206 | 34 |
Match score weights: distance 35% · size 25% · config 20% · recency 20%. Top-matched comps best support the ARV.
Projected returns pro-forma
-3.0% appreciation · 1.12% rent growth · sell at horizon
- IRR
- -15.7%
- Equity multiple
- 0.45×
- Total profit
- $-33,124
- Equity at exit
- $32,057
- IRR
- -10.5%
- Equity multiple
- 0.41×
- Total profit
- $-35,374
- Equity at exit
- $18,589
Cash invested: $60,200 (down + closing). Projections, not guarantees.
Landlord ↔ Tenant lean methodology
- Overall (STATE)
- 87 Strongly Landlord-Friendly
- State Florida
- 87 Strongly Landlord-Friendly · R+3
- County
- — inherits STATE
- City
- — inherits STATE
ZIP-level market 32404
- Home prices YoY
- -16.1%
- Rents YoY
- 1.1%
- Active inventory
- 981
- Price-to-rent
- 10.5×
Monthly cashflow live
- Estimated rent
- $1,707 high interval (Pro) →
- Mortgage (P&I)
- −$1,127
- Tax from tax record
- −$53 /mo · $635/yr
- Insurance
- −$90
- HOA
- −$0
- Vacancy / Maint / Mgmt
- −$358
- Net cashflow
- $78
Break-even live
Sensitivity live
| Price | -10% $200 | -5% $139 | +0% $78 | +5% $18 | +10% $-43 |
|---|---|---|---|---|---|
| Rent | -10% $-56 | -5% $11 | +0% $78 | +5% $146 | +10% $213 |
| Rate | -1.0pp $187 | -0.5pp $133 | base $78 | +0.5pp $23 | +1.0pp $-34 |
UW: 25.0% down · 7.5% · 30yr · 1.5% tax · 5.0% vac · 8.0% maint · 8.0% mgmt
Financing live
Cash to close
- Down payment
- $53,750
- Closing costs
- $6,450
- Reserves months
- —
- Total cash needed
- —
Loan-product check · same deal, 3 products live
Conventional
25% down · 7.5% · 30yr
- Down + closing
- —
- Monthly P&I
- —
- Monthly cashflow
- —
- DSCR
- —
- Eligible?
- —
Personal DTI + credit; lowest rate.
DSCR
20% down · 8.5% · 30yr
- Down + closing
- —
- Monthly P&I
- —
- Monthly cashflow
- —
- DSCR
- —
- Eligible?
- —
No personal income docs; deal must DSCR.
Hard money
10% down · 12.0% · 12mo
- Down + closing
- —
- Monthly P&I
- —
- Monthly cashflow
- —
- DSCR
- —
- Eligible?
- —
Short-term bridge; refi at stabilization.
Rent comps 14 comps
| Address | Beds | Baths | Sqft | Rent | $/sqft | DOM | Units | Dist |
|---|---|---|---|---|---|---|---|---|
| 126 Kristine Blvd Panama City, FL | 2.0 | 1.0 | 884 | $1,400 | $1.58 | 22d | 1 | 0.17mi |
| 7727 Betty Louise Dr Panama City, FL | 3.0 | 2.0 | 1430 | $1,950 | $1.36 | 22d | 1 | 0.29mi |
| 7709 Betty Louise Dr Panama City, FL | 3.0 | 2.0 | 1310 | $1,800 | $1.37 | 22d | 1 | 0.40mi |
| 285 Sukoshi Dr Unit C Panama City, FL | 2.0 | 1.5 | 916 | $1,250 | $1.36 | 14d | 1 | 0.46mi |
| 291 Sukoshi Dr Unit A Panama City, FL | 2.0 | 1.5 | 918 | $1,495 | $1.63 | 22d | 1 | 0.50mi |
| 263 Nelle Ave Panama City, FL | 3.0 | 2.0 | 1294 | $1,690 | $1.31 | 22d | 1 | 0.64mi |
| 7006 Lois St Unit B Panama City, FL | 2.0 | 1.0 | 1000 | $1,000 | $1.00 | 22d | 1 | 0.80mi |
| 116 Christie Ln Panama City, FL | 3.0 | 2.0 | 1092 | $1,550 | $1.42 | 22d | 1 | 0.90mi |
| 6724 Chipewa St Unit 6724 Panama City, FL | 2.0 | 1.0 | 1000 | $1,125 | $1.12 | 14d | 1 | 0.94mi |
| 175 N Berthe Ave Panama City, FL | 4.0 | 2.0 | 1498 | $2,195 | $1.47 | 14d | 1 | 0.99mi |
| 719 S Berthe Ave Unit 8 Panama City, FL | 2.0 | 1.0 | 910 | $1,000 | $1.10 | 22d | 1 | 1.15mi |
| 168 N Comet Ave Panama City, FL | 2.0 | 2.0 | 950 | $1,100 | $1.16 | 22d | 1 | 1.18mi |
| 6328 Olokee St Panama City, FL | 3.0 | 2.0 | 1131 | $1,850 | $1.64 | 14d | 1 | 1.25mi |
| 114 S Kimbrel Ave Panama City, FL | 3.0 | 2.0 | 1400 | $1,850 | $1.32 | 22d | 1 | 1.44mi |
Listing history 22 events
-
2026-06-21days on market $215,000 Active 40 DOM
-
2026-06-19days on market $215,000 Active 38 DOM
-
2026-06-18days on market $215,000 Active 37 DOM
-
2026-06-17days on market $215,000 Active 36 DOM
-
2026-06-16days on market $215,000 Active 35 DOM
-
2026-06-15days on market $215,000 Active 34 DOM
-
2026-06-14days on market $215,000 Active 32 DOM
-
2026-06-13days on market $215,000 Active 31 DOM
-
2026-06-10days on market $215,000 Active 29 DOM
-
2026-06-09days on market $215,000 Active 28 DOM
-
2026-06-08days on market $215,000 Active 27 DOM
-
2026-06-07days on market $215,000 Active 26 DOM
-
2026-06-05days on market $215,000 Active 23 DOM
-
2026-06-03days on market $215,000 Active 22 DOM
-
2026-06-02days on market $215,000 Active 21 DOM
-
2026-06-01days on market $215,000 Active 20 DOM
-
2026-05-31days on market $215,000 Active 19 DOM
-
2026-05-30days on market $215,000 Active 18 DOM
-
2026-05-12$215,000 Active 377-char remark
-
2026-05-07$215,000 Active 377-char remark
Show marketing remark (377 chars)
Home built in 1987 featuring 3 bedrooms and 2 bathrooms. This fixer upper is full of potential and perfect for investors or buyers looking to make it their own. The home offers a wood-burning fireplace, spacious yard, and solid flooring throughout most of the home, with carpeted bedrooms ready for updating. Great opportunity for a new owner to add personal touches and value.
-
1990-12-01soldstatus $63,700
-
1987-07-01soldstatus $62,000
ⓘ Source: listings_history table (triggers on properties + properties_extension) + one-shot
backfill from property_details.listing_events for pre-trigger history.
Tax reassessment forecast FL · Resets to sale price
- Current annual tax
- $635 · $53/mo
- Projected year-2 tax
- $1,784 · $149/mo
- Expected delta
- +$1,150/yr (+$96/mo · 181.1%)
ⓘ Screening estimate from a state-policy table — verify with the county assessor before closing.
Climate risk First Street
- Flood 1/10 Low FEMA zone X (unshaded) · 0% chance over 30 yrs
- Wildfire 6/10 Major
- Heat 10/10 Extreme 7 d/yr ≥104°F today · 22 d/yr by 30 yrs out
- Wind 9/10 Extreme 99% chance of damaging wind over 30 yrs
- Air quality 1/10 Low 0 unhealthy d/yr today · 0 by 30 yrs out
Nearby sold comps map
Loading sold comps map…
Walkable amenities ~0.75 mi
Loading nearby amenities…
Taxation est. · year 1
- Rental income
- $20,481
- − Mortgage interest
- −$12,043
- − Property taxes
- −$635
- − Insurance
- −$1,075
- − Repairs & maintenance
- −$1,638
- − Management
- −$1,638
- − Depreciation
- −$6,255
- Taxable loss
- −$2,804
- Est. tax savings @ 24.0%
- +$673
- After-tax cash flow
- $1,613/yr
For passive investors: Depreciation is non-cash, so a rental often shows a tax loss while cash-flowing — sheltering income. Rental losses are passive: they offset passive income freely, and up to $25,000/yr can offset ordinary (W-2) income if you actively participate and your MAGI is under $100k (phasing out to $0 by $150k); unused losses carry forward. On sale, claimed depreciation is recaptured at up to 25%, and gains may owe capital-gains tax (a 1031 exchange can defer both). Figures are a year-1 estimate at your 24.0% rate — not tax advice; consult a CPA.
Schools (NCES district)
- District
- Bay
- NCES district ID
- 1200090
- Math proficiency
- 51% ▼ -8.00%
- Reading proficiency
- 51% ▼ -7.00%
- Median HH income
- $47,740
- Composite
- 43.41/100
- National rank
- #3014
- State rank
- #29 of 73 in FL
Livability — Callaway
- Score
- 64/100
- State rank
- #690
- US rank
- #14384
Category grades
Schools grade is shown separately in the Schools card above.
Census & demographics
- Census place
- Callaway, FL
- County
- Bay County · 163,593 people
- Metro
- Panama City, FL
- Population (ZIP)
- 42,514
- Household income
- $74,708
- Rent vs Own
- Severe rent burden
- 1218.0
Population outlook (Bay County) Hauer SSP2
- Today (2025)
- 206,264 people
- By 2030
- 217,740 · +5.6%
- By 2040
- 238,738 · +15.7%
- By 2050
- 255,545 · +23.9%
- By 2075
- 288,295 · +39.8%
- By 2100
- 288,638 · +39.9%
Race, ethnicity, and origin ACS 2023
- Neighborhood character
- Predominantly White (69%)
- Race & ethnicity
- White 69% Black 12% Two or more races 10% Hispanic / Latino 9% Asian 3%
- Hispanic origin (detail)
- Mexican 2% Puerto Rican 3%
- Common ancestry
- Lithuanian 3% Slovak 2% Italian 2%
- Foreign-born
- 7% · Canada, Vietnam, Mexico
- Languages at home
- 90% English-only · Spanish 6% Vietnamese 1% Other Asian/Pacific 1%
Political lean MEDSL · Bay
- 2024 margin
- Solid R (+47.4) · D 25.8% · R 73.1% · Other 1.1%
- 2008→2024 swing
- -6.6pp toward R · 2008: -40.7pp · 2024: -47.4pp
- All cycles
- 2024: R+47.4 2020: R+43.5 2016: R+46.3 2012: R+43.6 2008: R+40.7
Not yet ingested
- Civics
- —
Market trends
- HPI YoY
- ▼ -50.59%
- Current HPI
- 263.7178
- Rent YoY
- ▲ 1.12%
- Metro
- Panama City, FL
- State GDP YoY
- ▲ 3.28%
- F500 in state
- 36
Industry mix (Fortune 500 HQ in FL)
| Industry | F500 HQs | Revenue |
|---|---|---|
| Industrial Technology | 2 | $29B |
|
||
| Insurance | 2 | $17B |
|
||
| Retail | 1 | $60B |
|
||
| Technology Distribution | 1 | $58B |
|
||
| Homebuilding | 1 | $35B |
|
||
| Technology Manufacturing | 1 | $35B |
|
||
Price history
+246.8% since first listed4 events — show timeline
- 2026-05-12 Listed $215,000 ECAR
- 2026-05-07 Listed $215,000 CPARMLS
- 1990-12-01 Sold (Public Records) $63,700 Public Records
- 1987-07-01 Sold (Public Records) $62,000 Public Records
Property tax history
+3.3%/yrLatest (2025): $635 · +4.8% YoY. Source: county tax records.
Cash-flow waterfall
monthlySold comps — $/sqft
last 12 mo · ≤1 miLoading sold comps…