 🏷️ Likely Rental
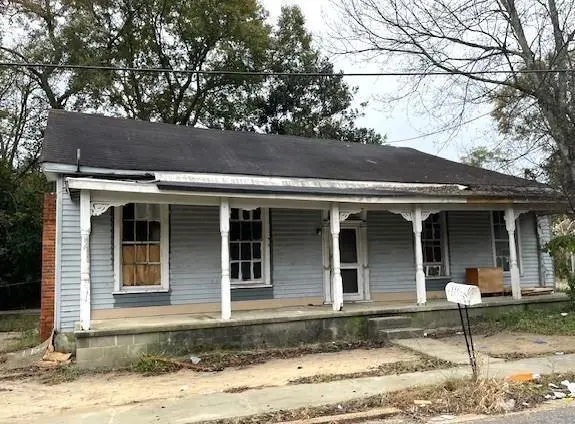
1003 16th St · Phenix City, AL
Flood risk 6/10 · Moderate
- FEMA flood zone
- X (unshaded)
- Chance of flooding over 30 yrs
- 0.75%
- Est. flood insurance / yr
- $507 – $1,088
Fire risk 1/10 · Minimal
- Est. fire insurance / yr
- $916 – $1,700
Heat risk 7/10 · Major
- Hot days now (above 107°F)
- 7 days/yr
- Hot days in 30 yrs
- 19 days/yr
Wind risk 6/10 · Moderate
- Chance of severe wind over 30 yrs
- 69.0%
Air-quality risk 5/10 · Moderate
- Unhealthy air days now
- 7 days/yr
- Unhealthy air days in 30 yrs
- 8 days/yr
Risk factors via First Street. Map © Google.
Why this score? — see what drove the D grade
The composite is a weighted blend of 9 inputs, each scored 0–100. Each bar is that input's sub-score; the figure is the points it added to the 100-point composite (weight × sub-score).
- Cash flow +15.0/30.0
- ARV discount +7.5/15.0
- 1% rule +5.0/10.0
- DSCR +5.0/10.0
- Rent growth +3.8/5.0
- Livability +3.0/5.0
- Schools +2.7/10.0
- Condition / age +2.5/5.0
- Appreciation +0.0/10.0
$30,000
🖨 Deal sheet (PDF) 📄 Offer letter ✓ Due diligence
Listing remarks
Charming Investment Opportunity with Rental Income Potential! This spacious and historic home is the perfect blend of character and opportunity. Recently rented for $700/month, this property is ideal for investors or buyers looking for a unique home to make their own. With 1312 sq ft of living space, the home boasts 2 large bedrooms and 1 bathroom. Each room is generously sized, including the eat-in kitchen and a convenient laundry room. The layout is designed for comfortable living, and the large yard adds outdoor appeal for tenants or homeowners alike. Step onto the covered front porch and enjoy the timeless charm of this 105-year-old gem. Original details throughout the home add characte
Key facts
- 4,792 sq ft lot
- Built 1920
- Listed 69 days
Property features AI
Finance
- HOA & community: No community amenities listed
Exterior
- Parking: See remarks for parking details
- Utilities: Public water; Public sewer; Cable available
- Home design: Single-family residence; One story
- Construction: Wood siding; Composition roof; Built as a residential single-family home
- Exterior features: Awnings; Covered porch/patio; Back yard; Has a view
Interior
- Bedrooms: 2 main-level bedrooms
- Flooring: Laminate flooring
- Bathrooms: 1 full bathroom (main level)
- Heating & cooling: No heating; No cooling
- Interior features: Entrance foyer; No fireplace
- Laundry & utility: Laundry closet; Crawl space basement
Neighborhood map
What this means for you Summary
Snapshot
- This is a 2-bed/1.0-bath single-family listed at $30k.
Deal economics
- At list price, monthly cash flow is $897 ($11k/yr) — positive.
- The deal already cash-flows at list — no discount required.
- Meets the 1% rule at list price ($1k rent vs $30k).
- Recommended offer: $28k (6.0% below list) — sets the bar for market timing.
- Cap rate 42.2% vs local median 5.0% in Phenix City — top-decile yield for the area; either an underpriced asset or a hidden risk that comps aren't pricing in. Stress-test before assuming the spread holds.
Location & tenants
- Location reads 60/100 on livability (#297 in AL) — a middle-class / working-renter tenant base. Strengths: cost of living A+, housing A+; Watch: schools D+, crime F, amenities F.
- Phenix City (suburban): math 22% / reading 44% proficiency, ranked #59 of 129 in AL (top 46%) — families likely to look elsewhere, expect single-tenant / working-renter base with shorter leases; 64% free/reduced lunch — lower-income household profile, screen leases tightly.
- Market conditions: Rents rising fast (+5.3%/yr); 217 active listings in the ZIP; 3 comparable units currently listed for rent nearby; rentals at typical pace (median 15d on market — plan ~3-4 weeks tenant-placement turnaround); 183 units permitted in Russell County in 2024 (0 in 5+ unit buildings).
- This rent runs 35% of the median local income ($48k/yr) — at the standard rent-burdened threshold; future hikes will face affordability resistance.
Forward outlook
- Local home prices are declining (-3.0%/yr); year-one equity from $207 of loan paydown is wiped out by about $900 of value loss. Plan a longer hold.
- Russell County population projected at +42% by 2050 — long-run rental-demand tailwind backs the buy-and-hold thesis.
- At projected returns (-3.0% appreciation + 5.3% rent growth), your $8k cash investment doubles in ~1 year — after that, you're playing with house money.
Negotiation context
- It's been on market 69 days — a 6% lower offer ($28k) is reasonable based on typical stale-listing flexibility.
- 3 sale attempts with the ask held roughly flat each time — persistent listings suggest the price (not the market) is what's stuck; bring a comps-based counter.
- Current owner paid $21k; 40% above their basis — modest negotiation headroom, anchor on the comps not their cost.
Risks & watch-outs
- Watch-outs: built in 1920 — expect roof / HVAC / electrical / plumbing capex.
- Climate carrying-cost: major flood risk; major wind risk, 69% chance of damaging wind over 30y; extreme-heat days projected 7→19/yr by 2055 (HVAC capex compounding) — expect insurance premiums to compound above CPI over the hold.
Questions for the listing agent
- It's been on market 69 days. Have you received any prior offers? Is the seller open to a 6% concession, seller financing, or rate buy-down credit?
- Built in 1920 — when were the roof, HVAC, electrical panel, plumbing, and water heater last replaced?
- Why hasn't it sold? Are there any deal-killer items the seller is aware of (foundation, flood, title, zoning, code violations)?
- Is there a deadline driving the sale (1031 exchange, divorce, estate, relocation)? That informs how much negotiation room exists.
- Schools are D-rated, which usually means shorter tenancies and higher turnover. Who's the typical renter profile here, and what's been the actual vacancy rate?
- Crime grade is F in this area — have there been break-ins, vandalism, or insurance claims at this property in the last 3 years? What carrier currently insures it and at what premium?
- The area grade is low — what's the realistic commute time and amenity access for the typical tenant pool here? Any planned neighborhood developments (good or bad) we should know about?
- What's the average days-on-market for RENTAL listings here right now (not sales)? A rising rental-DOM trend means longer vacancies and softer asking-rent achievability than the comps imply.
- What's the recent tenant-quality profile in this submarket — average credit score on applications, eviction rate, late-payment / NSF rate, and stable-employment percentage? A property-management company in the area should have these aggregated.
- How much new for-sale + rental construction is in the pipeline within 1–3 miles? Heavy new supply typically softens prices + rents 12–24 months out; constrained supply supports both.
Investment metrics
- 1% rule
- 4.65% ✓
- Cap rate
- 42.16%
- Cash-on-cash
- 128.08%
- DSCR
- 6.70
- GRM
- 1.8
CMA / ARV
- ARV (on-the-fly)
- $154,816
- Comps found
- 12
Show comp detail 12 sales within ~0.75 mi
| Address | Dist | Beds/Ba | Sqft | Sold | Price | $/sf | Match |
|---|---|---|---|---|---|---|---|
| 923 20th St | 0.21mi | 2/0.5 | 1,408 (+7%) | 3mo | $53,000 | $38 | 74 |
| 2105 11th Ave | 0.35mi | 3/2.0 (+1) | 1,342 (+2%) | 4mo | $118,500 | $88 | 67 |
| 1709 18th Ave | 0.70mi | 3/2.0 (+1) | 1,326 (+1%) | 2mo | $170,000 | $128 | 55 |
| 2400 13th Ave | 0.61mi | 3/2.0 (+1) | 1,241 (-5%) | 0mo | $222,500 | $179 | 53 |
| 2304 14th Ct | 0.64mi | 3/2.0 (+1) | 1,376 (+5%) | 4mo | $162,000 | $118 | 50 |
| 2116 6th Ave | 0.53mi | 3/2.0 (+1) | 1,440 (+10%) | 1mo | $234,900 | $163 | 49 |
| 1011 11th Ave | 0.67mi | 2/1.0 | 1,157 (-12%) | 1mo | $43,000 | $37 | 48 |
| 1704 18th Ave | 0.66mi | 2/1.5 | 1,191 (-9%) | 6mo | $132,000 | $111 | 47 |
| 2500 5th Ave | 0.74mi | 3/2.0 (+1) | 1,247 (-5%) | 4mo | $219,900 | $176 | 44 |
| 1008 11th Ave | 0.69mi | 2/1.0 | 1,124 (-14%) | 1mo | $23,700 | $21 | 43 |
| 500 21st Pl | 0.55mi | 3/2.0 (+1) | 1,470 (+12%) | 5mo | $250,650 | $171 | 41 |
| 2104 1st Ave | 0.71mi | 2/1.0 | 1,120 (-15%) | 5mo | $85,000 | $76 | 38 |
Match score weights: distance 35% · size 25% · config 20% · recency 20%. Top-matched comps best support the ARV.
Projected returns pro-forma
-3.0% appreciation · 5.33% rent growth · sell at horizon
- IRR
- —
- Equity multiple
- 7.62×
- Total profit
- $55,611
- Equity at exit
- $4,473
- IRR
- —
- Equity multiple
- 17.24×
- Total profit
- $136,449
- Equity at exit
- $2,594
Cash invested: $8,400 (down + closing). Projections, not guarantees.
Landlord ↔ Tenant lean methodology
- Overall (STATE)
- 90 Strongly Landlord-Friendly
- State Alabama
- 90 Strongly Landlord-Friendly · R+15
- County
- — inherits STATE
- City
- — inherits STATE
ZIP-level market 36867
- Home prices YoY
- -30.1%
- Rents YoY
- 5.3%
- Active inventory
- 217
- Price-to-rent
- 1.8×
Monthly cashflow live
- Estimated rent
- $1,396 medium interval (Pro) →
- Mortgage (P&I)
- −$157
- Tax from tax record
- −$36 /mo · $437/yr
- Insurance
- −$12
- HOA
- −$0
- Vacancy / Maint / Mgmt
- −$293
- Net cashflow
- $897
Break-even live
Sensitivity live
| Price | -10% $914 | -5% $905 | +0% $897 | +5% $888 | +10% $880 |
|---|---|---|---|---|---|
| Rent | -10% $786 | -5% $841 | +0% $897 | +5% $952 | +10% $1,007 |
| Rate | -1.0pp $912 | -0.5pp $904 | base $897 | +0.5pp $889 | +1.0pp $881 |
UW: 25.0% down · 7.5% · 30yr · 1.5% tax · 5.0% vac · 8.0% maint · 8.0% mgmt
Financing live
Cash to close
- Down payment
- $7,500
- Closing costs
- $900
- Reserves months
- —
- Total cash needed
- —
Loan-product check · same deal, 3 products live
Conventional
25% down · 7.5% · 30yr
- Down + closing
- —
- Monthly P&I
- —
- Monthly cashflow
- —
- DSCR
- —
- Eligible?
- —
Personal DTI + credit; lowest rate.
DSCR
20% down · 8.5% · 30yr
- Down + closing
- —
- Monthly P&I
- —
- Monthly cashflow
- —
- DSCR
- —
- Eligible?
- —
No personal income docs; deal must DSCR.
Hard money
10% down · 12.0% · 12mo
- Down + closing
- —
- Monthly P&I
- —
- Monthly cashflow
- —
- DSCR
- —
- Eligible?
- —
Short-term bridge; refi at stabilization.
Rent comps 3 comps
| Address | Beds | Baths | Sqft | Rent | $/sqft | DOM | Units | Dist |
|---|---|---|---|---|---|---|---|---|
| 2108 9th Ave Phenix City, AL | 3.0 | 1.0 | 1040 | $1,150 | $1.11 | 22d | 1 | 0.39mi |
| 1346 Ingersoll Dr Phenix City, AL | 3.0 | 2.0 | 1453 | $1,700 | $1.17 | 14d | 1 | 0.91mi |
| 1106 Broadway Unit 1106C Columbus, GA | 1.0 | 1.0 | 930 | $1,600 | $1.72 | 14d | 1 | 0.99mi |
Listing history 24 events
-
2026-06-18days on market $30,000 Active 69 DOM
-
2026-06-17days on market $30,000 Active 68 DOM
-
2026-06-16days on market $30,000 Active 67 DOM
-
2026-06-15days on market $30,000 Active 66 DOM
-
2026-06-14days on market $30,000 Active 64 DOM
-
2026-06-13days on market $30,000 Active 63 DOM
-
2026-06-10days on market $30,000 Active 61 DOM
-
2026-06-09days on market $30,000 Active 60 DOM
-
2026-06-08days on market $30,000 Active 59 DOM
-
2026-06-07days on market $30,000 Active 58 DOM
-
2026-06-05days on market $30,000 Active 55 DOM
-
2026-06-02days on market $30,000 Active 53 DOM
-
2026-06-01days on market $30,000 Active 52 DOM
-
2026-05-31days on market $30,000 Active 51 DOM
-
2026-05-30days on market $30,000 Active 50 DOM
-
2026-04-10$30,000 Active
-
2026-01-31historical $925
-
2026-01-10price $925
-
2026-01-09$875
-
2025-09-01price $40,000
-
2025-05-01price $45,000
-
2025-01-02$50,000 Active
-
2022-05-12price $700
-
2005-02-11soldstatus $21,410
ⓘ Source: listings_history table (triggers on properties + properties_extension) + one-shot
backfill from property_details.listing_events for pre-trigger history.
Tax reassessment forecast AL · Resets to sale price
- Current annual tax
- $437 · $36/mo
- Projected year-2 tax
- $437 · $36/mo
- Expected delta
- $0/yr ($0/mo · 0.0%)
ⓘ Screening estimate from a state-policy table — verify with the county assessor before closing.
Climate risk First Street
- Flood 6/10 Major FEMA zone X (unshaded) · 75% chance over 30 yrs
- Wildfire 1/10 Low
- Heat 7/10 Severe 7 d/yr ≥107°F today · 19 d/yr by 30 yrs out
- Wind 6/10 Major 69% chance of damaging wind over 30 yrs
- Air quality 5/10 Major 7 unhealthy d/yr today · 8 by 30 yrs out
Nearby sold comps map
Loading sold comps map…
Walkable amenities ~0.75 mi
Loading nearby amenities…
Taxation est. · year 1
- Rental income
- $16,751
- − Mortgage interest
- −$1,680
- − Property taxes
- −$437
- − Insurance
- −$150
- − Repairs & maintenance
- −$1,340
- − Management
- −$1,340
- − Depreciation
- −$873
- Taxable income
- $10,931
- Est. tax owed @ 24.0%
- −$2,623
- After-tax cash flow
- $8,135/yr
For passive investors: Depreciation is non-cash, so a rental often shows a tax loss while cash-flowing — sheltering income. Rental losses are passive: they offset passive income freely, and up to $25,000/yr can offset ordinary (W-2) income if you actively participate and your MAGI is under $100k (phasing out to $0 by $150k); unused losses carry forward. On sale, claimed depreciation is recaptured at up to 25%, and gains may owe capital-gains tax (a 1031 exchange can defer both). Figures are a year-1 estimate at your 24.0% rate — not tax advice; consult a CPA.
Schools (NCES district)
- District
- Phenix City
- NCES district ID
- 0102700
- Math proficiency
- 22% ▼ -24.00%
- Reading proficiency
- 44% ▼ -1.00%
- Median HH income
- $36,228
- Composite
- 27.29/100
- National rank
- #7001
- State rank
- #59 of 129 in AL
Livability — Phenix City
- Score
- 60/100
- State rank
- #297
- US rank
- #19037
Category grades
Schools grade is shown separately in the Schools card above.
Census & demographics
- Census place
- Phenix City, AL
- County
- Russell County · 53,055 people
- City population
- 62,290
- Metro
- Columbus, GA-AL
- Population (ZIP)
- 22,821
- Household income
- $48,026
- Rent vs Own
- Severe rent burden
- 1399.0
Population outlook (Russell County) Hauer SSP2
- Today (2025)
- 70,137 people
- By 2030
- 75,826 · +8.1%
- By 2040
- 87,858 · +25.3%
- By 2050
- 99,721 · +42.2%
- By 2075
- 128,009 · +82.5%
- By 2100
- 149,251 · +112.8%
Race, ethnicity, and origin ACS 2023
- Neighborhood character
- Diverse neighborhood (Simpson 0.60)
- Race & ethnicity
- White 53% Black 34% Hispanic / Latino 7% Two or more races 7% Asian 2%
- Hispanic origin (detail)
- Mexican 1% Puerto Rican 2% Cuban 2%
- Common ancestry
- Romanian 2% Italian 2% Slovak 1%
- Foreign-born
- 4% · Canada, China, South Korea
- Languages at home
- 94% English-only · Spanish 4% Tagalog/Filipino 1%
Political lean MEDSL · Russell
- 2024 margin
- Toss-up / Even · D 50.4% · R 48.7%
- 2008→2024 swing
- -5.6pp toward R · 2008: 7.3pp · 2024: 1.7pp
- All cycles
- 2024: D+1.7 2020: D+6.4 2016: D+1.9 2012: D+11.8 2008: D+7.3
Not yet ingested
- Civics
- —
Market trends
- HPI YoY
- ▼ -74.10%
- Current HPI
- 171.8426
- Rent YoY
- ▲ 5.33%
- Metro
- Columbus, GA-AL
- State GDP YoY
- ▲ 2.94%
- F500 in state
- 4
Industry mix (Fortune 500 HQ in AL)
| Industry | F500 HQs | Revenue |
|---|---|---|
| Financial Services | 1 | $8B |
|
||
| Healthcare | 1 | $5B |
|
||
Price history
+40.1% since first listed9 events — show timeline
- 2026-04-10 Listed $30,000 EABOR
- 2026-01-31 Rental Removed $925 TURBOTENANT
- 2026-01-10 Price Changed $925 TURBOTENANT
- 2026-01-09 Listed for Rent $875 TURBOTENANT
- 2025-09-01 Price Changed $40,000 EABOR
- 2025-05-01 Price Changed $45,000 EABOR
- 2025-01-02 Listed $50,000 EABOR
- 2022-05-12 Price Changed $700 RENT.
- 2005-02-11 Sold (Public Records) $21,410 Public Records
Property tax history
+3.8%/yrLatest (2025): $437 · +5.1% YoY. Source: county tax records.
Cash-flow waterfall
monthlySold comps — $/sqft
last 12 mo · ≤1 miLoading sold comps…