 Duplex
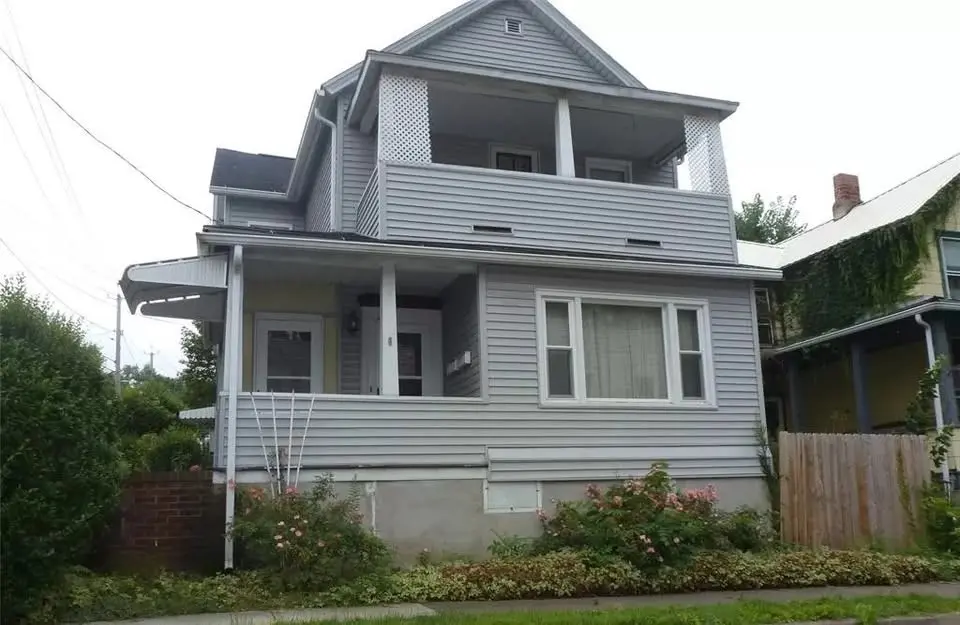
6 Stone St · Binghamton, NY
Flood risk 3/10 · Minor
- FEMA flood zone
- X
- Chance of flooding over 30 yrs
- 0.13%
- Est. flood insurance / yr
- $473 – $860
Fire risk 1/10 · Minimal
- Est. fire insurance / yr
- $691 – $1,283
Heat risk 3/10 · Minor
- Hot days now (above 92°F)
- 7 days/yr
- Hot days in 30 yrs
- 16 days/yr
Wind risk 2/10 · Minimal
- Chance of severe wind over 30 yrs
- 1.0%
Air-quality risk 2/10 · Minimal
- Unhealthy air days now
- 0 days/yr
- Unhealthy air days in 30 yrs
- 1 days/yr
Risk factors via First Street. Map © Google.
Why this score? — see what drove the A grade
The composite is a weighted blend of 9 inputs, each scored 0–100. Each bar is that input's sub-score; the figure is the points it added to the 100-point composite (weight × sub-score).
- Cash flow +30.0/30.0
- ARV discount +15.0/15.0
- 1% rule +10.0/10.0
- DSCR +10.0/10.0
- Appreciation +10.0/10.0
- Livability +3.9/5.0
- Schools +3.0/10.0
- Rent growth +2.5/5.0
- Condition / age +2.5/5.0
$190,000
🖨 Deal sheet (PDF) 📄 Offer letter ✓ Due diligence
Multi-family units
County records classify this as Multi-Family (2-4 Unit). Listing-text estimate: 2 units. confirmed
Listing remarks MLS
Come see this great 2 family with 3 bedrooms each unit - spacious rooms, 2nd floor A/C & washer/dryer. 1st floor washer/dryer in basement. Many improvements/ Replacement windows 10 yrs/ H2O tank 2 yrs/ Furnace 7 yrs/ Roof 10yrs/ Siding 3yrs. Separate utilities. New condenser in A/C 3yrs/ Off street parking for 4+ cars. Excellent for owner occupy or investment.
Key facts
- Immediate cash flow
- Recent updates
- 4,791 sq ft lot
Tags
Property features AI
Finance
- Financial info: Rental income: one unit at $1,200/month and one unit at $1,600/month
Exterior
- Utilities: Public water; Public sewer
- Home design: Duplex (residential income); Above-grade finished living space
- Construction: Vinyl siding; Block foundation
- Exterior features: Level lot; Shed(s)
Interior
- Bedrooms: Two 3-bedroom units
- Flooring: Carpet; Hardwood; Tile
- Bathrooms: Two full bathrooms (one in each unit)
- Heating & cooling: Forced air heating; Central air; Wall/window AC units
- Interior features: Insulated windows; Gas water heater; Has basement
Neighborhood map
What this means for you Summary
Snapshot
- This is a 2 × 3-bed/1.0-bath units multifamily listed at $190k.
Deal economics
- At list price, monthly cash flow is $954 ($11k/yr) — positive. Per door: $477/mo.
- The deal already cash-flows at list — no discount required.
- Meets the 1% rule at list price ($3k rent vs $190k).
- Recommended offer: $184k (3.0% below list) — sets the bar for market timing.
Location & tenants
- Location reads 78/100 on livability (#174 in NY, #2,710 nationally) — a middle-class / working-renter tenant base. Strengths: amenities A+, commute A+, cost of living A+; Watch: crime F, employment F.
- Binghamton City School District (urban): math 30% / reading 44% proficiency, ranked #557 of 590 in NY (top 94%) — families likely to look elsewhere, expect single-tenant / working-renter base with shorter leases; 61% free/reduced lunch — lower-income household profile, screen leases tightly.
- Zoned schools: Macarthur School (math 17% / reading 37%, grade F, #1,786 of 2,108 statewide, top 86%, 398 students, 62% FRL); Binghamton High School (math 71% / reading 79%, grade A-, #631 of 1,100 statewide, top 58%, 1,341 students, 69% FRL) — zoned schools at 65% FRL track the district average.
- Zoned-school proficiency averages 51% at this address vs 37% district-wide (+14 pts) — the actual schools serving this property are materially stronger than the Binghamton City School District average implies; a family-tenant draw the district grade alone would hide.
- Market conditions: 113 active listings in the ZIP; 5 comparable units currently listed for rent nearby; rentals lingering (median 46d on market — plan ~5-8 weeks vacancy on turnover, expect pricing pressure); 80% of comp listings sitting > 30 days — soft ceiling on asking rent; 340 units permitted in Broome County in 2024 (269 in 5+ unit buildings).
Forward outlook
- In year one you build about $20k of equity ($1k loan paydown + $19k appreciation (10.0% local appreciation)).
- Broome County population projected at -13% by 2050 — secular population decline; favor cash flow + early exit over multi-decade hold.
- At projected returns (10.0% appreciation + 3.0% rent growth), your $53k cash investment doubles in ~2 years — after that, you're playing with house money.
- By year 2, paydown + projected appreciation supports a ~$33k cash-out refi (75% LTV) — recoverable capital for the next deal without selling this one.
Negotiation context
- It's been on market 52 days — a 3% lower offer ($184k) is reasonable based on typical stale-listing flexibility.
- 3 sale attempts since 5y ago with the ask held roughly flat each time — persistent listings suggest the price (not the market) is what's stuck; bring a comps-based counter.
- Current owner paid $100k; list at $190k implies a 90% gain — meaningful room to come down on a strong offer.
Risks & watch-outs
- Watch-outs: property tax is 2.9% of price; built in 1900 — expect roof / HVAC / electrical / plumbing capex.
Questions for the listing agent
- It's been on market 52 days. Have you received any prior offers? Is the seller open to a 3% concession, seller financing, or rate buy-down credit?
- Can we see the unit-by-unit rent roll, current vacancy, and any below-market leases? What's the average tenancy length?
- What capital expenditures (roof, boiler, parking lot, exteriors) have been made in the last 5 years, and what's planned in the next 2?
- Built in 1900 — when were the roof, HVAC, electrical panel, plumbing, and water heater last replaced?
- Property tax is high relative to price — has the assessment been appealed recently, and will the sale trigger a re-assessment?
- Is there a deadline driving the sale (1031 exchange, divorce, estate, relocation)? That informs how much negotiation room exists.
- Schools are D-rated, which usually means shorter tenancies and higher turnover. Who's the typical renter profile here, and what's been the actual vacancy rate?
- Crime grade is F in this area — have there been break-ins, vandalism, or insurance claims at this property in the last 3 years? What carrier currently insures it and at what premium?
- What's the average days-on-market for RENTAL listings here right now (not sales)? A rising rental-DOM trend means longer vacancies and softer asking-rent achievability than the comps imply.
- What's the recent tenant-quality profile in this submarket — average credit score on applications, eviction rate, late-payment / NSF rate, and stable-employment percentage? A property-management company in the area should have these aggregated.
- How much new apartment / multifamily construction is in the pipeline within 1–3 miles? Heavy new supply (>2% of stock underway) typically softens rents 12–24 months out; light construction supports rent growth.
Investment metrics
- 1% rule
- 1.66% ✓
- Cap rate
- 12.32%
- Cash-on-cash
- 21.52%
- DSCR
- 1.96
- GRM
- 5.0
CMA / ARV
- ARV (median comp)
- $302,471
- List price
- $190,000
- Delta
- -37.18%
- Verdict
- UNDERPRICED
- Comps
- 20 within 1.0 mi
Show comp detail 10 sales within ~0.75 mi
| Address | Dist | Beds/Ba | Sqft | Sold | Price | $/sf | Match |
|---|---|---|---|---|---|---|---|
| 60 Mary St | 0.06mi | 6/3.0 (+1) | 2,632 (-5%) | 3mo | $252,128 | $96 | 77 |
| 17 Mitchell Ave | 0.05mi | 6/2.5 (+1) | 2,628 (-5%) | 23mo | $185,000 | $70 | 62 |
| 19 Mcnamara Ave | 0.48mi | 5/2.0 | 2,688 (-3%) | 13mo | $200,000 | $74 | 62 |
| 129 Pennsylvania Ave | 0.49mi | 6/3.0 (+1) | 2,742 (-1%) | 6mo | $175,000 | $64 | 61 |
| 5 Mill St | 0.46mi | 6/2.0 (+1) | 2,485 (-10%) | 1mo | $220,000 | $89 | 55 |
| 114 Conklin Ave | 0.58mi | 5/4.0 | 2,822 (+2%) | 10mo | $176,000 | $62 | 54 |
| 51 Murray St | 0.68mi | 6/2.0 (+1) | 2,970 (+7%) | 6mo | $160,000 | $54 | 47 |
| 62 Conklin Ave | 0.37mi | 6/5.0 (+1) | 2,520 (-9%) | 16mo | $250,000 | $99 | 37 |
| 33 Oak St | 0.62mi | 5/4.0 | 3,044 (+10%) | 21mo | $330,000 | $108 | 30 |
| 34 Oak St | 0.59mi | 4/2.0 (-1) | 2,380 (-14%) | 23mo | $272,000 | $114 | 24 |
Match score weights: distance 35% · size 25% · config 20% · recency 20%. Top-matched comps best support the ARV.
Projected returns pro-forma
10.0% appreciation · 3.0% rent growth · sell at horizon
- IRR
- 40.4%
- Equity multiple
- 4.09×
- Total profit
- $164,428
- Equity at exit
- $171,167
- IRR
- 34.9%
- Equity multiple
- 9.21×
- Total profit
- $436,787
- Equity at exit
- $369,128
Cash invested: $53,200 (down + closing). Projections, not guarantees.
Landlord ↔ Tenant lean methodology
- Overall (STATE)
- 15 Strongly Tenant-Friendly
- State New York
- 15 Strongly Tenant-Friendly · D+10
- County
- — inherits STATE
- City
- — inherits STATE
ZIP-level market 13903
- Home prices YoY
- 4.3%
- Active inventory
- 113
- Price-to-rent
- 10.1×
Monthly cashflow live
- Estimated rent
- $3,146 high interval (Pro) →
- Mortgage (P&I)
- −$996
- Tax from tax record
- −$456 /mo · $5,468/yr
- Insurance
- −$79
- HOA
- −$0
- Lot rent
- −$0
- Vacancy / Maint / Mgmt
- −$661
- Net cashflow
- $954
Break-even live
Sensitivity live
| Price | -10% $1,062 | -5% $1,008 | +0% $954 | +5% $900 | +10% $847 |
|---|---|---|---|---|---|
| Rent | -10% $706 | -5% $830 | +0% $954 | +5% $1,078 | +10% $1,203 |
| Rate | -1.0pp $1,050 | -0.5pp $1,002 | base $954 | +0.5pp $905 | +1.0pp $855 |
2-unit breakdown (identical units grouped — click to expand)
| Units | Beds | Baths | Est. rent |
|---|---|---|---|
| 2× units | 3 | 1 | $3,146 |
| #1 | 3 | 1 | $1,573 |
| #2 | 3 | 1 | $1,573 |
| Total (2 units) | $3,146 | ||
UW: 25.0% down · 7.5% · 30yr · 1.5% tax · 5.0% vac · 8.0% maint · 8.0% mgmt
Financing live
Cash to close
- Down payment
- $47,500
- Closing costs
- $5,700
- Reserves months
- —
- Total cash needed
- —
Loan-product check · same deal, 3 products live
Conventional
25% down · 7.5% · 30yr
- Down + closing
- —
- Monthly P&I
- —
- Monthly cashflow
- —
- DSCR
- —
- Eligible?
- —
Personal DTI + credit; lowest rate.
DSCR
20% down · 8.5% · 30yr
- Down + closing
- —
- Monthly P&I
- —
- Monthly cashflow
- —
- DSCR
- —
- Eligible?
- —
No personal income docs; deal must DSCR.
Hard money
10% down · 12.0% · 12mo
- Down + closing
- —
- Monthly P&I
- —
- Monthly cashflow
- —
- DSCR
- —
- Eligible?
- —
Short-term bridge; refi at stabilization.
Rent comps 5 comps
| Address | Beds | Baths | Sqft | Rent | $/sqft | DOM | Units | Dist |
|---|---|---|---|---|---|---|---|---|
| 90 Conklin Ave Binghamton, NY | 5.0 | 2.0 | 2000 | $575 | $0.29 | 15d | 1 | 0.46mi |
| 13 Chapin St Binghamton, NY | 4.0 | 3.0 | 2452 | $4,000 | $1.63 | 46d | 1 | 0.64mi |
| 22 Ayres St Binghamton, NY | 4.0 | 2.0 | 2333 | $2,560 | $1.10 | 46d | 1 | 0.75mi |
| 2 Chapel Pl Binghamton, NY | 6.0 | 3.0 | 2600 | $650 | $0.25 | 46d | 1 | 0.78mi |
| 16 North St Unit 1-1 Binghamton, NY | 5.0 | 2.0 | 2600 | $650 | $0.25 | 46d | 1 | 0.99mi |
Listing history 23 events
-
2026-06-23days on market $190,000 Active 52 DOM
-
2026-06-21days on market $190,000 Active 51 DOM
-
2026-06-19days on market $190,000 Active 49 DOM
-
2026-06-18days on market $190,000 Active 48 DOM
-
2026-06-17days on market $190,000 Active 47 DOM
-
2026-06-16days on market $190,000 Active 46 DOM
-
2026-06-15days on market $190,000 Active 45 DOM
-
2026-06-14days on market $190,000 Active 43 DOM
-
2026-06-13days on market $190,000 Active 42 DOM
-
2026-06-10days on market $190,000 Active 40 DOM
-
2026-06-09days on market $190,000 Active 39 DOM
-
2026-06-08days on market $190,000 Active 38 DOM
-
2026-06-07days on market $190,000 Active 37 DOM
-
2026-06-03days on market $190,000 Active 33 DOM
-
2026-06-02days on market $190,000 Active 32 DOM
-
2026-06-01days on market $190,000 Active 31 DOM
-
2026-05-31days on market $190,000 Active 30 DOM
-
2026-05-30days on market $190,000 Active 29 DOM
-
2026-05-04status Active 912-char remark
-
2026-04-27$190,000 Active 912-char remark
-
2022-01-12soldstatus $100,000
-
2021-12-28soldstatus $100,000 368-char remark
Show marketing remark (368 chars)
Come see this great 2 family with 3 bedrooms each unit - spacious rooms, 2nd floor A/C & washer/dryer. 1st floor washer/dryer in basement. Many improvements/ Replacement windows 10 yrs/ H2O tank 2 yrs/ Furnace 7 yrs/ Roof 10yrs/ Siding 3yrs. Separate utilities. New condenser in A/C 3yrs/ Off street parking for 4+ cars. Excellent for owner occupy or investment.
-
2021-08-10$115,900 368-char remark
Show marketing remark (368 chars)
Come see this great 2 family with 3 bedrooms each unit - spacious rooms, 2nd floor A/C & washer/dryer. 1st floor washer/dryer in basement. Many improvements/ Replacement windows 10 yrs/ H2O tank 2 yrs/ Furnace 7 yrs/ Roof 10yrs/ Siding 3yrs. Separate utilities. New condenser in A/C 3yrs/ Off street parking for 4+ cars. Excellent for owner occupy or investment.
ⓘ Source: listings_history table (triggers on properties + properties_extension) + one-shot
backfill from property_details.listing_events for pre-trigger history.
Tax reassessment forecast NY · Partial reset (capped growth)
- Current annual tax
- $5,468 · $456/mo
- Projected year-2 tax
- $5,468 · $456/mo
- Expected delta
- $0/yr ($0/mo · 0.0%)
ⓘ Screening estimate from a state-policy table — verify with the county assessor before closing.
Climate risk First Street
- Flood 3/10 Moderate FEMA zone X · 13% chance over 30 yrs
- Wildfire 1/10 Low
- Heat 3/10 Moderate 7 d/yr ≥92°F today · 16 d/yr by 30 yrs out
- Wind 2/10 Low 100% chance of damaging wind over 30 yrs
- Air quality 2/10 Low 0 unhealthy d/yr today · 1 by 30 yrs out
Nearby sold comps map
Loading sold comps map…
Walkable amenities ~0.75 mi
Loading nearby amenities…
Taxation est. · year 1
- Rental income
- $37,752
- − Mortgage interest
- −$10,643
- − Property taxes
- −$5,468
- − Insurance
- −$950
- − Repairs & maintenance
- −$3,020
- − Management
- −$3,020
- − Depreciation
- −$5,527
- Taxable income
- $9,123
- Est. tax owed @ 24.0%
- −$2,190
- After-tax cash flow
- $9,260/yr
For passive investors: Depreciation is non-cash, so a rental often shows a tax loss while cash-flowing — sheltering income. Rental losses are passive: they offset passive income freely, and up to $25,000/yr can offset ordinary (W-2) income if you actively participate and your MAGI is under $100k (phasing out to $0 by $150k); unused losses carry forward. On sale, claimed depreciation is recaptured at up to 25%, and gains may owe capital-gains tax (a 1031 exchange can defer both). Figures are a year-1 estimate at your 24.0% rate — not tax advice; consult a CPA.
Schools (NCES district)
- District
- Binghamton City School District
- NCES district ID
- 3604870
- Math proficiency
- 30% ▬ 0.00%
- Reading proficiency
- 44% ▲ 15.00%
- Median HH income
- $30,475
- Composite
- 30.09/100
- National rank
- #6342
- State rank
- #557 of 590 in NY
Livability — Binghamton
- Score
- 78/100
- State rank
- #174
- US rank
- #2710
Category grades
Schools grade is shown separately in the Schools card above.
Census & demographics
- Census place
- Binghamton, NY
- County
- Broome County · 126,805 people
- City population
- 65,170
- Metro
- Binghamton, NY
- Population (ZIP)
- 17,569
- Household income
- $66,278
- Rent vs Own
- Severe rent burden
- 602.0
Population outlook (Broome County) Hauer SSP2
- Today (2025)
- 187,989 people
- By 2030
- 183,066 · -2.6%
- By 2040
- 172,228 · -8.4%
- By 2050
- 163,161 · -13.2%
- By 2075
- 153,641 · -18.3%
- By 2100
- 140,851 · -25.1%
Race, ethnicity, and origin ACS 2023
- Neighborhood character
- Predominantly White (80%)
- Race & ethnicity
- White 80% Black 9% Two or more races 6% Hispanic / Latino 4% Asian 1%
- Common ancestry
- Romanian 6% Slovak 2% Scotch-Irish 2%
- Foreign-born
- 5% · Canada
- Languages at home
- 94% English-only · Spanish 2% Other Indo-European 1% Arabic 1%
Political lean MEDSL · Broome
- 2024 margin
- Toss-up / Even · D 50.2% · R 49.8%
- 2008→2024 swing
- -7.6pp toward R · 2008: 8.0pp · 2024: 0.4pp
- All cycles
- 2024: D+0.4 2020: D+3.5 2016: R+3.7 2012: D+4.6 2008: D+8.0
Not yet ingested
- Civics
- —
Market trends
- HPI YoY
- ▲ 11.68%
- Current HPI
- 286.1001
- Rent YoY
- —
- Metro
- Binghamton, NY
- State GDP YoY
- ▲ 2.60%
- F500 in state
- 92
Industry mix (Fortune 500 HQ in NY)
| Industry | F500 HQs | Revenue |
|---|---|---|
| Financial Services | 10 | $950B |
|
||
| Consumer Goods | 9 | $162B |
|
||
| Insurance | 4 | $225B |
|
||
| Telecommunications | 2 | $144B |
|
||
| Pharmaceuticals | 2 | $112B |
|
||
| Media / Entertainment | 2 | $69B |
|
||
Price history
+63.9% since first listed5 events — show timeline
- 2026-05-04 Relisted — GBAOR
- 2026-04-27 Listed $190,000 GBAOR
- 2022-01-12 Sold (Public Records) $100,000 Public Records
- 2021-12-28 Sold (MLS) $100,000 GBAOR
- 2021-08-10 Listed $115,900 GBAOR
Property tax history
+4.7%/yrLatest (2025): $5,468 · +0.9% YoY. Source: county tax records.
Cash-flow waterfall
monthlySold comps — $/sqft
last 12 mo · ≤1 miLoading sold comps…