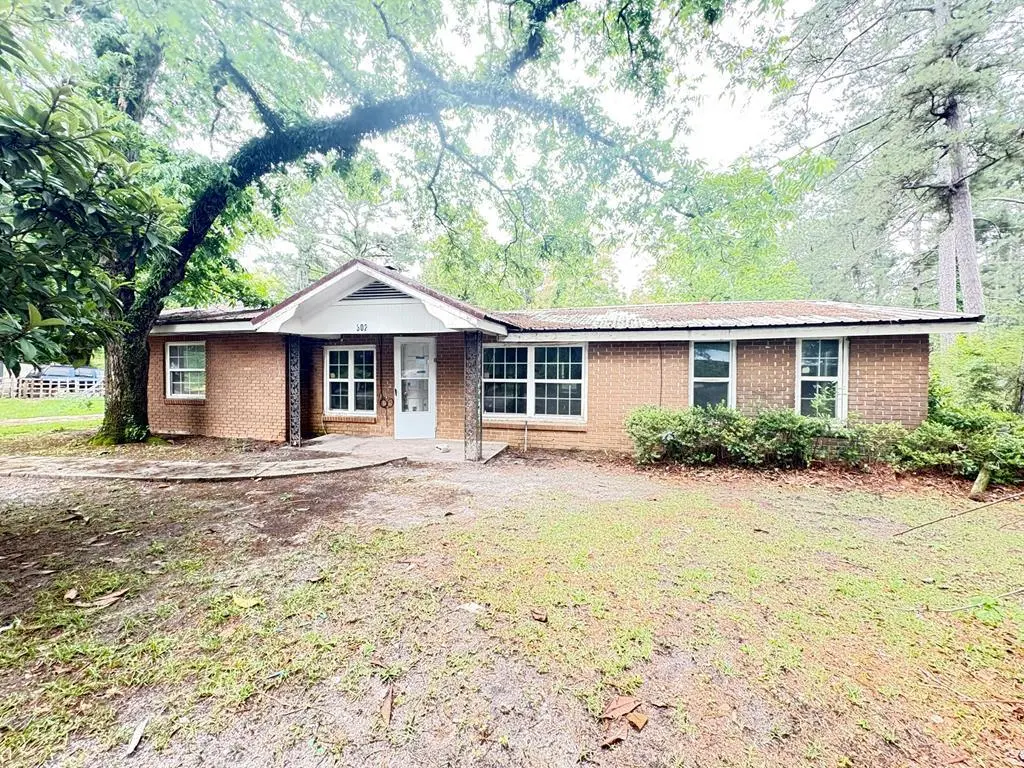
302 E Lovett St · Sparks, GA
Flood risk 1/10 · Minimal
- FEMA flood zone
- X (unshaded)
- Chance of flooding over 30 yrs
- 0.0%
- Est. flood insurance / yr
- $507 – $1,088
Fire risk 7/10 · Major
- Est. fire insurance / yr
- $963 – $1,789
Heat risk 7/10 · Major
- Hot days now (above 109°F)
- 7 days/yr
- Hot days in 30 yrs
- 18 days/yr
Wind risk 8/10 · Major
- Chance of severe wind over 30 yrs
- 99.0%
Air-quality risk 6/10 · Moderate
- Unhealthy air days now
- 10 days/yr
- Unhealthy air days in 30 yrs
- 11 days/yr
Risk factors via First Street. Map © Google.
Why this score? — see what drove the B grade
The composite is a weighted blend of 9 inputs, each scored 0–100. Each bar is that input's sub-score; the figure is the points it added to the 100-point composite (weight × sub-score).
- Cash flow +30.0/30.0
- 1% rule +10.0/10.0
- DSCR +10.0/10.0
- ARV discount +7.5/15.0
- Appreciation +3.9/10.0
- Livability +3.2/5.0
- Rent growth +2.5/5.0
- Condition / age +2.5/5.0
- Schools +2.3/10.0
$47,500
🖨 Deal sheet (PDF) 📄 Offer letter ✓ Due diligence
Listing remarks MLS
Great 3 bed/2 bath property in the heart of Sparks! Living room with fireplace. Kitchen/dining room combo. Large lot with exterior storage building. Seller Pays: Buyer uses Premium Title Services, the seller's preferred title partner and closing agent. This lets the buyer bypass the title insurance fee, related search costs and reduced escrow/ settlement fees, since the seller will cover those charges. The average charges for title search and insurance is $1225 & escrow/ settlement fees is $875, resulting in an overall savings of ~$1660 for buyers, who opt for Premium Title Services.
Key facts
- Large lot
- 0.45 acre lot
- Listed 36 days
Tags
Property features AI
Exterior
- Utilities: Public water; Public sewer
- Home design: Single-family residence; One story; Residential property (house); Zoned R3
- Construction: Brick veneer construction
- Exterior features: Shingle roof; Irregular lot
Interior
- Flooring: Vinyl
- Bathrooms: 2 full bathrooms
- Interior features: Vinyl flooring
Neighborhood map
What this means for you Summary
Snapshot
- This is a 3-bed/2.0-bath single-family listed at $48k.
Deal economics
- At list price, monthly cash flow is $658 ($8k/yr) — positive.
- The deal already cash-flows at list — no discount required.
- Meets the 1% rule at list price ($1k rent vs $48k).
- Recommended offer: $46k (3.0% below list) — sets the bar for market timing.
Location & tenants
- Location reads 65/100 on livability (#225 in GA) — a middle-class / working-renter tenant base. Strengths: cost of living A+, housing A+, health & safety A+; Watch: amenities F, commute F, employment F.
- Cook County (rural): math 29% / reading 27% proficiency, ranked #111 of 174 in GA (top 64%) — low school quality limits family demand, transient renter base, plan for 1-2y turnover; 63% free/reduced lunch — lower-income household profile, screen leases tightly.
- Zoned schools: Cook Primary School (839 students, 83% FRL); Cook County Middle School (math 27% / reading 25%, grade F, #286 of 470 statewide, top 61%, 714 students, 67% FRL); Cook High School (math 32% / reading 39%, grade F, #81 of 424 statewide, top 19%, 909 students, 67% FRL).
- Market conditions: 6 active listings in the ZIP; 47 units permitted in Cook County in 2024 (0 in 5+ unit buildings).
Forward outlook
- Local home prices are declining (-2.2%/yr); year-one equity from $328 of loan paydown is wiped out by about $1k of value loss. Plan a longer hold.
- Cook County population projected to shrink 8% by 2050 — rents likely to lag national; underwrite the cash flow, not the appreciation.
- At projected returns (-2.2% appreciation + 3.0% rent growth), your $13k cash investment doubles in ~2 years — after that, you're playing with house money.
Negotiation context
- It's been on market 36 days — a 3% lower offer ($46k) is reasonable based on typical stale-listing flexibility.
- 2 sale attempts; this cycle's ask has dropped $2k (5%) from the opening price — seller is motivated, your offer sets the floor, not the list.
Risks & watch-outs
- Watch-outs: built in 1954 — expect roof / HVAC / electrical / plumbing capex.
- Climate carrying-cost: severe wind risk, 99% chance of damaging wind over 30y; major wildfire risk; extreme-heat days projected 7→18/yr by 2055 (HVAC capex compounding) — expect insurance premiums to compound above CPI over the hold.
Questions for the listing agent
- It's been on market 36 days. Have you received any prior offers? Is the seller open to a 3% concession, seller financing, or rate buy-down credit?
- Built in 1954 — when were the roof, HVAC, electrical panel, plumbing, and water heater last replaced?
- Is there a deadline driving the sale (1031 exchange, divorce, estate, relocation)? That informs how much negotiation room exists.
- Schools are F-rated, which usually means shorter tenancies and higher turnover. Who's the typical renter profile here, and what's been the actual vacancy rate?
- What's the average days-on-market for RENTAL listings here right now (not sales)? A rising rental-DOM trend means longer vacancies and softer asking-rent achievability than the comps imply.
- What's the recent tenant-quality profile in this submarket — average credit score on applications, eviction rate, late-payment / NSF rate, and stable-employment percentage? A property-management company in the area should have these aggregated.
- How much new for-sale + rental construction is in the pipeline within 1–3 miles? Heavy new supply typically softens prices + rents 12–24 months out; constrained supply supports both.
Investment metrics
- 1% rule
- 2.57% ✓
- Cap rate
- 22.91%
- Cash-on-cash
- 59.34%
- DSCR
- 3.64
- GRM
- 3.2
CMA / ARV
- ARV (median comp)
- $111,806
- List price
- $47,500
- Delta
- -57.52%
- Verdict
- UNDERPRICED
- Comps
- 16 within 1.0 mi
Show comp detail 1 sale within ~0.75 mi
| Address | Dist | Beds/Ba | Sqft | Sold | Price | $/sf | Match |
|---|---|---|---|---|---|---|---|
| 104 Janet St | 0.73mi | 3/1.0 | 1,325 (-11%) | 12mo | $160,000 | $121 | 35 |
Match score weights: distance 35% · size 25% · config 20% · recency 20%. Top-matched comps best support the ARV.
Projected returns pro-forma
-2.2% appreciation · 3.0% rent growth · sell at horizon
- IRR
- 58.8%
- Equity multiple
- 3.69×
- Total profit
- $35,793
- Equity at exit
- $8,784
- IRR
- 62.9%
- Equity multiple
- 7.51×
- Total profit
- $86,533
- Equity at exit
- $7,090
Cash invested: $13,300 (down + closing). Projections, not guarantees.
Landlord ↔ Tenant lean methodology
- Overall (STATE)
- 90 Strongly Landlord-Friendly
- State Georgia
- 90 Strongly Landlord-Friendly · R+3
- County
- — inherits STATE
- City
- — inherits STATE
ZIP-level market 31647
- Home prices YoY
- -1.4%
- Active inventory
- 6
- Price-to-rent
- 3.2×
Monthly cashflow live
- Estimated rent
- $1,220 medium interval (Pro) →
- Mortgage (P&I)
- −$249
- Tax from tax record
- −$37 /mo · $450/yr
- Insurance
- −$20
- HOA
- −$0
- Vacancy / Maint / Mgmt
- −$256
- Net cashflow
- $658
Break-even live
Sensitivity live
| Price | -10% $685 | -5% $671 | +0% $658 | +5% $644 | +10% $631 |
|---|---|---|---|---|---|
| Rent | -10% $561 | -5% $609 | +0% $658 | +5% $706 | +10% $754 |
| Rate | -1.0pp $682 | -0.5pp $670 | base $658 | +0.5pp $645 | +1.0pp $633 |
UW: 25.0% down · 7.5% · 30yr · 1.5% tax · 5.0% vac · 8.0% maint · 8.0% mgmt
Financing live
Cash to close
- Down payment
- $11,875
- Closing costs
- $1,425
- Reserves months
- —
- Total cash needed
- —
Loan-product check · same deal, 3 products live
Conventional
25% down · 7.5% · 30yr
- Down + closing
- —
- Monthly P&I
- —
- Monthly cashflow
- —
- DSCR
- —
- Eligible?
- —
Personal DTI + credit; lowest rate.
DSCR
20% down · 8.5% · 30yr
- Down + closing
- —
- Monthly P&I
- —
- Monthly cashflow
- —
- DSCR
- —
- Eligible?
- —
No personal income docs; deal must DSCR.
Hard money
10% down · 12.0% · 12mo
- Down + closing
- —
- Monthly P&I
- —
- Monthly cashflow
- —
- DSCR
- —
- Eligible?
- —
Short-term bridge; refi at stabilization.
Listing history 18 events
-
2026-06-19status $47,500 Pending 36 DOM
-
2026-06-18days on market $47,500 Active 36 DOM
-
2026-06-17days on market $47,500 Active 35 DOM
-
2026-06-16days on market $47,500 Active 34 DOM
-
2026-06-15days on market $47,500 Active 33 DOM
-
2026-06-14days on market $47,500 Active 31 DOM
-
2026-06-12days on market $47,500 Active 30 DOM
-
2026-06-09pricedays on market $47,500 Active 27 DOM
Show marketing remark (596 chars)
Great 3 bed/2 bath property in the heart of Sparks! Living room with fireplace. Kitchen/dining room combo. Large lot with exterior storage building. Seller Pays: Buyer uses Premium Title Services, the seller's preferred title partner and closing agent. This lets the buyer bypass the title insurance fee, related search costs and reduced escrow/ settlement fees, since the seller will cover those charges. The average charges for title search and insurance is $1225 & escrow/ settlement fees is $875, resulting in an overall savings of ~$1660 for buyers, who opt for Premium Title Services.
-
2026-06-08days on market $50,000 Active 26 DOM
-
2026-06-07days on market $50,000 Active 25 DOM
-
2026-06-05days on market $50,000 Active 23 DOM
-
2026-06-03days on market $50,000 Active 21 DOM
-
2026-06-02days on market $50,000 Active 20 DOM
-
2026-06-01days on market $50,000 Active 19 DOM
-
2026-05-31days on market $50,000 Active 18 DOM
-
2026-05-30days on market $50,000 Active 17 DOM
-
2026-05-13$50,000 Active 597-char remark
Show marketing remark (596 chars)
Great 3 bed/2 bath property in the heart of Sparks! Living room with fireplace. Kitchen/dining room combo. Large lot with exterior storage building. Seller Pays: Buyer uses Premium Title Services, the seller's preferred title partner and closing agent. This lets the buyer bypass the title insurance fee, related search costs and reduced escrow/ settlement fees, since the seller will cover those charges. The average charges for title search and insurance is $1225 & escrow/ settlement fees is $875, resulting in an overall savings of ~$1660 for buyers, who opt for Premium Title Services.
-
2026-05-13$50,000 Active 596-char remark
Show marketing remark (596 chars)
Great 3 bed/2 bath property in the heart of Sparks! Living room with fireplace. Kitchen/dining room combo. Large lot with exterior storage building. Seller Pays: Buyer uses Premium Title Services, the seller's preferred title partner and closing agent. This lets the buyer bypass the title insurance fee, related search costs and reduced escrow/ settlement fees, since the seller will cover those charges. The average charges for title search and insurance is $1225 & escrow/ settlement fees is $875, resulting in an overall savings of ~$1660 for buyers, who opt for Premium Title Services.
ⓘ Source: listings_history table (triggers on properties + properties_extension) + one-shot
backfill from property_details.listing_events for pre-trigger history.
Tax reassessment forecast GA · Resets to sale price
- Current annual tax
- $450 · $37/mo
- Projected year-2 tax
- $450 · $37/mo
- Expected delta
- $0/yr ($0/mo · 0.0%)
ⓘ Screening estimate from a state-policy table — verify with the county assessor before closing.
Climate risk First Street
- Flood 1/10 Low FEMA zone X (unshaded) · 0% chance over 30 yrs
- Wildfire 7/10 Severe
- Heat 7/10 Severe 7 d/yr ≥109°F today · 18 d/yr by 30 yrs out
- Wind 8/10 Severe 99% chance of damaging wind over 30 yrs
- Air quality 6/10 Major 10 unhealthy d/yr today · 11 by 30 yrs out
Nearby sold comps map
Loading sold comps map…
Walkable amenities ~0.75 mi
Loading nearby amenities…
Taxation est. · year 1
- Rental income
- $14,643
- − Mortgage interest
- −$2,661
- − Property taxes
- −$450
- − Insurance
- −$238
- − Repairs & maintenance
- −$1,171
- − Management
- −$1,171
- − Depreciation
- −$1,382
- Taxable income
- $7,570
- Est. tax owed @ 24.0%
- −$1,817
- After-tax cash flow
- $6,075/yr
For passive investors: Depreciation is non-cash, so a rental often shows a tax loss while cash-flowing — sheltering income. Rental losses are passive: they offset passive income freely, and up to $25,000/yr can offset ordinary (W-2) income if you actively participate and your MAGI is under $100k (phasing out to $0 by $150k); unused losses carry forward. On sale, claimed depreciation is recaptured at up to 25%, and gains may owe capital-gains tax (a 1031 exchange can defer both). Figures are a year-1 estimate at your 24.0% rate — not tax advice; consult a CPA.
Schools (NCES district)
- District
- Cook County
- NCES district ID
- 1301470
- Math proficiency
- 29% ▼ -3.00%
- Reading proficiency
- 27% ▼ -5.00%
- Median HH income
- $35,135
- Composite
- 23.14/100
- National rank
- #7951
- State rank
- #111 of 174 in GA
Livability — Sparks
- Score
- 65/100
- State rank
- #225
- US rank
- #13214
Category grades
Schools grade is shown separately in the Schools card above.
Census & demographics
- Census place
- Sparks, GA
- Population (ZIP)
- 3,064
Population outlook (Cook County) Hauer SSP2
- Today (2025)
- 16,984 people
- By 2030
- 16,800 · -1.1%
- By 2040
- 16,343 · -3.8%
- By 2050
- 15,696 · -7.6%
- By 2075
- 13,451 · -20.8%
- By 2100
- 10,357 · -39.0%
Race, ethnicity, and origin ACS 2023
- Neighborhood character
- Diverse neighborhood (Simpson 0.59)
- Race & ethnicity
- Black 47% White 41% Hispanic / Latino 10% Two or more races 3% Native American 1%
- Hispanic origin (detail)
- Mexican 10%
- Foreign-born
- 3% · Canada, China
- Languages at home
- 92% English-only · Spanish 8%
Political lean MEDSL · Cook
- 2024 margin
- Solid R (+46.5) · D 26.6% · R 73.0%
- 2008→2024 swing
- -17.5pp toward R · 2008: -28.9pp · 2024: -46.5pp
- All cycles
- 2024: R+46.5 2020: R+40.4 2016: R+40.1 2012: R+31.4 2008: R+28.9
Not yet ingested
- Civics
- —
Market trends
- HPI YoY
- ▼ -2.20%
- Current HPI
- 157.7159
- Rent YoY
- —
- Metro
- —
- State GDP YoY
- ▲ 2.66%
- F500 in state
- 28
Industry mix (Fortune 500 HQ in GA)
| Industry | F500 HQs | Revenue |
|---|---|---|
| Paper / Packaging | 2 | $29B |
|
||
| Retail | 1 | $160B |
|
||
| Transportation / Logistics | 1 | $91B |
|
||
| Airlines | 1 | $62B |
|
||
| Consumer Goods | 1 | $47B |
|
||
| Utilities | 1 | $25B |
|
||
Price history
-5.0% since first listed4 events — show timeline
- 2026-06-09 Price Changed $47,500 SGMLS
- 2026-06-09 Price Changed $47,500 MBOR
- 2026-05-13 Listed $50,000 MBOR
- 2026-05-13 Listed $50,000 SGMLS
Property tax history
+3.6%/yrLatest (2025): $450 · -4.1% YoY. Source: county tax records.
Cash-flow waterfall
monthlySold comps — $/sqft
last 12 mo · ≤1 miLoading sold comps…