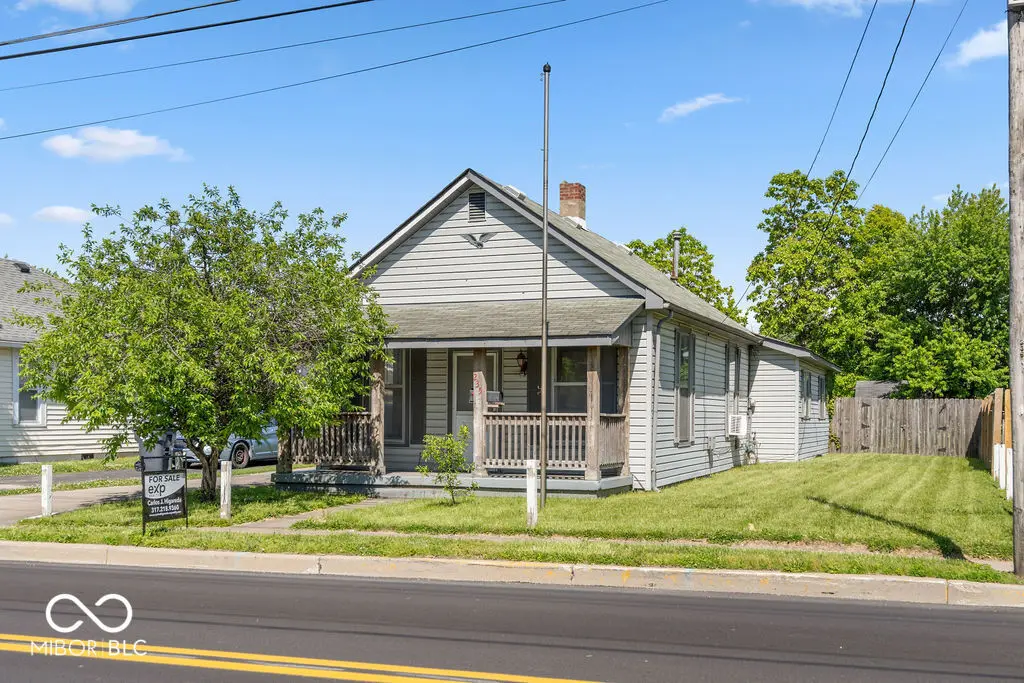
235 N Meridian St · Greenwood, IN
Flood risk 1/10 · Minimal
- FEMA flood zone
- X (unshaded)
- Chance of flooding over 30 yrs
- 0.0%
- Est. flood insurance / yr
- $507 – $1,088
Fire risk 1/10 · Minimal
- Est. fire insurance / yr
- $717 – $1,331
Heat risk 4/10 · Minor
- Hot days now (above 101°F)
- 7 days/yr
- Hot days in 30 yrs
- 19 days/yr
Wind risk 2/10 · Minimal
- Chance of severe wind over 30 yrs
- 1.0%
Air-quality risk 2/10 · Minimal
- Unhealthy air days now
- 2 days/yr
- Unhealthy air days in 30 yrs
- 2 days/yr
Risk factors via First Street. Map © Google.
Why this score? — see what drove the D grade
The composite is a weighted blend of 9 inputs, each scored 0–100. Each bar is that input's sub-score; the figure is the points it added to the 100-point composite (weight × sub-score).
- Cash flow +14.9/30.0
- ARV discount +7.0/15.0
- DSCR +4.6/10.0
- 1% rule +4.0/10.0
- Schools +4.0/10.0
- Livability +3.7/5.0
- Rent growth +3.0/5.0
- Condition / age +2.5/5.0
- Appreciation +0.0/10.0
$199,900
🖨 Deal sheet (PDF) 📄 Offer letter ✓ Due diligence
Listing remarks
Welcome Home! 3 Bedroom Home on . 23 Acre Lot with Full Fenced in Backyard and Oversized Detached Garage!
Key facts
- 0.23 acre lot
- 3 garage spots
- Built 1900
Property features AI
Finance
- Other: Property sits on approximately 0.23 acres (<1/4 acre)
Exterior
- Parking: Detached 3-car garage (720 sq ft)
- Utilities: Public water; Municipal sewer connected; Solid waste service available
- Home design: Single-family residence; One level; Fixer condition
- Construction: Aluminum siding; Crawl space foundation
- Exterior features: Covered porch/patio
Interior
- Kitchen: No appliances included
- Bedrooms: 3 bedrooms on the main level
- Bathrooms: 1 full bathroom
- Heating & cooling: Forced air heating; Central air conditioning
- Interior features: Attic access
Neighborhood map
What this means for you Summary
Snapshot
- This is a 4-bed/1.0-bath single-family listed at $200k.
Deal economics
- At list price, monthly cash flow is $58 ($698/yr) — positive.
- The deal already cash-flows at list — no discount required.
- To meet the 1% rule (rent ≥ 1% of price), the offer needs to be $179k (10.4% below list).
- Recommended offer: $179k (10.4% below list) — sets the bar for 1% rule.
- Cap rate 6.6% vs local median 4.5% in Greenwood — top-decile yield for the area; either an underpriced asset or a hidden risk that comps aren't pricing in. Stress-test before assuming the spread holds.
Location & tenants
- Location reads 73/100 on livability (#91 in IN) — a middle-class / working-renter tenant base. Strengths: cost of living A+, housing A+, crime A; Watch: amenities F, commute F, health & safety F.
- Greenwood Community School Corporation (suburban): math 41% / reading 52% proficiency, ranked #88 of 301 in IN (top 29%) — families likely to look elsewhere, expect single-tenant / working-renter base with shorter leases.
- Zoned schools: V O Isom Central Elem School (math 42% / reading 37%, grade F, #500 of 994 statewide, top 53%, 361 students, 70% FRL); Greenwood Middle School (math 36% / reading 52%, grade D, #87 of 330 statewide, top 27%, 948 students, 53% FRL); Greenwood Community High Sch (math 37% / reading 79%, grade C, #62 of 369 statewide, top 17%, 1,175 students, 43% FRL) — zoned schools average 56% FRL vs 38% district-wide (18 pts higher); higher-poverty schools than district average — tighter screening recommended.
- Market conditions: Rents rising (+1.9%/yr); 80 active listings in the ZIP; 11 comparable units currently listed for rent nearby; rentals leasing fast (median 13d on market — plan ~1-2 weeks tenant-placement turnaround); solid renter incomes; 1,133 units permitted in Johnson County in 2024 (0 in 5+ unit buildings).
Forward outlook
- Local home prices are declining (-3.0%/yr); year-one equity from $1k of loan paydown is wiped out by about $6k of value loss. Plan a longer hold.
- Johnson County population projected at +26% by 2050 — long-run rental-demand tailwind backs the buy-and-hold thesis.
Negotiation context
- Only 2 days on market — expect competitive offers; lowballing is unlikely to land.
- Current owner paid $155k; 29% above their basis — modest negotiation headroom, anchor on the comps not their cost.
Risks & watch-outs
- Watch-outs: built in 1900 — expect roof / HVAC / electrical / plumbing capex.
Questions for the listing agent
- Built in 1900 — when were the roof, HVAC, electrical panel, plumbing, and water heater last replaced?
- Is there a deadline driving the sale (1031 exchange, divorce, estate, relocation)? That informs how much negotiation room exists.
- Schools are B-rated — typically a magnet for longer-tenancy family renters. What's the average tenant stay here, and is there a school-zone premium baked into asking?
- The area grade is low — what's the realistic commute time and amenity access for the typical tenant pool here? Any planned neighborhood developments (good or bad) we should know about?
- What's the average days-on-market for RENTAL listings here right now (not sales)? A rising rental-DOM trend means longer vacancies and softer asking-rent achievability than the comps imply.
- What's the recent tenant-quality profile in this submarket — average credit score on applications, eviction rate, late-payment / NSF rate, and stable-employment percentage? A property-management company in the area should have these aggregated.
- How much new for-sale + rental construction is in the pipeline within 1–3 miles? Heavy new supply typically softens prices + rents 12–24 months out; constrained supply supports both.
Investment metrics
- 1% rule
- 0.90% ✗
- Cap rate
- 6.64%
- Cash-on-cash
- 1.25%
- DSCR
- 1.06
- GRM
- 9.3
CMA / ARV
- ARV (median comp)
- $197,781
- List price
- $199,900
- Delta
- 1.07%
- Verdict
- FAIR
- Comps
- 20 within 1.0 mi
Show comp detail 12 sales within ~0.75 mi
| Address | Dist | Beds/Ba | Sqft | Sold | Price | $/sf | Match |
|---|---|---|---|---|---|---|---|
| 235 N Meridian St | 0.00mi | 3/1.0 (-1) | 1,176 (0%) | 1mo | $155,000 | $132 | 94 |
| 51 N Brewer St | 0.20mi | 3/2.0 (-1) | 1,176 (0%) | 1mo | $235,000 | $200 | 81 |
| 520 Woodland Pl | 0.52mi | 3/1.5 (-1) | 1,242 (+6%) | 2mo | $230,000 | $185 | 58 |
| 629 Gooseberry Ln | 0.60mi | 5/1.5 (+1) | 1,248 (+6%) | 0mo | $199,900 | $160 | 55 |
| 608 Horton St | 0.38mi | 3/2.0 (-1) | 1,307 (+11%) | 2mo | $265,000 | $203 | 53 |
| 564 Northgate Dr | 0.71mi | 3/1.5 (-1) | 1,219 (+4%) | 1mo | $229,900 | $189 | 53 |
| 394 Polk Village Rd | 0.58mi | 3/2.0 (-1) | 1,133 (-4%) | 7mo | $225,000 | $199 | 52 |
| 604 Carol Dr | 0.46mi | 3/1.0 (-1) | 1,000 (-15%) | 4mo | $143,000 | $143 | 46 |
| 22 Sayre Dr | 0.70mi | 3/1.0 (-1) | 1,300 (+10%) | 2mo | $265,000 | $204 | 44 |
| 620 Carol Dr | 0.56mi | 3/1.5 (-1) | 1,000 (-15%) | 3mo | $230,000 | $230 | 39 |
| 290 Polk Manor Dr | 0.54mi | 3/2.0 (-1) | 1,332 (+13%) | 8mo | $251,000 | $188 | 37 |
| 633 Park Dr | 0.68mi | 3/1.5 (-1) | 1,325 (+13%) | 7mo | $219,000 | $165 | 35 |
Match score weights: distance 35% · size 25% · config 20% · recency 20%. Top-matched comps best support the ARV.
Projected returns pro-forma
-3.0% appreciation · 1.95% rent growth · sell at horizon
- IRR
- -15.5%
- Equity multiple
- 0.45×
- Total profit
- $-30,547
- Equity at exit
- $29,806
- IRR
- -8.8%
- Equity multiple
- 0.48×
- Total profit
- $-29,304
- Equity at exit
- $17,284
Cash invested: $55,972 (down + closing). Projections, not guarantees.
Landlord ↔ Tenant lean methodology
- Overall (STATE)
- 90 Strongly Landlord-Friendly
- State Indiana
- 90 Strongly Landlord-Friendly · R+11
- County
- — inherits STATE
- City
- — inherits STATE
ZIP-level market 46143
- Rents YoY
- 1.9%
- Active inventory
- 80
- Price-to-rent
- 9.3×
Monthly cashflow live
- Estimated rent
- $1,792 high interval (Pro) →
- Mortgage (P&I)
- −$1,048
- Tax from tax record
- −$226 /mo · $2,709/yr
- Insurance
- −$83
- HOA
- −$0
- Vacancy / Maint / Mgmt
- −$376
- Net cashflow
- $58
Break-even live
Sensitivity live
| Price | -10% $171 | -5% $115 | +0% $58 | +5% $2 | +10% $-55 |
|---|---|---|---|---|---|
| Rent | -10% $-83 | -5% $-13 | +0% $58 | +5% $129 | +10% $200 |
| Rate | -1.0pp $159 | -0.5pp $109 | base $58 | +0.5pp $6 | +1.0pp $-46 |
UW: 25.0% down · 7.5% · 30yr · 1.5% tax · 5.0% vac · 8.0% maint · 8.0% mgmt
Financing live
Cash to close
- Down payment
- $49,975
- Closing costs
- $5,997
- Reserves months
- —
- Total cash needed
- —
Loan-product check · same deal, 3 products live
Conventional
25% down · 7.5% · 30yr
- Down + closing
- —
- Monthly P&I
- —
- Monthly cashflow
- —
- DSCR
- —
- Eligible?
- —
Personal DTI + credit; lowest rate.
DSCR
20% down · 8.5% · 30yr
- Down + closing
- —
- Monthly P&I
- —
- Monthly cashflow
- —
- DSCR
- —
- Eligible?
- —
No personal income docs; deal must DSCR.
Hard money
10% down · 12.0% · 12mo
- Down + closing
- —
- Monthly P&I
- —
- Monthly cashflow
- —
- DSCR
- —
- Eligible?
- —
Short-term bridge; refi at stabilization.
Rent comps 11 comps
| Address | Beds | Baths | Sqft | Rent | $/sqft | DOM | Units | Dist |
|---|---|---|---|---|---|---|---|---|
| 464 Carol Dr Greenwood, IN | 3.0 | 1.0 | 888 | $1,550 | $1.75 | 45d | 1 | 0.10mi |
| 514 Carol Dr Greenwood, IN | 3.0 | 1.0 | 864 | $1,483 | $1.72 | 0d | 1 | 0.36mi |
| 1039 N Paz Dr Greenwood, IN | 1.0–3.0 | 1.0–2.0 | 925 | $1,434 | $1.55 | 0d | 9 | 1.00mi |
| 1043 Mikes Way Greenwood, IN | 3.0 | 2.0 | 1090 | $1,650 | $1.51 | 45d | 1 | 1.05mi |
| 902 Wallington Cir Greenwood, IN | 1.0–3.0 | 1.0–1.5 | 899 | $1,687 | $1.88 | 0d | 23 | 1.13mi |
| 370 Homestead Ave Greenwood, IN | 1.0–3.0 | 1.0–2.0 | 1135 | $2,275 | $2.00 | 0d | 29 | 1.24mi |
| 1225 Freemont Ln Greenwood, IN | 3.0 | 2.5 | 1304 | $1,750 | $1.34 | 12d | 1 | 1.36mi |
| 1285 Kenwood Dr Greenwood, IN | 3.0 | 2.5 | 1470 | $1,755 | $1.19 | 25d | 1 | 1.40mi |
| 3503 Pleasant Lake Dr Indianapolis, IN | 3.0 | 1.0 | 1064 | $1,615 | $1.52 | 14d | 1 | 1.42mi |
| 1284 Edgewater Dr Greenwood, IN | 3.0 | 2.5 | 1304 | $1,781 | $1.37 | 25d | 1 | 1.47mi |
| 4545 Scarlet Oak Way Indianapolis, IN | 1.0–3.0 | 1.0–2.0 | 1101 | $1,767 | $1.60 | 0d | 15 | 1.48mi |
Listing history 2 events
-
2026-05-16status Pending 104-char remark
-
2026-05-14$199,900 Active 104-char remark
ⓘ Source: listings_history table (triggers on properties + properties_extension) + one-shot
backfill from property_details.listing_events for pre-trigger history.
Tax reassessment forecast IN · Partial reset (capped growth)
- Current annual tax
- $2,709 · $226/mo
- Projected year-2 tax
- $2,709 · $226/mo
- Expected delta
- $0/yr ($0/mo · 0.0%)
ⓘ Screening estimate from a state-policy table — verify with the county assessor before closing.
Climate risk First Street
- Flood 1/10 Low FEMA zone X (unshaded) · 0% chance over 30 yrs
- Wildfire 1/10 Low
- Heat 4/10 Moderate 7 d/yr ≥101°F today · 19 d/yr by 30 yrs out
- Wind 2/10 Low 100% chance of damaging wind over 30 yrs
- Air quality 2/10 Low 2 unhealthy d/yr today · 2 by 30 yrs out
Nearby sold comps map
Loading sold comps map…
Walkable amenities ~0.75 mi
Loading nearby amenities…
Taxation est. · year 1
- Rental income
- $21,502
- − Mortgage interest
- −$11,198
- − Property taxes
- −$2,709
- − Insurance
- −$1,000
- − Repairs & maintenance
- −$1,720
- − Management
- −$1,720
- − Depreciation
- −$5,815
- Taxable loss
- −$2,660
- Est. tax savings @ 24.0%
- +$638
- After-tax cash flow
- $1,337/yr
For passive investors: Depreciation is non-cash, so a rental often shows a tax loss while cash-flowing — sheltering income. Rental losses are passive: they offset passive income freely, and up to $25,000/yr can offset ordinary (W-2) income if you actively participate and your MAGI is under $100k (phasing out to $0 by $150k); unused losses carry forward. On sale, claimed depreciation is recaptured at up to 25%, and gains may owe capital-gains tax (a 1031 exchange can defer both). Figures are a year-1 estimate at your 24.0% rate — not tax advice; consult a CPA.
Schools (NCES district)
- District
- Greenwood Community School Corporation
- NCES district ID
- 1804110
- Math proficiency
- 41% ▼ -12.00%
- Reading proficiency
- 52% ▼ -7.00%
- Median HH income
- $48,589
- Composite
- 39.71/100
- National rank
- #3902
- State rank
- #88 of 301 in IN
Livability — Greenwood
- Score
- 73/100
- State rank
- #91
- US rank
- #5255
Category grades
Schools grade is shown separately in the Schools card above.
Census & demographics
- Census place
- Greenwood, IN
- County
- Johnson County · 154,261 people
- City population
- 96,151
- Metro
- Indianapolis-Carmel-Anderson, IN
- Population (ZIP)
- 61,803
- Household income
- $91,496
- Rent vs Own
- Severe rent burden
- 1513.0
Population outlook (Johnson County) Hauer SSP2
- Today (2025)
- 170,080 people
- By 2030
- 179,983 · +5.8%
- By 2040
- 198,580 · +16.8%
- By 2050
- 214,661 · +26.2%
- By 2075
- 247,990 · +45.8%
- By 2100
- 257,821 · +51.6%
Race, ethnicity, and origin ACS 2023
- Neighborhood character
- Predominantly White (79%)
- Race & ethnicity
- White 79% Asian 8% Black 5% Two or more races 5% Hispanic / Latino 5%
- Common ancestry
- Slovak 3% Romanian 2% Lithuanian 1%
- Foreign-born
- 8% · Canada, Jamaica
- Languages at home
- 88% English-only · Other Indo-European 6% Spanish 3% Other Asian/Pacific 1%
Political lean MEDSL · Johnson
- 2024 margin
- Solid R (+34.3) · D 32.0% · R 66.3% · Other 1.7%
- 2008→2024 swing
- -8.9pp toward R · 2008: -25.5pp · 2024: -34.3pp
- All cycles
- 2024: R+34.3 2020: R+34.1 2016: R+42.5 2012: R+38.5 2008: R+25.5
Not yet ingested
- Civics
- —
Market trends
- HPI YoY
- ▼ -206.72%
- Current HPI
- 204.3161
- Rent YoY
- ▲ 1.95%
- Metro
- Indianapolis-Carmel-Anderson, IN
- State GDP YoY
- ▲ 2.90%
- F500 in state
- 18
Industry mix (Fortune 500 HQ in IN)
| Industry | F500 HQs | Revenue |
|---|---|---|
| Industrial Machinery | 2 | $37B |
|
||
| Healthcare | 1 | $177B |
|
||
| Pharmaceuticals | 1 | $45B |
|
||
| Metals / Steel | 1 | $18B |
|
||
| Agriculture | 1 | $17B |
|
||
| Packaging | 1 | $12B |
|
||
Price history
-22.5% since first listed3 events — show timeline
- 2026-05-29 Sold (MLS) $155,000 MIBOR as Distributed by MLS Grid
- 2026-05-16 Pending — MIBOR as Distributed by MLS Grid
- 2026-05-14 Listed $199,900 MIBOR as Distributed by MLS Grid
Property tax history
+5.7%/yrLatest (2024): $2,709 · +1.0% YoY. Source: county tax records.
Cash-flow waterfall
monthlySold comps — $/sqft
last 12 mo · ≤1 miLoading sold comps…