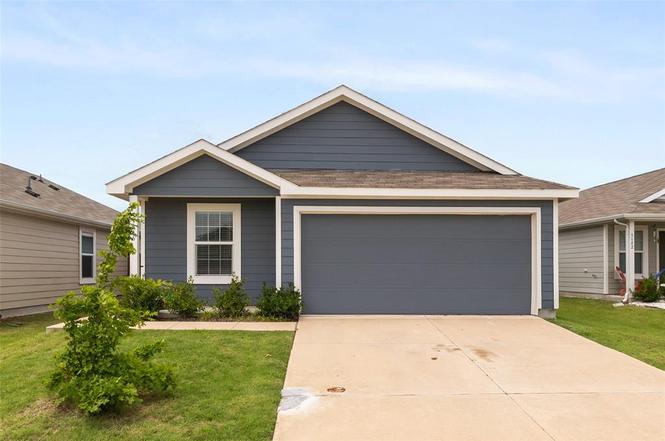
5646 Bristle Leaf Dr · Wylie, TX
Flood risk 1/10 · Minimal
- FEMA flood zone
- X (unshaded)
- Chance of flooding over 30 yrs
- 0.0%
- Est. flood insurance / yr
- $507 – $1,088
Fire risk 4/10 · Minor
- Est. fire insurance / yr
- $1,222 – $2,270
Heat risk 8/10 · Major
- Hot days now (above 110°F)
- 8 days/yr
- Hot days in 30 yrs
- 27 days/yr
Wind risk 6/10 · Moderate
- Chance of severe wind over 30 yrs
- 27.0%
Air-quality risk 3/10 · Minor
- Unhealthy air days now
- 3 days/yr
- Unhealthy air days in 30 yrs
- 3 days/yr
Risk factors via First Street. Map © Google.
Why this score? — see what drove the D grade
The composite is a weighted blend of 9 inputs, each scored 0–100. Each bar is that input's sub-score; the figure is the points it added to the 100-point composite (weight × sub-score).
- Cash flow +10.4/30.0
- ARV discount +9.7/15.0
- 1% rule +4.9/10.0
- Schools +4.2/10.0
- Livability +3.5/5.0
- DSCR +3.0/10.0
- Condition / age +2.5/5.0
- Rent growth +2.2/5.0
- Appreciation +0.0/10.0
$185,000
🖨 Deal sheet (PDF) 📄 Offer letter ✓ Due diligence
Listing remarks
Welcome to 5646 Bristle Leaf Dr in Princeton, TX! This charming 2-bedroom, 1-bath home built in 2022 offers low-maintenance living with modern finishes and an open-concept layout perfect for first-time homebuyers, downsizers, or investors. The bright kitchen opens to the spacious living area, creating a functional flow for everyday living and entertaining. Enjoy energy-efficient construction, modern cabinetry, durable flooring, and a private backyard with room to relax, garden, or entertain. The attached garage and smart layout maximize every square foot. Located in fast-growing Princeton near McKinney, this home offers convenient access to Hwy 380, shopping, dining, schools, and major empl
Key facts
- Modern cabinetry
- Private backyard
- Convenient access
Tags
Property features AI
Finance
- Other: Property type treated as residential single family; Standard listing; transaction type: For Sale; Possession at closing/funding
- Financial info: Listing accepts Cash, Conventional, FHA, VA financing; No second mortgage indicated
- HOA & community: Mandatory association; Annual HOA fee of $700; HOA includes full use of facilities and grounds maintenance; HOA management: Bridgewater Residential Community, Inc.
Exterior
- Parking: Driveway; Garage; Covered parking for 2 vehicles; Attached 1-car garage
- Utilities: City water; City sewer; Not in a municipal utility district
- Home design: Single family residence; Residential property; One story; Preowned (built in 2022)
- Construction: Built in 2022; Slab foundation
- Exterior features: Less than 0.5 acre lot; Subdivision: Bridgewater Ph 4b; Please use GPS for directions
Interior
- Kitchen: Dishwasher; Disposal; Electric range; Microwave; Kitchen island; Pantry; Eat-in kitchen
- Bedrooms: 2 bedrooms (both on main level); Primary bedroom on main level
- Flooring: Carpet; Luxury vinyl plank
- Bathrooms: 1 full bathroom
- Heating & cooling: Central heating (electric); Central air conditioning (electric)
- Interior features: Open floorplan; Kitchen island; Eat-in kitchen; Pantry; Walk-in closet(s); 6 total rooms; 1 living area; 1 dining area; One-level layout
- Laundry & utility: Washer hookup; Electric dryer hookup; Electric water heater; Utility room on main level
Neighborhood map
What this means for you Summary
Snapshot
- This is a 2-bed/1.0-bath single-family listed at $185k.
Deal economics
- At list price, monthly cash flow is $-97 ($-1k/yr) — negative.
- To cash-flow at today's rent, offer at most $168k (9.3% below list).
- To meet the 1% rule (rent ≥ 1% of price), the offer needs to be $184k (0.5% below list).
- Recommended offer: $168k (9.3% below list) — sets the bar for cash-flow.
- Cap rate 5.7% vs local median 4.0% in Wylie — top-decile yield for the area; either an underpriced asset or a hidden risk that comps aren't pricing in. Stress-test before assuming the spread holds.
Location & tenants
- Location reads 69/100 on livability (#419 in TX) — a middle-class / working-renter tenant base. Strengths: crime A+, employment A+, housing A+; Watch: amenities F, commute F, health & safety F.
- Princeton ISD (suburban): math 51% / reading 47% proficiency, ranked #188 of 826 in TX (top 23%) — families likely to look elsewhere, expect single-tenant / working-renter base with shorter leases.
- Zoned schools: Harper El (math 50% / reading 41%, grade D-, #1,112 of 4,322 statewide, top 26%, 436 students, 56% FRL); Clark Middle (math 53% / reading 42%, grade C-, #408 of 1,662 statewide, top 25%, 707 students, 66% FRL); Princeton H S (math 52% / reading 54%, grade C-, #437 of 1,632 statewide, top 27%, 1,521 students, 57% FRL) — zoned schools at 60% FRL track the district average.
- Market conditions: Rents soft (-1.0%/yr); 1410 active listings in the ZIP; 40 comparable units currently listed for rent nearby; rentals at typical pace (median 21d on market — plan ~3-4 weeks tenant-placement turnaround); solid renter incomes; 19,194 units permitted in Collin County in 2024 (3,988 in 5+ unit buildings).
Forward outlook
- Local home prices are declining (-3.0%/yr); year-one equity from $1k of loan paydown is wiped out by about $6k of value loss. Plan a longer hold.
- Collin County population projected at +60% by 2050 — long-run rental-demand tailwind backs the buy-and-hold thesis.
Negotiation context
- Only 6 days on market — expect competitive offers; lowballing is unlikely to land.
Risks & watch-outs
- Watch-outs: property tax is 2.9% of price.
- Climate carrying-cost: major wind risk, 27% chance of damaging wind over 30y; extreme-heat days projected 8→27/yr by 2055 (HVAC capex compounding) — expect insurance premiums to compound above CPI over the hold.
Questions for the listing agent
- What do current leases actually rent for vs. the listed asking? Can we see a recent rent roll and the last 12 months of T-12 income?
- Property tax is high relative to price — has the assessment been appealed recently, and will the sale trigger a re-assessment?
- What does the HOA fee cover, when was the last increase, and are there any pending special assessments or reserve-fund shortfalls?
- Is there a deadline driving the sale (1031 exchange, divorce, estate, relocation)? That informs how much negotiation room exists.
- Schools are B-rated — typically a magnet for longer-tenancy family renters. What's the average tenant stay here, and is there a school-zone premium baked into asking?
- The area grade is low — what's the realistic commute time and amenity access for the typical tenant pool here? Any planned neighborhood developments (good or bad) we should know about?
- What's the average days-on-market for RENTAL listings here right now (not sales)? A rising rental-DOM trend means longer vacancies and softer asking-rent achievability than the comps imply.
- What's the recent tenant-quality profile in this submarket — average credit score on applications, eviction rate, late-payment / NSF rate, and stable-employment percentage? A property-management company in the area should have these aggregated.
- How much new for-sale + rental construction is in the pipeline within 1–3 miles? Heavy new supply typically softens prices + rents 12–24 months out; constrained supply supports both.
Investment metrics
- 1% rule
- 0.99% ✗
- Cap rate
- 5.66%
- Cash-on-cash
- -2.26%
- DSCR
- 0.90
- GRM
- 8.4
CMA / ARV
- ARV (on-the-fly)
- $194,304
- Comps found
- 12
Show comp detail 12 sales within ~0.75 mi
| Address | Dist | Beds/Ba | Sqft | Sold | Price | $/sf | Match |
|---|---|---|---|---|---|---|---|
| 5509 Timber Point Dr | 0.16mi | 2/1.0 | 1,039 (+3%) | 4mo | $199,000 | $192 | 85 |
| 207 Lemongrass | 0.30mi | 2/1.0 | 1,039 (+3%) | 8mo | $187,900 | $181 | 75 |
| 318 Moray Dr | 0.33mi | 2/1.0 | 1,047 (+4%) | 8mo | $210,000 | $201 | 73 |
| 115 Lemongrass Dr | 0.31mi | 2/1.0 | 1,039 (+3%) | 13mo | $215,000 | $207 | 70 |
| 733 Slocum Way | 0.75mi | 2/1.0 | 1,012 (0%) | 6mo | $193,500 | $191 | 60 |
| 111 Wind Cove Ln | 0.70mi | 2/2.0 | 1,082 (+7%) | 9mo | $239,990 | $222 | 44 |
| 6211 Surfside Dr | 0.72mi | 2/2.0 | 1,084 (+7%) | 12mo | $229,990 | $212 | 41 |
| 6300 Surfside Dr | 0.72mi | 2/2.0 | 1,084 (+7%) | 13mo | $229,990 | $212 | 40 |
| 329 Clematis St | 0.71mi | 2/2.5 | 1,101 (+9%) | 8mo | $209,990 | $191 | 39 |
| 301 Clematis St | 0.71mi | 2/2.5 | 1,101 (+9%) | 9mo | $209,990 | $191 | 39 |
| 305 Clematis St | 0.71mi | 2/2.5 | 1,101 (+9%) | 9mo | $204,990 | $186 | 39 |
| 321 Clematis St | 0.71mi | 2/2.5 | 1,101 (+9%) | 9mo | $209,990 | $191 | 39 |
Match score weights: distance 35% · size 25% · config 20% · recency 20%. Top-matched comps best support the ARV.
Projected returns pro-forma
-3.0% appreciation · 0.0% rent growth · sell at horizon
- IRR
- -24.1%
- Equity multiple
- 0.20×
- Total profit
- $-41,379
- Equity at exit
- $27,584
- IRR
- -35.3%
- Equity multiple
- -0.24×
- Total profit
- $-64,068
- Equity at exit
- $15,995
Cash invested: $51,800 (down + closing). Projections, not guarantees.
Landlord ↔ Tenant lean methodology
- Overall (STATE)
- 87 Strongly Landlord-Friendly
- State Texas
- 87 Strongly Landlord-Friendly · R+5
- County
- — inherits STATE
- City
- — inherits STATE
ZIP-level market 75407
- Home prices YoY
- -30.3%
- Rents YoY
- -1.0%
- Active inventory
- 1410
- Price-to-rent
- 8.4×
Monthly cashflow live
- Estimated rent
- $1,840 high interval (Pro) →
- Mortgage (P&I)
- −$970
- Tax from tax record
- −$446 /mo · $5,352/yr
- Insurance
- −$77
- HOA
- −$58
- Vacancy / Maint / Mgmt
- −$386
- Net cashflow
- $-97
Break-even live
Sensitivity live
| Price | -10% $7 | -5% $-45 | +0% $-97 | +5% $-150 | +10% $-202 |
|---|---|---|---|---|---|
| Rent | -10% $-243 | -5% $-170 | +0% $-97 | +5% $-25 | +10% $48 |
| Rate | -1.0pp $-4 | -0.5pp $-50 | base $-97 | +0.5pp $-145 | +1.0pp $-194 |
UW: 25.0% down · 7.5% · 30yr · 1.5% tax · 5.0% vac · 8.0% maint · 8.0% mgmt
Financing live
Cash to close
- Down payment
- $46,250
- Closing costs
- $5,550
- Reserves months
- —
- Total cash needed
- —
Loan-product check · same deal, 3 products live
Conventional
25% down · 7.5% · 30yr
- Down + closing
- —
- Monthly P&I
- —
- Monthly cashflow
- —
- DSCR
- —
- Eligible?
- —
Personal DTI + credit; lowest rate.
DSCR
20% down · 8.5% · 30yr
- Down + closing
- —
- Monthly P&I
- —
- Monthly cashflow
- —
- DSCR
- —
- Eligible?
- —
No personal income docs; deal must DSCR.
Hard money
10% down · 12.0% · 12mo
- Down + closing
- —
- Monthly P&I
- —
- Monthly cashflow
- —
- DSCR
- —
- Eligible?
- —
Short-term bridge; refi at stabilization.
Rent comps 40 comps
| Address | Beds | Baths | Sqft | Rent | $/sqft | DOM | Units | Dist |
|---|---|---|---|---|---|---|---|---|
| 5644 Rockrose Ln Princeton, TX | 3.0 | 2.0 | 1262 | $1,800 | $1.43 | 45d | 1 | 0.03mi |
| 5708 Rockrose Ln Princeton, TX | 3.0 | 2.0 | 1440 | $1,925 | $1.34 | 45d | 1 | 0.07mi |
| 119 Cypress Ln Princeton, TX | 3.0 | 2.0 | 1260 | $1,750 | $1.39 | 45d | 1 | 0.07mi |
| 5724 Rockrose Ln Princeton, TX | 3.0 | 2.0 | 1266 | $2,050 | $1.62 | 26d | 1 | 0.09mi |
| 5733 Rockrose Ln Princeton, TX | 3.0 | 2.0 | 1266 | $1,720 | $1.36 | 45d | 1 | 0.12mi |
| 5836 Timber Point Dr Princeton, TX | 3.0 | 2.0 | 1440 | $1,875 | $1.30 | 20d | 1 | 0.16mi |
| 5504 Rockrose Ln Princeton, TX | 3.0 | 2.0 | 1479 | $1,999 | $1.35 | 6d | 1 | 0.16mi |
| 5817 Rockrose Ln Princeton, TX | 3.0 | 2.0 | 1411 | $1,624 | $1.15 | 22d | 1 | 0.16mi |
| 5825 Rockrose Ln Princeton, TX | 3.0 | 2.0 | 1440 | $1,780 | $1.24 | 45d | 1 | 0.17mi |
| 228 Rubylace Dr Princeton, TX | 3.0 | 2.0 | 1436 | $1,700 | $1.18 | 45d | 1 | 0.20mi |
| 318 Mahogany Ln Princeton, TX | 3.0 | 2.0 | 1479 | $1,800 | $1.22 | 26d | 1 | 0.24mi |
| 136 Honeysuckle St Princeton, TX | 3.0 | 2.0 | 1267 | $1,700 | $1.34 | 45d | 1 | 0.25mi |
| 330 Ashbrook Way Princeton, TX | 3.0 | 2.0 | 1479 | $1,699 | $1.15 | 1d | 1 | 0.25mi |
| 320 Dewberry St Princeton, TX | 3.0 | 2.0 | 1481 | $1,695 | $1.14 | 1d | 1 | 0.26mi |
| 320 Dewberry St Princeton, TX | 3.0 | 2.0 | 1481 | $1,745 | $1.18 | 14d | 1 | 0.26mi |
| 403 Ashbrook Way Princeton, TX | 3.0 | 2.0 | 1485 | $1,749 | $1.18 | 7d | 1 | 0.27mi |
| 403 Ashbrook Way Princeton, TX | 3.0 | 2.0 | 1485 | $1,849 | $1.25 | 26d | 1 | 0.27mi |
| 5836 Crystal Water Way Princeton, TX | 3.0 | 2.0 | 1481 | $1,799 | $1.21 | 7d | 1 | 0.28mi |
| 5847 Rock Maple Dr Princeton, TX | 3.0 | 2.0 | 1481 | $1,785 | $1.21 | 19d | 1 | 0.31mi |
| 5847 Rock Maple Dr Princeton, TX | 3.0 | 2.0 | 1481 | $1,785 | $1.21 | 9d | 1 | 0.31mi |
| 427 Ashbrook Way Princeton, TX | 3.0 | 2.0 | 1482 | $1,800 | $1.21 | 5d | 1 | 0.32mi |
| 5808 Cherry Hollow Way Princeton, TX | 3.0 | 2.0 | 1260 | $1,749 | $1.39 | 19d | 1 | 0.35mi |
| 143 Plumcove Dr Princeton, TX | 3.0 | 3.0 | 1376 | $2,150 | $1.56 | 45d | 1 | 0.37mi |
| 241 Boxberry Way Princeton, TX | 3.0 | 2.0 | 1411 | $1,725 | $1.22 | 45d | 1 | 0.46mi |
| 525 Dashwood Dr Princeton, TX | 3.0 | 2.0 | 1243 | $1,700 | $1.37 | 1d | 1 | 0.46mi |
| 108 Wyndemere Ln Princeton, TX | 3.0 | 2.0 | 1438 | $2,100 | $1.46 | 45d | 1 | 0.48mi |
| 617 Dashwood Dr Princeton, TX | 3.0 | 2.0 | 1440 | $1,619 | $1.12 | 4d | 1 | 0.51mi |
| 510 Olmstead Dr Princeton, TX | 3.0 | 2.0 | 1260 | $2,395 | $1.90 | 7d | 1 | 0.53mi |
| 5105 Greywing Dr Princeton, TX | 3.0 | 2.0 | 1438 | $1,895 | $1.32 | 19d | 1 | 0.65mi |
| 5322 Longshadow Dr Princeton, TX | 3.0 | 2.0 | 1407 | $1,699 | $1.21 | 4d | 1 | 0.70mi |
| 5322 Longshadow Dr Princeton, TX | 3.0 | 2.0 | 1407 | $1,899 | $1.35 | 22d | 1 | 0.70mi |
| 6018 Primrose Rd , TX | 3.0–4.0 | 2.5 | 1484 | $1,800 | $1.21 | 5d | 5 | 0.70mi |
| 623 Linden Rd Princeton, TX | 3.0 | 2.5 | 1419 | $1,650 | $1.16 | 45d | 1 | 0.72mi |
| 5213 Longshadow Dr Princeton, TX | 3.0 | 2.0 | 1260 | $1,985 | $1.58 | 1d | 1 | 0.72mi |
| 134 Harvest St Princeton, TX | 3.0 | 2.0 | 1440 | $1,825 | $1.27 | 20d | 1 | 0.72mi |
| 6114 Holly Spring Rd , TX | 2.0 | 2.5 | 1130 | $1,675 | $1.48 | 45d | 1 | 0.72mi |
| 6114 Holly Spring Rd , TX | 2.0 | 2.5 | 1351 | $1,550 | $1.15 | 14d | 1 | 0.72mi |
| 6203 Holly Spring Rd , TX | 2.0 | 2.5 | 1130 | $1,595 | $1.41 | 45d | 1 | 0.72mi |
| 5324 Vinebrook Way Princeton, TX | 3.0 | 2.0 | 1262 | $1,695 | $1.34 | 45d | 1 | 0.72mi |
| 6111 Shearwater Rd , TX | 3.0 | 2.0 | 1392 | $1,900 | $1.36 | 1d | 1 | 0.73mi |
HOA detail
- Monthly dues
- $58 · $696/yr
Listing history 5 events
-
2026-06-21days on market $185,000 Active 6 DOM
-
2026-06-18days on market $185,000 Active 3 DOM
-
2026-06-17days on market $185,000 Active 2 DOM
-
2026-06-15remarks 699-char remark
-
2026-06-15$185,000 Active 1 DOM
ⓘ Source: listings_history table (triggers on properties + properties_extension) + one-shot
backfill from property_details.listing_events for pre-trigger history.
Tax reassessment forecast TX · Resets to sale price
- Current annual tax
- $5,352 · $446/mo
- Projected year-2 tax
- $5,352 · $446/mo
- Expected delta
- $0/yr ($0/mo · 0.0%)
ⓘ Screening estimate from a state-policy table — verify with the county assessor before closing.
Climate risk First Street
- Flood 1/10 Low FEMA zone X (unshaded) · 0% chance over 30 yrs
- Wildfire 4/10 Moderate
- Heat 8/10 Severe 8 d/yr ≥110°F today · 27 d/yr by 30 yrs out
- Wind 6/10 Major 27% chance of damaging wind over 30 yrs
- Air quality 3/10 Moderate 3 unhealthy d/yr today · 3 by 30 yrs out
Nearby sold comps map
Loading sold comps map…
Walkable amenities ~0.75 mi
Loading nearby amenities…
Taxation est. · year 1
- Rental income
- $22,083
- − Mortgage interest
- −$10,363
- − Property taxes
- −$5,352
- − Insurance
- −$925
- − Repairs & maintenance
- −$1,767
- − Management
- −$1,767
- − HOA
- −$696
- − Depreciation
- −$5,382
- Taxable loss
- −$4,167
- Est. tax savings @ 24.0%
- +$1,000
- After-tax cash flow
- $-169/yr
For passive investors: Depreciation is non-cash, so a rental often shows a tax loss while cash-flowing — sheltering income. Rental losses are passive: they offset passive income freely, and up to $25,000/yr can offset ordinary (W-2) income if you actively participate and your MAGI is under $100k (phasing out to $0 by $150k); unused losses carry forward. On sale, claimed depreciation is recaptured at up to 25%, and gains may owe capital-gains tax (a 1031 exchange can defer both). Figures are a year-1 estimate at your 24.0% rate — not tax advice; consult a CPA.
Schools (NCES district)
- District
- Princeton ISD
- NCES district ID
- 4835850
- Math proficiency
- 51% ▼ -8.00%
- Reading proficiency
- 47% ▬ 0.00%
- Median HH income
- $54,827
- Composite
- 42.44/100
- National rank
- #3226
- State rank
- #188 of 826 in TX
Livability — Wylie
- Score
- 69/100
- State rank
- #419
- US rank
- #8623
Category grades
Schools grade is shown separately in the Schools card above.
Census & demographics
- County
- Collin County · 1,159,394 people
- City population
- 34,171
- Metro
- Dallas-Fort Worth-Arlington, TX
- Population (ZIP)
- 34,171
- Household income
- $100,037
- Rent vs Own
- Severe rent burden
- 368.0
Population outlook (Collin County) Hauer SSP2
- Today (2025)
- 1,210,074 people
- By 2030
- 1,358,201 · +12.2%
- By 2040
- 1,654,061 · +36.7%
- By 2050
- 1,937,359 · +60.1%
- By 2075
- 2,567,039 · +112.1%
- By 2100
- 2,952,048 · +144.0%
Race, ethnicity, and origin ACS 2023
- Neighborhood character
- Diverse neighborhood (Simpson 0.66)
- Race & ethnicity
- White 47% Hispanic / Latino 30% Black 17% Two or more races 10% Asian 4% Native American 1%
- Hispanic origin (detail)
- Mexican 26%
- Common ancestry
- Lithuanian 2% Romanian 1% Russian 1%
- Foreign-born
- 15% · Canada, China, Mexico
- Languages at home
- 70% English-only · Spanish 22% Other Indo-European 2% Other Asian/Pacific 1%
Political lean MEDSL · Collin
- 2024 margin
- R (+11.1) · D 43.1% · R 54.3% · Other 2.6%
- 2008→2024 swing
- +14.4pp toward D · 2008: -25.6pp · 2024: -11.1pp
- All cycles
- 2024: R+11.1 2020: R+4.3 2016: R+17.0 2012: R+31.6 2008: R+25.6
Not yet ingested
- Civics
- —
Market trends
- HPI YoY
- ▼ -103.99%
- Current HPI
- 238.9373
- Rent YoY
- ▼ -1.02%
- Metro
- Dallas-Fort Worth-Arlington, TX
- State GDP YoY
- ▲ 3.95%
- F500 in state
- 110
Industry mix (Fortune 500 HQ in TX)
| Industry | F500 HQs | Revenue |
|---|---|---|
| Energy | 16 | $1,198B |
|
||
| Technology | 5 | $198B |
|
||
| Engineering / Construction | 4 | $72B |
|
||
| Energy Services | 3 | $60B |
|
||
| Utilities | 3 | $41B |
|
||
| Healthcare | 2 | $330B |
|
||
Price history
1 event — show timeline
- 2026-05-28 Listed $185,000 NTREIS
Property tax history
+90.1%/yrLatest (2025): $5,352 · -5.8% YoY. Source: county tax records.
Cash-flow waterfall
monthlySold comps — $/sqft
last 12 mo · ≤1 miLoading sold comps…