1113 Wiench Way · Corvallis, MT
Flood risk 5/10 · Moderate
- FEMA flood zone
- X (unshaded)
- Chance of flooding over 30 yrs
- 0.24%
- Est. flood insurance / yr
- $507 – $1,088
Fire risk 8/10 · Major
- Est. fire insurance / yr
- $918 – $1,706
Heat risk 3/10 · Minor
- Hot days now (above 89°F)
- 7 days/yr
- Hot days in 30 yrs
- 17 days/yr
Wind risk 1/10 · Minimal
- Chance of severe wind over 30 yrs
- —
Air-quality risk 10/10 · Severe
- Unhealthy air days now
- 30 days/yr
- Unhealthy air days in 30 yrs
- 38 days/yr
Risk factors via First Street. Map © Google.
Why this score? — see what drove the B- grade
The composite is a weighted blend of 9 inputs, each scored 0–100. Each bar is that input's sub-score; the figure is the points it added to the 100-point composite (weight × sub-score).
- Cash flow +30.0/30.0
- 1% rule +10.0/10.0
- DSCR +10.0/10.0
- ARV discount +7.5/15.0
- Schools +3.9/10.0
- Livability +3.5/5.0
- Rent growth +2.5/5.0
- Condition / age +2.2/5.0
- Appreciation +0.0/10.0
$55,000
🖨 Deal sheet 📄 Offer letter ✓ Due diligence
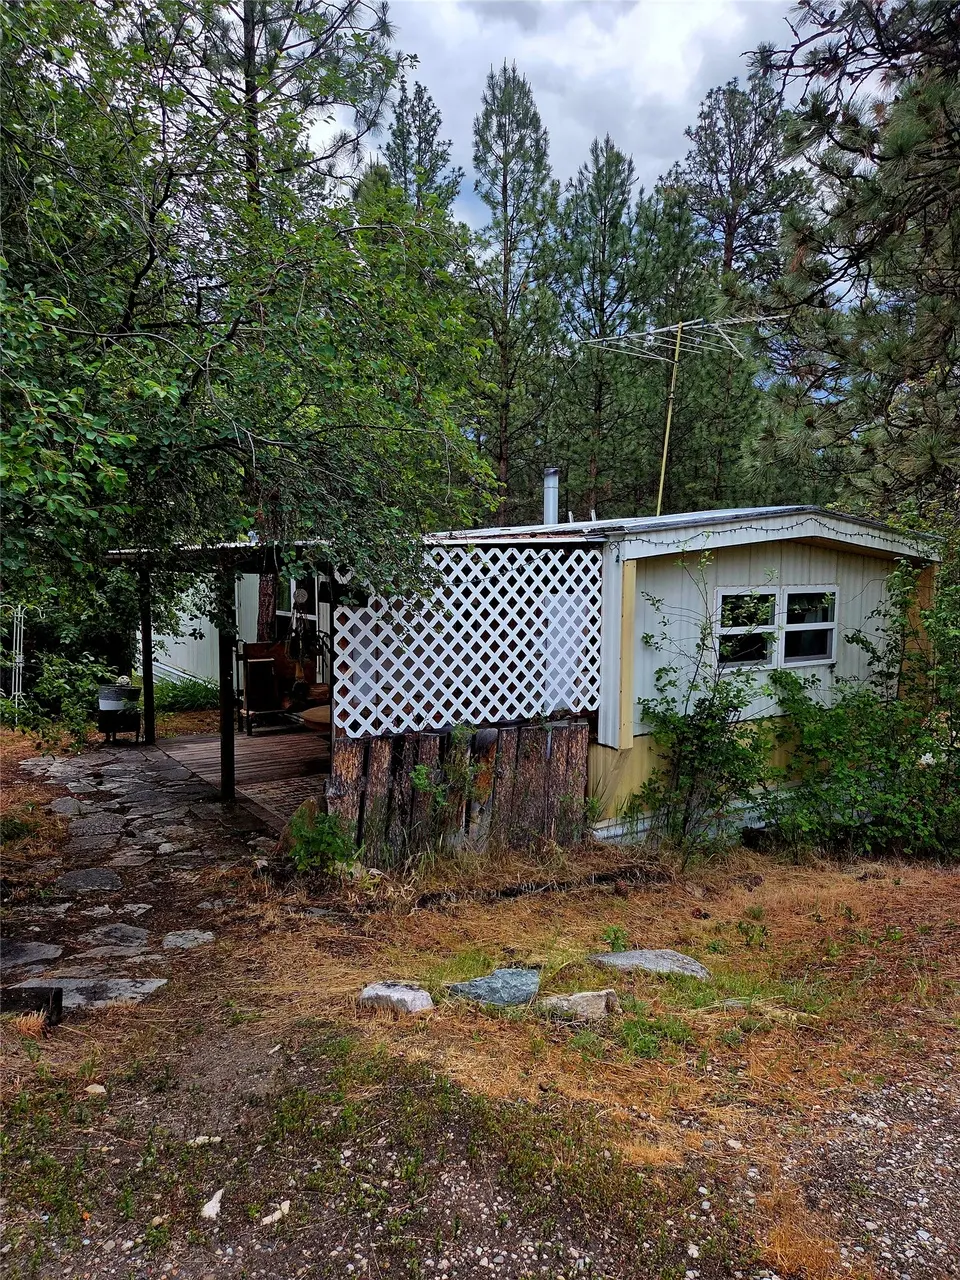
Key facts
- Extra living space
- Wood burning stove
- Built 1979
Tags
Property features AI
Finance
- Financial info: Land is leased
Exterior
- Utilities: Private sewer / septic tank; Gravel road access on a private maintained road
- Home design: Manufactured home (single wide); Residential property
- Construction: Foundation: see remarks
- Exterior features: Covered porch/patio
Interior
- Kitchen: Range; Refrigerator; Freezer; Dishwasher not listed
- Bathrooms: 1 full bathroom
- Heating & cooling: Electric heating; Forced air; Wood stove
- Interior features: One fireplace; Storage
- Laundry & utility: Washer hookup; Washer; Dryer
Neighborhood map
What this means for you Summary
Snapshot
- This is a 2-bed/1.0-bath manufactured listed at $55k. Condition is rated fair.
Deal economics
- At list price, monthly cash flow is $529 ($6k/yr) — positive.
- The deal already cash-flows at list — no discount required.
- Meets the 1% rule at list price ($1k rent vs $55k).
- Recommended offer: $54k (1.5% below list) — sets the bar for market timing.
- Cap rate 17.8% vs local median 0.7% in Corvallis — top-decile yield for the area; either an underpriced asset or a hidden risk that comps aren't pricing in. Stress-test before assuming the spread holds.
Location & tenants
- Location reads 69/100 on livability (#85 in MT) — a middle-class / working-renter tenant base. Strengths: cost of living A+, housing A+, crime A; Watch: employment C-, amenities F, commute F.
- Corvallis K-12 Schools (rural): math 43% / reading 49% proficiency, ranked #40 of 116 in MT (top 34%) — families likely to look elsewhere, expect single-tenant / working-renter base with shorter leases.
- Market conditions: 68 active listings in the ZIP; 27 units permitted in Ravalli County in 2024 (0 in 5+ unit buildings).
Forward outlook
- Local home prices are declining (-3.0%/yr); year-one equity from $380 of loan paydown is wiped out by about $2k of value loss. Plan a longer hold.
- At projected returns (-3.0% appreciation + 3.0% rent growth), your $15k cash investment doubles in ~3 years — after that, you're playing with house money.
Negotiation context
- It's been on market 15 days — a 2% lower offer ($54k) is reasonable based on typical stale-listing flexibility.
Risks & watch-outs
- Climate carrying-cost: moderate flood risk; severe wildfire risk — expect insurance premiums to compound above CPI over the hold.
Questions for the listing agent
- Have any recent inspections been done? Can we get a copy of the seller's disclosures and any deferred-maintenance estimates?
- Built in 1979 — when were the roof, HVAC, electrical panel, plumbing, and water heater last replaced?
- Is there a deadline driving the sale (1031 exchange, divorce, estate, relocation)? That informs how much negotiation room exists.
- What's the average days-on-market for RENTAL listings here right now (not sales)? A rising rental-DOM trend means longer vacancies and softer asking-rent achievability than the comps imply.
- What's the recent tenant-quality profile in this submarket — average credit score on applications, eviction rate, late-payment / NSF rate, and stable-employment percentage? A property-management company in the area should have these aggregated.
- How much new for-sale + rental construction is in the pipeline within 1–3 miles? Heavy new supply typically softens prices + rents 12–24 months out; constrained supply supports both.
Investment metrics
- 1% rule
- 2.09% ✓
- Cap rate
- 17.82%
- Cash-on-cash
- 41.18%
- DSCR
- 2.83
- GRM
- 4.0
CMA / ARV
No comps found within radius.
Projected returns pro-forma
-3.0% appreciation · 3.0% rent growth · sell at horizon
- IRR
- 37.7%
- Equity multiple
- 2.61×
- Total profit
- $24,766
- Equity at exit
- $8,201
- IRR
- 44.3%
- Equity multiple
- 5.22×
- Total profit
- $64,980
- Equity at exit
- $4,755
Cash invested: $15,400 (down + closing). Projections, not guarantees.
Landlord ↔ Tenant lean methodology
- Overall (STATE)
- 82 Strongly Landlord-Friendly
- State Montana
- 82 Strongly Landlord-Friendly · R+11
- County
- — inherits STATE
- City
- — inherits STATE
ZIP-level market 59828
- Home prices YoY
- -33.6%
- Active inventory
- 68
- Price-to-rent
- 4.0×
Monthly cashflow live
- Estimated rent
- $1,150 medium interval (Pro) →
- Mortgage (P&I)
- −$288
- Tax est. 1.5%
- −$69 /mo · $825/yr
- Insurance
- −$23
- HOA
- −$0
- Vacancy / Maint / Mgmt
- −$242
- Net cashflow
- $529
Break-even live
UW: 25.0% down · 7.5% · 30yr · 1.5% tax · 5.0% vac · 8.0% maint · 8.0% mgmt
Financing live
Cash to close
- Down payment
- $13,750
- Closing costs
- $1,650
- Reserves months
- —
- Total cash needed
- —
Loan-product check · same deal, 3 products live
Conventional
25% down · 7.5% · 30yr
- Down + closing
- —
- Monthly P&I
- —
- Monthly cashflow
- —
- DSCR
- —
- Eligible?
- —
Personal DTI + credit; lowest rate.
DSCR
20% down · 8.5% · 30yr
- Down + closing
- —
- Monthly P&I
- —
- Monthly cashflow
- —
- DSCR
- —
- Eligible?
- —
No personal income docs; deal must DSCR.
Hard money
10% down · 12.0% · 12mo
- Down + closing
- —
- Monthly P&I
- —
- Monthly cashflow
- —
- DSCR
- —
- Eligible?
- —
Short-term bridge; refi at stabilization.
Listing history 12 events
-
2026-06-15statusdays on market $55,000 Pending 15 DOM
-
2026-06-14days on market $55,000 Active 14 DOM
-
2026-06-13days on market $55,000 Active 13 DOM
-
2026-06-10days on market $55,000 Active 11 DOM
-
2026-06-09days on market $55,000 Active 10 DOM
-
2026-06-09days on market $55,000 Active 9 DOM
-
2026-06-07days on market $55,000 Active 8 DOM
-
2026-06-05days on market $55,000 Active 5 DOM
-
2026-06-03days on market $55,000 Active 4 DOM
-
2026-06-02days on market $55,000 Active 3 DOM
-
2026-06-01days on market $55,000 Active 2 DOM
-
2026-05-31$55,000 Active 1 DOM
ⓘ Source: listings_history table (triggers on properties + properties_extension) + one-shot
backfill from property_details.listing_events for pre-trigger history.
Climate risk First Street
- Flood 5/10 Major FEMA zone X (unshaded) · 24% chance over 30 yrs
- Wildfire 8/10 Severe
- Heat 3/10 Moderate 7 d/yr ≥89°F today · 17 d/yr by 30 yrs out
- Wind 1/10 Low
- Air quality 10/10 Extreme 30 unhealthy d/yr today · 38 by 30 yrs out
Nearby sold comps map
Loading sold comps map…
Walkable amenities ~0.75 mi
Loading nearby amenities…
Taxation est. · year 1
- Rental income
- $13,802
- − Mortgage interest
- −$3,081
- − Property taxes
- −$825
- − Insurance
- −$275
- − Repairs & maintenance
- −$1,104
- − Management
- −$1,104
- − Depreciation
- −$1,600
- Taxable income
- $5,812
- Est. tax owed @ 24.0%
- −$1,395
- After-tax cash flow
- $4,947/yr
For passive investors: Depreciation is non-cash, so a rental often shows a tax loss while cash-flowing — sheltering income. Rental losses are passive: they offset passive income freely, and up to $25,000/yr can offset ordinary (W-2) income if you actively participate and your MAGI is under $100k (phasing out to $0 by $150k); unused losses carry forward. On sale, claimed depreciation is recaptured at up to 25%, and gains may owe capital-gains tax (a 1031 exchange can defer both). Figures are a year-1 estimate at your 24.0% rate — not tax advice; consult a CPA.
Condition & rehab AI · 13 photos
The property requires moderate repairs and maintenance, including painting, landscaping, and roof inspection. These improvements will enhance its curb appeal and overall value.
Repairs flagged
- Minor paint peeling on interior walls — Visible peeling paint
- Major overgrown vegetation around the property — Affects curb appeal
- Unknown roof inspection — Not visible in photos
Value-add opportunities
- Resale painting interior walls — Fresh paint enhances curb appeal and interior aesthetics
- Both landscaping — Improves curb appeal and enhances property value
- Resale roof inspection and repair — Aesthetic and structural improvement
Renovation cost estimate screening
| Repair item | Severity | Est. cost |
|---|---|---|
| paint peeling on interior walls · Visible peeling paint | Minor | $500–3,000 |
| overgrown vegetation around the property · Affects curb appeal | Major | $15,000–50,000 |
| roof inspection · Not visible in photos | Unknown | $500–3,000 |
| Total estimated repair cost · 3 items | $16,000–56,000 |
Value-add ROI direction
- Resale painting interior walls — Fresh paint enhances curb appeal and interior aesthetics ↑
- Both landscaping — Improves curb appeal and enhances property value ↑
- Resale roof inspection and repair — Aesthetic and structural improvement ↑
ⓘ Cost ranges are severity-bucket heuristics (US national rule-of-thumb). Get contractor quotes + a written scope before underwriting a rehab budget.
Schools (NCES district)
- District
- Corvallis K-12 Schools
- NCES district ID
- 3007410
- Math proficiency
- 43% ▼ -5.00%
- Reading proficiency
- 49% ▼ -5.00%
- Median HH income
- $44,664
- Composite
- 38.94/100
- National rank
- #4088
- State rank
- #40 of 116 in MT
Livability — Corvallis
- Score
- 69/100
- State rank
- #85
- US rank
- #8509
Category grades
Schools grade is shown separately in the Schools card above.
Census & demographics
- Population (ZIP)
- 5,798
Population outlook (Ravalli County) Hauer SSP2
- Today (2025)
- 43,584 people
- By 2030
- 44,336 · +1.7%
- By 2040
- 44,760 · +2.7%
- By 2050
- 44,193 · +1.4%
- By 2075
- 42,538 · -2.4%
- By 2100
- 39,079 · -10.3%
Race, ethnicity, and origin ACS 2023
- Neighborhood character
- Predominantly White (92%)
- Race & ethnicity
- White 92% Two or more races 5% Hispanic / Latino 4%
- Common ancestry
- Lithuanian 6% Portuguese 3% Slovak 2%
- Foreign-born
- 1% · Canada
- Languages at home
- 99% English-only · Spanish 1%
Political lean MEDSL · Ravalli
- 2024 margin
- Solid R (+40.6) · D 28.4% · R 68.9% · Other 2.7%
- 2008→2024 swing
- -19.7pp toward R · 2008: -20.8pp · 2024: -40.6pp
- All cycles
- 2024: R+40.6 2020: R+36.3 2016: R+38.6 2012: R+32.1 2008: R+20.8
Not yet ingested
- Civics
- —
Market trends
- HPI YoY
- ▼ -139.83%
- Current HPI
- 276.6511
- Rent YoY
- —
- Metro
- —
- State GDP YoY
- ▲ 3.41%
- F500 in state
- 2
Industry mix (Fortune 500 HQ in MT)
| Industry | F500 HQs | Revenue |
|---|---|---|
| Technology / Analytics | 1 | $2B |
|
||
Price history
1 event — show timeline
- 2026-05-30 Listed $55,000 MRMLS
Cash-flow waterfall
monthlySold comps — $/sqft
last 12 mo · ≤1 miLoading sold comps…