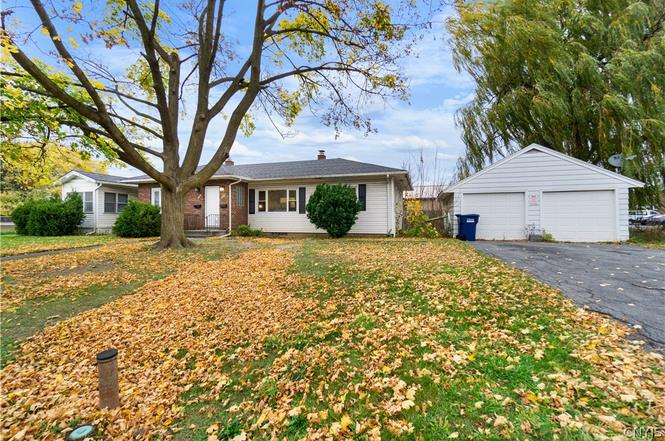
326 Grant Blvd #28 · Syracuse, NY
Flood risk 1/10 · Minimal
- FEMA flood zone
- X (unshaded)
- Chance of flooding over 30 yrs
- 0.0%
- Est. flood insurance / yr
- $473 – $860
Fire risk 1/10 · Minimal
- Est. fire insurance / yr
- $691 – $1,283
Heat risk 3/10 · Minor
- Hot days now (above 95°F)
- 7 days/yr
- Hot days in 30 yrs
- 16 days/yr
Wind risk 1/10 · Minimal
- Chance of severe wind over 30 yrs
- 0.0%
Air-quality risk 2/10 · Minimal
- Unhealthy air days now
- 0 days/yr
- Unhealthy air days in 30 yrs
- 1 days/yr
Risk factors via First Street. Map © Google.
Why this score? — see what drove the D- grade
The composite is a weighted blend of 9 inputs, each scored 0–100. Each bar is that input's sub-score; the figure is the points it added to the 100-point composite (weight × sub-score).
- Cash flow +15.1/30.0
- DSCR +4.6/10.0
- Rent growth +4.0/5.0
- Livability +3.9/5.0
- 1% rule +3.3/10.0
- Condition / age +2.5/5.0
- Schools +1.8/10.0
- ARV discount +0.0/15.0
- Appreciation +0.0/10.0
$239,000
🖨 Deal sheet (PDF) 📄 Offer letter ✓ Due diligence
Listing remarks
Turnkey 2-Unit Investment or Owner-Occupant Opportunity – 326 Grant Blvd, Syracuse, NY well-maintained, turnkey two-family property offering immediate opportunity for both investors and owner-occupants alike. Each unit features 2 bedrooms and a functional layout designed for comfortable everyday living. This property includes separate utilities for each unit, allowing for simplified management and reduced operating expenses. A standout feature is the presence of two — that’s TWO — private driveways, providing dedicated off-street parking for each tenant. Whether you're looking to live in one unit while generating rental income from the other or add a low-maintenance
Key facts
- Separate utilities
- 8,716 sq ft lot
- 2 parking spots
Tags
Neighborhood map
What this means for you Summary
Snapshot
- This is a 4-bed/2.0-bath condo listed at $239k.
Deal economics
- At list price, monthly cash flow is $78 ($938/yr) — positive.
- The deal already cash-flows at list — no discount required.
- To meet the 1% rule (rent ≥ 1% of price), the offer needs to be $198k (17.3% below list).
- Recommended offer: $198k (17.3% below list) — sets the bar for 1% rule.
Location & tenants
- Location reads 77/100 on livability (#187 in NY, #2,869 nationally) — a middle-class / working-renter tenant base. Strengths: amenities A+, commute A+, cost of living A+; Watch: crime F, employment D-.
- Syracuse City School District (urban): math 18% / reading 26% proficiency, ranked #590 of 590 in NY (top 100%) — low school quality limits family demand, transient renter base, plan for 1-2y turnover; 74% free/reduced lunch — lower-income household profile, screen leases tightly.
- Zoned schools: Syracuse Latin School (math 31% / reading 62%, grade D-, #1,262 of 2,108 statewide, top 60%, 642 students, 42% FRL); Lincoln Middle School (math 8% / reading 14%, grade F, #721 of 729 statewide, top 99%, 508 students, 90% FRL); Henninger High School (math 65% / reading 50%, grade C, #885 of 1,100 statewide, top 81%, 1,499 students, 85% FRL) — zoned schools at 72% FRL track the district average.
- Zoned-school proficiency averages 38% at this address vs 22% district-wide (+16 pts) — the actual schools serving this property are materially stronger than the Syracuse City School District average implies; a family-tenant draw the district grade alone would hide.
- Market conditions: Rents rising fast (+5.8%/yr); 43 active listings in the ZIP; 8 comparable units currently listed for rent nearby; rentals at typical pace (median 23d on market — plan ~3-4 weeks tenant-placement turnaround); 616 units permitted in Onondaga County in 2024 (256 in 5+ unit buildings).
- This rent runs 38% of the median local income ($63k/yr) — at the standard rent-burdened threshold; future hikes will face affordability resistance.
Forward outlook
- Local home prices are declining (-3.0%/yr); year-one equity from $2k of loan paydown is wiped out by about $7k of value loss. Plan a longer hold.
- Onondaga County population projected to shrink 9% by 2050 — rents likely to lag national; underwrite the cash flow, not the appreciation.
Negotiation context
- It's been on market 45 days — a 3% lower offer ($232k) is reasonable based on typical stale-listing flexibility.
- 3 sale attempts since 8y ago; this cycle's ask is 17604% above the opening price — seller raised mid-cycle; expect resistance to lowballs.
- Current owner paid $50k; list at $239k implies a 378% gain — meaningful room to come down on a strong offer.
Questions for the listing agent
- It's been on market 45 days. Have you received any prior offers? Is the seller open to a 17% concession, seller financing, or rate buy-down credit?
- Built in 1965 — when were the roof, HVAC, electrical panel, plumbing, and water heater last replaced?
- Any open or pending special assessments — roof, HVAC, plumbing, elevator, façade? What's the per-unit balance and payoff schedule, and is the seller paying it off at close or rolling it to the buyer?
- Is there a deadline driving the sale (1031 exchange, divorce, estate, relocation)? That informs how much negotiation room exists.
- Schools are D-rated, which usually means shorter tenancies and higher turnover. Who's the typical renter profile here, and what's been the actual vacancy rate?
- Crime grade is F in this area — have there been break-ins, vandalism, or insurance claims at this property in the last 3 years? What carrier currently insures it and at what premium?
- The area grade is low — what's the realistic commute time and amenity access for the typical tenant pool here? Any planned neighborhood developments (good or bad) we should know about?
- What's the average days-on-market for RENTAL listings here right now (not sales)? A rising rental-DOM trend means longer vacancies and softer asking-rent achievability than the comps imply.
- What's the recent tenant-quality profile in this submarket — average credit score on applications, eviction rate, late-payment / NSF rate, and stable-employment percentage? A property-management company in the area should have these aggregated.
- How much new apartment / multifamily construction is in the pipeline within 1–3 miles? Heavy new supply (>2% of stock underway) typically softens rents 12–24 months out; light construction supports rent growth.
Investment metrics
- 1% rule
- 0.83% ✗
- Cap rate
- 6.69%
- Cash-on-cash
- 1.40%
- DSCR
- 1.06
- GRM
- 10.1
CMA / ARV
- ARV (on-the-fly)
- $161,784
- Comps found
- 1
Show comp detail 1 sale within ~0.75 mi
| Address | Dist | Beds/Ba | Sqft | Sold | Price | $/sf | Match |
|---|---|---|---|---|---|---|---|
| 312 Marlborough Rd #14 | 0.42mi | 4/2.0 | 1,632 (+8%) | 12mo | $174,900 | $107 | 57 |
Match score weights: distance 35% · size 25% · config 20% · recency 20%. Top-matched comps best support the ARV.
Projected returns pro-forma
-3.0% appreciation · 5.85% rent growth · sell at horizon
- IRR
- -11.2%
- Equity multiple
- 0.58×
- Total profit
- $-27,994
- Equity at exit
- $35,636
- IRR
- 1.3%
- Equity multiple
- 1.11×
- Total profit
- $7,094
- Equity at exit
- $20,664
Cash invested: $66,920 (down + closing). Projections, not guarantees.
Landlord ↔ Tenant lean methodology
- Overall (STATE)
- 15 Strongly Tenant-Friendly
- State New York
- 15 Strongly Tenant-Friendly · D+10
- County
- — inherits STATE
- City
- — inherits STATE
ZIP-level market 13206
- Home prices YoY
- -7.1%
- Rents YoY
- 5.8%
- Active inventory
- 43
- Price-to-rent
- 10.1×
Monthly cashflow live
- Estimated rent
- $1,976 high interval (Pro) →
- Mortgage (P&I)
- −$1,253
- Tax from tax record
- −$130 /mo · $1,562/yr
- Insurance
- −$100
- HOA
- −$0
- Vacancy / Maint / Mgmt
- −$415
- Net cashflow
- $78
Break-even live
Sensitivity live
| Price | -10% $213 | -5% $146 | +0% $78 | +5% $11 | +10% $-57 |
|---|---|---|---|---|---|
| Rent | -10% $-78 | -5% $0 | +0% $78 | +5% $156 | +10% $234 |
| Rate | -1.0pp $199 | -0.5pp $139 | base $78 | +0.5pp $16 | +1.0pp $-47 |
UW: 25.0% down · 7.5% · 30yr · 1.5% tax · 5.0% vac · 8.0% maint · 8.0% mgmt
Financing live
Cash to close
- Down payment
- $59,750
- Closing costs
- $7,170
- Reserves months
- —
- Total cash needed
- —
Loan-product check · same deal, 3 products live
Conventional
25% down · 7.5% · 30yr
- Down + closing
- —
- Monthly P&I
- —
- Monthly cashflow
- —
- DSCR
- —
- Eligible?
- —
Personal DTI + credit; lowest rate.
DSCR
20% down · 8.5% · 30yr
- Down + closing
- —
- Monthly P&I
- —
- Monthly cashflow
- —
- DSCR
- —
- Eligible?
- —
No personal income docs; deal must DSCR.
Hard money
10% down · 12.0% · 12mo
- Down + closing
- —
- Monthly P&I
- —
- Monthly cashflow
- —
- DSCR
- —
- Eligible?
- —
Short-term bridge; refi at stabilization.
Rent comps 8 comps
| Address | Beds | Baths | Sqft | Rent | $/sqft | DOM | Units | Dist |
|---|---|---|---|---|---|---|---|---|
| 1801 James St #2 Syracuse, NY | 3.0 | 1.0 | 1244 | $1,800 | $1.45 | 15d | 1 | 0.37mi |
| 202 Stafford Ave Syracuse, NY | 3.0 | 1.0 | 1692 | $1,800 | $1.06 | 15d | 1 | 0.51mi |
| 423 Wendell Ter Syracuse, NY | 4.0 | 1.0 | 1312 | $2,500 | $1.91 | 15d | 1 | 0.51mi |
| 297 Norwood Ave Syracuse, NY | 3.0 | 1.0 | 1188 | $2,050 | $1.73 | 23d | 1 | 0.52mi |
| 204 Mariposa St Unit pvt house Syracuse, NY | 3.0 | 1.0 | 1128 | $2,137 | $1.89 | 15d | 1 | 0.63mi |
| 126 Woodruff Ave Syracuse, NY | 3.0 | 1.0 | 1200 | $1,675 | $1.40 | 45d | 1 | 0.89mi |
| 746 E Laurel St Unit 1 Syracuse, NY | 4.0 | 2.0 | 1400 | $1,500 | $1.07 | 45d | 1 | 1.38mi |
| 286 Ross Park Syracuse, NY | 3.0 | 1.0 | 1100 | $1,500 | $1.36 | 46d | 1 | 1.43mi |
HOA detail condo
- Monthly dues
- $0 · $0/yr
- Assessments
- None detected in remarks — confirm with the listing agent.
Listing history 10 events
-
2026-04-09status Pending
-
2026-03-14historical $1,350
-
2026-03-13historical Active Under Contract
-
2026-02-26$1,350
-
2026-02-26price $239,000
-
2026-02-22$220,000 Active
-
2019-02-25soldstatus $50,000
-
2018-01-08status Under Contract- Do Not Show
-
2018-01-08historical
-
2018-01-04$90,000 Active
ⓘ Source: listings_history table (triggers on properties + properties_extension) + one-shot
backfill from property_details.listing_events for pre-trigger history.
Tax reassessment forecast NY · Partial reset (capped growth)
- Current annual tax
- $1,562 · $130/mo
- Projected year-2 tax
- $2,800 · $233/mo
- Expected delta
- +$1,239/yr (+$103/mo · 79.3%)
ⓘ Screening estimate from a state-policy table — verify with the county assessor before closing.
Climate risk First Street
- Flood 1/10 Low FEMA zone X (unshaded) · 0% chance over 30 yrs
- Wildfire 1/10 Low
- Heat 3/10 Moderate 7 d/yr ≥95°F today · 16 d/yr by 30 yrs out
- Wind 1/10 Low 0% chance of damaging wind over 30 yrs
- Air quality 2/10 Low 0 unhealthy d/yr today · 1 by 30 yrs out
Nearby sold comps map
Loading sold comps map…
Walkable amenities ~0.75 mi
Loading nearby amenities…
Taxation est. · year 1
- Rental income
- $23,715
- − Mortgage interest
- −$13,388
- − Property taxes
- −$1,562
- − Insurance
- −$1,195
- − Repairs & maintenance
- −$1,897
- − Management
- −$1,897
- − Depreciation
- −$6,953
- Taxable loss
- −$3,176
- Est. tax savings @ 24.0%
- +$762
- After-tax cash flow
- $1,701/yr
For passive investors: Depreciation is non-cash, so a rental often shows a tax loss while cash-flowing — sheltering income. Rental losses are passive: they offset passive income freely, and up to $25,000/yr can offset ordinary (W-2) income if you actively participate and your MAGI is under $100k (phasing out to $0 by $150k); unused losses carry forward. On sale, claimed depreciation is recaptured at up to 25%, and gains may owe capital-gains tax (a 1031 exchange can defer both). Figures are a year-1 estimate at your 24.0% rate — not tax advice; consult a CPA.
Schools (NCES district)
- District
- Syracuse City School District
- NCES district ID
- 3628590
- Math proficiency
- 18% ▼ -5.00%
- Reading proficiency
- 26% ▬ 0.00%
- Median HH income
- $32,097
- Composite
- 17.83/100
- National rank
- #9007
- State rank
- #590 of 590 in NY
Livability — Syracuse
- Score
- 77/100
- State rank
- #187
- US rank
- #2869
Category grades
Schools grade is shown separately in the Schools card above.
Census & demographics
- Census place
- Syracuse, NY
- County
- Onondaga County · 247,257 people
- City population
- 152,627
- Metro
- Syracuse, NY
- Population (ZIP)
- 16,245
- Household income
- $63,136
- Rent vs Own
- Severe rent burden
- 725.0
Population outlook (Onondaga County) Hauer SSP2
- Today (2025)
- 467,894 people
- By 2030
- 463,381 · -1.0%
- By 2040
- 447,697 · -4.3%
- By 2050
- 426,399 · -8.9%
- By 2075
- 373,661 · -20.1%
- By 2100
- 307,967 · -34.2%
Race, ethnicity, and origin ACS 2023
- Neighborhood character
- Predominantly White (67%)
- Race & ethnicity
- White 67% Black 13% Two or more races 9% Hispanic / Latino 8% Asian 5%
- Hispanic origin (detail)
- Puerto Rican 4%
- Common ancestry
- Romanian 6% Lithuanian 4% Slovak 2%
- Foreign-born
- 8% · Canada, Jamaica, China
- Languages at home
- 89% English-only · Spanish 3% Arabic 2% Other Indo-European 1%
Political lean MEDSL · Onondaga
- 2024 margin
- D (+17.3) · D 58.6% · R 41.4%
- 2008→2024 swing
- -3.0pp toward R · 2008: 20.3pp · 2024: 17.3pp
- All cycles
- 2024: D+17.3 2020: D+20.6 2016: D+12.8 2012: D+21.1 2008: D+20.3
Not yet ingested
- Civics
- —
Market trends
- HPI YoY
- ▼ -24.60%
- Current HPI
- 322.231
- Rent YoY
- ▲ 5.85%
- Metro
- Syracuse, NY
- State GDP YoY
- ▲ 2.60%
- F500 in state
- 92
Industry mix (Fortune 500 HQ in NY)
| Industry | F500 HQs | Revenue |
|---|---|---|
| Financial Services | 10 | $950B |
|
||
| Consumer Goods | 9 | $162B |
|
||
| Insurance | 4 | $225B |
|
||
| Telecommunications | 2 | $144B |
|
||
| Pharmaceuticals | 2 | $112B |
|
||
| Media / Entertainment | 2 | $69B |
|
||
Price history
-98.5% since first listed10 events — show timeline
- 2026-04-09 Pending — CNYIS
- 2026-03-14 Rental Removed $1,350 CNYIS
- 2026-03-13 Contingent — CNYIS
- 2026-02-26 Listed for Rent $1,350 CNYIS
- 2026-02-26 Price Changed $239,000 CNYIS
- 2026-02-22 Listed $220,000 CNYIS
- 2019-02-25 Sold (Public Records) $50,000 Public Records
- 2018-01-08 Pending — CNYIS
- 2018-01-08 Listing Removed — CNYIS
- 2018-01-04 Listed $90,000 CNYIS
Property tax history
+0.2%/yrLatest (2025): $1,562 · +0.0% YoY. Source: county tax records.
Cash-flow waterfall
monthlySold comps — $/sqft
last 12 mo · ≤1 miLoading sold comps…