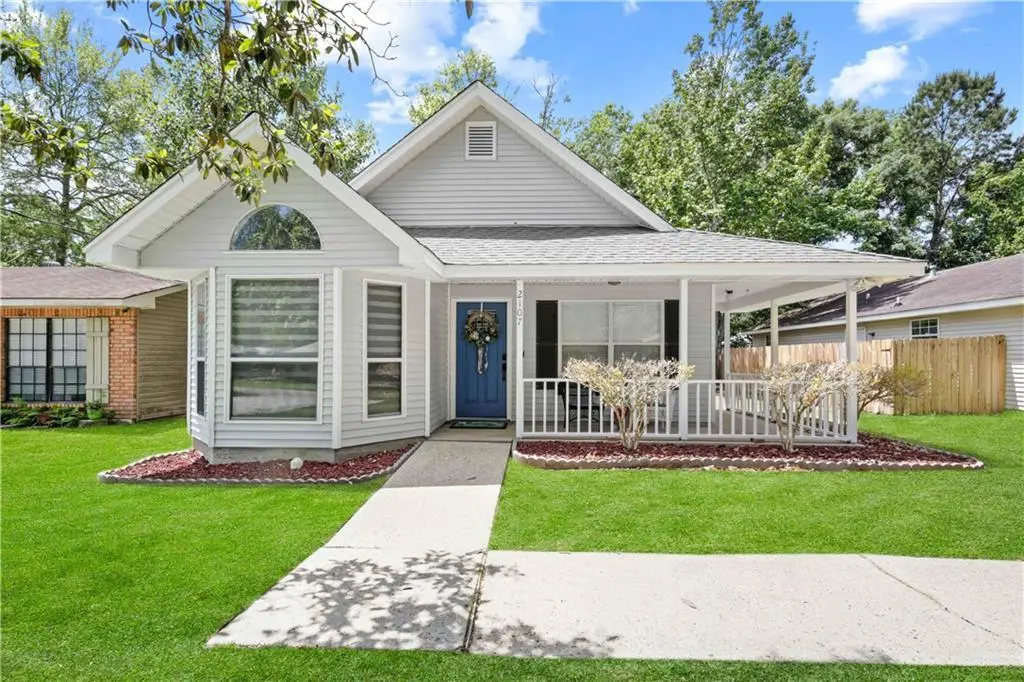
2107 Bluebird St · Slidell, LA
Flood risk 5/10 · Moderate
- FEMA flood zone
- X
- Chance of flooding over 30 yrs
- 0.47%
- Est. flood insurance / yr
- $507 – $1,088
Fire risk 4/10 · Minor
- Est. fire insurance / yr
- $1,269 – $2,357
Heat risk 10/10 · Severe
- Hot days now (above 108°F)
- 7 days/yr
- Hot days in 30 yrs
- 22 days/yr
Wind risk 9/10 · Severe
- Chance of severe wind over 30 yrs
- 99.0%
Air-quality risk 2/10 · Minimal
- Unhealthy air days now
- 1 days/yr
- Unhealthy air days in 30 yrs
- 2 days/yr
Risk factors via First Street. Map © Google.
Why this score? — see what drove the C- grade
The composite is a weighted blend of 9 inputs, each scored 0–100. Each bar is that input's sub-score; the figure is the points it added to the 100-point composite (weight × sub-score).
- Cash flow +17.2/30.0
- ARV discount +10.3/15.0
- DSCR +5.4/10.0
- Schools +4.3/10.0
- Rent growth +4.0/5.0
- 1% rule +3.5/10.0
- Livability +3.5/5.0
- Condition / age +2.5/5.0
- Appreciation +0.0/10.0
$210,000
🖨 Deal sheet 📄 Offer letter ✓ Due diligence
Listing remarks MLS
100% FINANCING AVAILABLE--MOVE RIGHT IN! Flooded with natural light... this home showcases SOARING CATHEDRAL CEILINGS in the den, kitchen/dining, and primary suite--creating an open, airy feel buyers LOVE! Spacious den with fireplace and 65" TV CAN STAY for instant comfort and convenience. The kitchen shines with NEW GRANITE COUNTERS, UNDERMOUNT SINK & NEW DISHWASHER plus stainless appliances (refrigerator INCLUDED!) and pantry for storage. Enjoy peace of mind with WATER HEATER & NEST THERMOSTAT UNDER 3 YEARS OLD, fresh paint throughout, double-insulated windows, and NO CARPET--ONLY TILE, REAL WOOD & ENGINEERED FLOORING. Generous laundry room offers extra shelving and comes complete with WASHER & DRYER. Step outside to a WRAP-AROUND PORCH & BRICK PATIO-- Great for entertaining! Fenced yard with shed and POTENTIAL BACKYARD ACCESS add even more value. This one checks ALL the boxes--DON'T MISS IT!
Key facts
- Undermount sink
- Stainless appliances
- Pantry for storage
Tags
Property features AI
Exterior
- Parking: Driveway
- Utilities: Public water; Sewer to treatment plant
- Home design: Single-story; Very good condition
- Construction: Shingle roof; Slab foundation
- Exterior features: Brick patio/porch; Rectangular lot; Outside city limits
Interior
- Kitchen: Dishwasher; Microwave; Oven; Range
- Bedrooms: Total of 6 rooms (includes bedrooms and living areas)
- Bathrooms: 2 full bathrooms
- Heating & cooling: Central heating; Central air conditioning
- Interior features: Ceiling fan(s); Wood-burning fireplace
Neighborhood map
What this means for you Summary
Snapshot
- This is a 3-bed/2.0-bath single-family listed at $210k.
Deal economics
- At list price, monthly cash flow is $151 ($2k/yr) — positive.
- The deal already cash-flows at list — no discount required.
- To meet the 1% rule (rent ≥ 1% of price), the offer needs to be $179k (14.7% below list).
- Recommended offer: $179k (14.7% below list) — sets the bar for 1% rule.
- Cap rate 7.2% vs local median 5.9% in Slidell — meaningfully above typical; check what's discounted (condition, days-on-market, listing class) to confirm the premium yield is real.
Location & tenants
- Location reads 70/100 on livability (#57 in LA) — a middle-class / working-renter tenant base. Strengths: cost of living A+, housing A+, health & safety A+; Watch: amenities F, commute F.
- St. Tammany Parish (suburban): math 43% / reading 55% proficiency, ranked #11 of 98 in LA (top 11%) — families likely to look elsewhere, expect single-tenant / working-renter base with shorter leases.
- Market conditions: Rents rising fast (+5.9%/yr); 241 active listings in the ZIP; 6 comparable units currently listed for rent nearby; rentals lingering (median 44d on market — plan ~5-8 weeks vacancy on turnover, expect pricing pressure); 50% of comp listings sitting > 30 days — soft ceiling on asking rent; 1,064 units permitted in St. Tammany Parish in 2024 (0 in 5+ unit buildings).
- This rent runs 34% of the median local income ($63k/yr) — at the standard rent-burdened threshold; future hikes will face affordability resistance.
Forward outlook
- Local home prices are declining (-3.0%/yr); year-one equity from $1k of loan paydown is wiped out by about $6k of value loss. Plan a longer hold.
- St. Tammany County population projected at +27% by 2050 — long-run rental-demand tailwind backs the buy-and-hold thesis.
Negotiation context
- It's been on market 55 days — a 3% lower offer ($204k) is reasonable based on typical stale-listing flexibility.
- 10 sale attempts since 23y ago with the ask held roughly flat each time — persistent listings suggest the price (not the market) is what's stuck; bring a comps-based counter.
- Current owner paid $140k; list at $210k implies a 50% gain — meaningful room to come down on a strong offer.
Risks & watch-outs
- Climate carrying-cost: moderate flood risk; severe wind risk, 99% chance of damaging wind over 30y; extreme-heat days projected 7→22/yr by 2055 (HVAC capex compounding) — expect insurance premiums to compound above CPI over the hold.
Questions for the listing agent
- It's been on market 55 days. Have you received any prior offers? Is the seller open to a 15% concession, seller financing, or rate buy-down credit?
- Is there a deadline driving the sale (1031 exchange, divorce, estate, relocation)? That informs how much negotiation room exists.
- Schools are B-rated — typically a magnet for longer-tenancy family renters. What's the average tenant stay here, and is there a school-zone premium baked into asking?
- What's the average days-on-market for RENTAL listings here right now (not sales)? A rising rental-DOM trend means longer vacancies and softer asking-rent achievability than the comps imply.
- What's the recent tenant-quality profile in this submarket — average credit score on applications, eviction rate, late-payment / NSF rate, and stable-employment percentage? A property-management company in the area should have these aggregated.
- How much new for-sale + rental construction is in the pipeline within 1–3 miles? Heavy new supply typically softens prices + rents 12–24 months out; constrained supply supports both.
Investment metrics
- 1% rule
- 0.85% ✗
- Cap rate
- 7.15%
- Cash-on-cash
- 3.07%
- DSCR
- 1.14
- GRM
- 9.8
CMA / ARV
- ARV (median comp)
- $223,724
- List price
- $210,000
- Delta
- -6.13%
- Verdict
- FAIR
- Comps
- 20 within 1.0 mi
Show comp detail 12 sales within ~0.75 mi
| Address | Dist | Beds/Ba | Sqft | Sold | Price | $/sf | Match |
|---|---|---|---|---|---|---|---|
| 2110 Mallard St | 0.28mi | 2/2.0 (-1) | 1,266 (+1%) | 1mo | $125,000 | $99 | 80 |
| 2116 Jay St | 0.16mi | 3/2.0 | 1,170 (-6%) | 3mo | $202,500 | $173 | 79 |
| 2406 Bluebird St | 0.37mi | 3/2.0 | 1,218 (-3%) | 0mo | $175,000 | $144 | 78 |
| 2218 Teal St | 0.38mi | 3/2.0 | 1,262 (+1%) | 3mo | $142,000 | $113 | 78 |
| 2523 Bluebird St | 0.58mi | 3/2.0 | 1,222 (-2%) | 2mo | $155,000 | $127 | 68 |
| 2022 Mallard St | 0.29mi | 3/1.0 | 1,148 (-8%) | 1mo | $165,000 | $144 | 67 |
| 2120 Oriole St | 0.23mi | 2/1.0 (-1) | 1,164 (-7%) | 2mo | $153,000 | $131 | 67 |
| 2502 Mallard St | 0.55mi | 3/2.0 | 1,291 (+3%) | 3mo | $172,000 | $133 | 67 |
| 2402 Mallard St | 0.45mi | 3/2.0 | 1,361 (+9%) | 3mo | $125,000 | $92 | 62 |
| 2514 Robin St | 0.54mi | 3/2.0 | 1,334 (+6%) | 2mo | $190,000 | $142 | 62 |
| 2517 Pelican St | 0.55mi | 3/2.0 | 1,367 (+9%) | 1mo | $240,000 | $176 | 58 |
| 2515 Pelican St | 0.54mi | 3/2.0 | 1,405 (+12%) | 3mo | $235,000 | $167 | 52 |
Match score weights: distance 35% · size 25% · config 20% · recency 20%. Top-matched comps best support the ARV.
Projected returns pro-forma
-3.0% appreciation · 5.91% rent growth · sell at horizon
- IRR
- -8.6%
- Equity multiple
- 0.67×
- Total profit
- $-19,132
- Equity at exit
- $31,312
- IRR
- 3.9%
- Equity multiple
- 1.32×
- Total profit
- $18,835
- Equity at exit
- $18,157
Cash invested: $58,800 (down + closing). Projections, not guarantees.
Landlord ↔ Tenant lean methodology
- Overall (STATE)
- 90 Strongly Landlord-Friendly
- State Louisiana
- 90 Strongly Landlord-Friendly · R+12
- County
- — inherits STATE
- City
- — inherits STATE
ZIP-level market 70460
- Rents YoY
- 5.9%
- Active inventory
- 241
- Price-to-rent
- 9.8×
Monthly cashflow live
- Estimated rent
- $1,791 high interval (Pro) →
- Mortgage (P&I)
- −$1,101
- Tax from tax record
- −$75 /mo · $905/yr
- Insurance
- −$88
- HOA
- −$0
- Vacancy / Maint / Mgmt
- −$376
- Net cashflow
- $151
Break-even live
UW: 25.0% down · 7.5% · 30yr · 1.5% tax · 5.0% vac · 8.0% maint · 8.0% mgmt
Financing live
Cash to close
- Down payment
- $52,500
- Closing costs
- $6,300
- Reserves months
- —
- Total cash needed
- —
Loan-product check · same deal, 3 products live
Conventional
25% down · 7.5% · 30yr
- Down + closing
- —
- Monthly P&I
- —
- Monthly cashflow
- —
- DSCR
- —
- Eligible?
- —
Personal DTI + credit; lowest rate.
DSCR
20% down · 8.5% · 30yr
- Down + closing
- —
- Monthly P&I
- —
- Monthly cashflow
- —
- DSCR
- —
- Eligible?
- —
No personal income docs; deal must DSCR.
Hard money
10% down · 12.0% · 12mo
- Down + closing
- —
- Monthly P&I
- —
- Monthly cashflow
- —
- DSCR
- —
- Eligible?
- —
Short-term bridge; refi at stabilization.
Rent comps 6 comps
| Address | Beds | Baths | Sqft | Rent | $/sqft | DOM | Units | Dist |
|---|---|---|---|---|---|---|---|---|
| 2402 Pelican St Slidell, LA | 3.0 | 2.0 | 1400 | $1,700 | $1.21 | 24d | 1 | 0.37mi |
| 2322 Mallard St Slidell, LA | 3.0 | 2.0 | 1400 | $1,600 | $1.14 | 44d | 1 | 0.44mi |
| 2519 Crane St Slidell, LA | 3.0 | 2.0 | 1160 | $1,600 | $1.38 | 24d | 1 | 0.59mi |
| 34081 Stanley St Slidell, LA | 3.0 | 2.5 | 1832 | $1,950 | $1.06 | 2d | 1 | 1.23mi |
| 444 Holmes Dr Slidell, LA | 4.0 | 2.0 | 1594 | $1,800 | $1.13 | 44d | 1 | 1.42mi |
| 35363 Melody Ln Slidell, LA | 3.0 | 2.0 | 1510 | $1,800 | $1.19 | 44d | 1 | 1.44mi |
Listing history 30 events
-
2026-06-18days on market $210,000 Active 55 DOM
-
2026-06-17days on market $210,000 Active 54 DOM
-
2026-06-16days on market $210,000 Active 53 DOM
-
2026-06-15days on market $210,000 Active 52 DOM
-
2026-06-13days on market $210,000 Active 50 DOM
-
2026-06-10days on market $210,000 Active 47 DOM
-
2026-06-09days on market $210,000 Active 46 DOM
-
2026-06-08days on market $210,000 Active 45 DOM
-
2026-06-07days on market $210,000 Active 44 DOM
-
2026-06-03days on market $210,000 Active 40 DOM
-
2026-06-02days on market $210,000 Active 39 DOM
-
2026-06-01days on market $210,000 Active 38 DOM
-
2026-05-31days on market $210,000 Active 37 DOM
-
2026-04-24$210,000 Active 932-char remark
Show marketing remark (932 chars)
100% FINANCING AVAILABLE--MOVE RIGHT IN! Flooded with natural light... this home showcases SOARING CATHEDRAL CEILINGS in the den, kitchen/dining, and primary suite--creating an open, airy feel buyers LOVE! Spacious den with fireplace and 65" TV CAN STAY for instant comfort and convenience. The kitchen shines with NEW GRANITE COUNTERS, UNDERMOUNT SINK & NEW DISHWASHER plus stainless appliances (refrigerator INCLUDED!) and pantry for storage. Enjoy peace of mind with WATER HEATER & NEST THERMOSTAT UNDER 3 YEARS OLD, fresh paint throughout, double-insulated windows, and NO CARPET--ONLY TILE, REAL WOOD & ENGINEERED FLOORING. Generous laundry room offers extra shelving and comes complete with WASHER & DRYER. Step outside to a WRAP-AROUND PORCH & BRICK PATIO-- Great for entertaining! Fenced yard with shed and POTENTIAL BACKYARD ACCESS add even more value. This one checks ALL the boxes--DON'T MISS IT!
-
2026-04-24$210,000 Active 975-char remark
Show marketing remark (932 chars)
100% FINANCING AVAILABLE--MOVE RIGHT IN! Flooded with natural light... this home showcases SOARING CATHEDRAL CEILINGS in the den, kitchen/dining, and primary suite--creating an open, airy feel buyers LOVE! Spacious den with fireplace and 65" TV CAN STAY for instant comfort and convenience. The kitchen shines with NEW GRANITE COUNTERS, UNDERMOUNT SINK & NEW DISHWASHER plus stainless appliances (refrigerator INCLUDED!) and pantry for storage. Enjoy peace of mind with WATER HEATER & NEST THERMOSTAT UNDER 3 YEARS OLD, fresh paint throughout, double-insulated windows, and NO CARPET--ONLY TILE, REAL WOOD & ENGINEERED FLOORING. Generous laundry room offers extra shelving and comes complete with WASHER & DRYER. Step outside to a WRAP-AROUND PORCH & BRICK PATIO-- Great for entertaining! Fenced yard with shed and POTENTIAL BACKYARD ACCESS add even more value. This one checks ALL the boxes--DON'T MISS IT!
-
2019-12-18soldstatus $140,000
-
2019-12-13soldstatus $140,000 Closed
-
2019-11-11status Pending
-
2019-11-05$149,000
-
2019-11-05$149,000 Active
-
2017-02-06soldstatus $122,000 Sold
-
2016-12-19historical Pending Continue to Show
-
2016-11-07$125,000 Active
-
2016-11-07$125,000
-
2010-03-03$134,900
-
2010-03-03$134,900
-
2004-03-01soldstatus $93,000
-
2004-02-27soldstatus $93,000
-
2003-09-09$91,900
-
2003-09-09$91,900
ⓘ Source: listings_history table (triggers on properties + properties_extension) + one-shot
backfill from property_details.listing_events for pre-trigger history.
Tax reassessment forecast LA · Resets to sale price
- Current annual tax
- $905 · $75/mo
- Projected year-2 tax
- $1,155 · $96/mo
- Expected delta
- +$250/yr (+$21/mo · 27.7%)
ⓘ Screening estimate from a state-policy table — verify with the county assessor before closing.
Climate risk First Street
- Flood 5/10 Major FEMA zone X · 47% chance over 30 yrs
- Wildfire 4/10 Moderate
- Heat 10/10 Extreme 7 d/yr ≥108°F today · 22 d/yr by 30 yrs out
- Wind 9/10 Extreme 99% chance of damaging wind over 30 yrs
- Air quality 2/10 Low 1 unhealthy d/yr today · 2 by 30 yrs out
Nearby sold comps map
Loading sold comps map…
Walkable amenities ~0.75 mi
Loading nearby amenities…
Taxation est. · year 1
- Rental income
- $21,489
- − Mortgage interest
- −$11,763
- − Property taxes
- −$905
- − Insurance
- −$1,050
- − Repairs & maintenance
- −$1,719
- − Management
- −$1,719
- − Depreciation
- −$6,109
- Taxable loss
- −$1,776
- Est. tax savings @ 24.0%
- +$426
- After-tax cash flow
- $2,233/yr
For passive investors: Depreciation is non-cash, so a rental often shows a tax loss while cash-flowing — sheltering income. Rental losses are passive: they offset passive income freely, and up to $25,000/yr can offset ordinary (W-2) income if you actively participate and your MAGI is under $100k (phasing out to $0 by $150k); unused losses carry forward. On sale, claimed depreciation is recaptured at up to 25%, and gains may owe capital-gains tax (a 1031 exchange can defer both). Figures are a year-1 estimate at your 24.0% rate — not tax advice; consult a CPA.
Schools (NCES district)
- District
- St. Tammany Parish
- NCES district ID
- 2201650
- Math proficiency
- 43% ▼ -32.00%
- Reading proficiency
- 55% ▼ -26.00%
- Median HH income
- $61,752
- Composite
- 43.04/100
- National rank
- #3098
- State rank
- #11 of 98 in LA
Livability — Slidell
- Score
- 70/100
- State rank
- #57
- US rank
- #7673
Category grades
Schools grade is shown separately in the Schools card above.
Census & demographics
- County
- Saint Tammany Parish · 228,296 people
- City population
- 95,511
- Metro
- New Orleans-Metairie, LA
- Population (ZIP)
- 21,669
- Household income
- $62,565
- Rent vs Own
- Severe rent burden
- 318.0
Population outlook (St. Tammany County) Hauer SSP2
- Today (2025)
- 286,725 people
- By 2030
- 304,175 · +6.1%
- By 2040
- 336,203 · +17.3%
- By 2050
- 364,590 · +27.2%
- By 2075
- 433,362 · +51.1%
- By 2100
- 470,333 · +64.0%
Race, ethnicity, and origin ACS 2023
- Neighborhood character
- Diverse neighborhood (Simpson 0.62)
- Race & ethnicity
- White 53% Black 29% Two or more races 11% Hispanic / Latino 10% Pacific Islander 2%
- Hispanic origin (detail)
- Mexican 3%
- Common ancestry
- Lithuanian 13% Slovak 1% Italian 1%
- Foreign-born
- 5% · Canada
- Languages at home
- 92% English-only · Spanish 6%
Political lean MEDSL · St. Tammany
- 2024 margin
- Solid R (+43.8) · D 27.3% · R 71.1% · Other 1.6%
- 2008→2024 swing
- +9.6pp toward D · 2008: -53.4pp · 2024: -43.8pp
- All cycles
- 2024: R+43.8 2020: R+44.2 2016: R+50.8 2012: R+52.2 2008: R+53.4
Not yet ingested
- Civics
- —
Market trends
- HPI YoY
- ▼ -93.87%
- Current HPI
- 130.56
- Rent YoY
- ▲ 5.91%
- Metro
- New Orleans-Metairie, LA
- State GDP YoY
- ▲ 3.29%
- F500 in state
- 10
Industry mix (Fortune 500 HQ in LA)
| Industry | F500 HQs | Revenue |
|---|---|---|
| Telecommunications | 2 | $23B |
|
||
| Utilities | 1 | $12B |
|
||
| Wholesale / Distribution | 1 | $5B |
|
||
| Advertising | 1 | $2B |
|
||
Price history
+128.5% since first listed17 events — show timeline
- 2026-04-24 Listed $210,000 GSREIN
- 2026-04-24 Listed $210,000 AcadianaMLS
- 2019-12-18 Sold (Public Records) $140,000 Public Records
- 2019-12-13 Sold (MLS) $140,000 GSREIN
- 2019-11-11 Pending — GSREIN
- 2019-11-05 Listed $149,000 GSREIN
- 2019-11-05 Listed $149,000 AcadianaMLS
- 2017-02-06 Sold (MLS) $122,000 GSREIN
- 2016-12-19 Contingent — GSREIN
- 2016-11-07 Listed $125,000 GSREIN
- 2016-11-07 Listed $125,000 AcadianaMLS
- 2010-03-03 Listed $134,900 GSREIN
- 2010-03-03 Listed $134,900 AcadianaMLS
- 2004-03-01 Sold (Public Records) $93,000 Public Records
- 2004-02-27 Sold (MLS) $93,000 GSREIN
- 2003-09-09 Listed $91,900 GSREIN
- 2003-09-09 Listed $91,900 AcadianaMLS
Property tax history
-3.8%/yrLatest (2025): $905 · -3.8% YoY. Source: county tax records.
Cash-flow waterfall
monthlySold comps — $/sqft
last 12 mo · ≤1 miLoading sold comps…