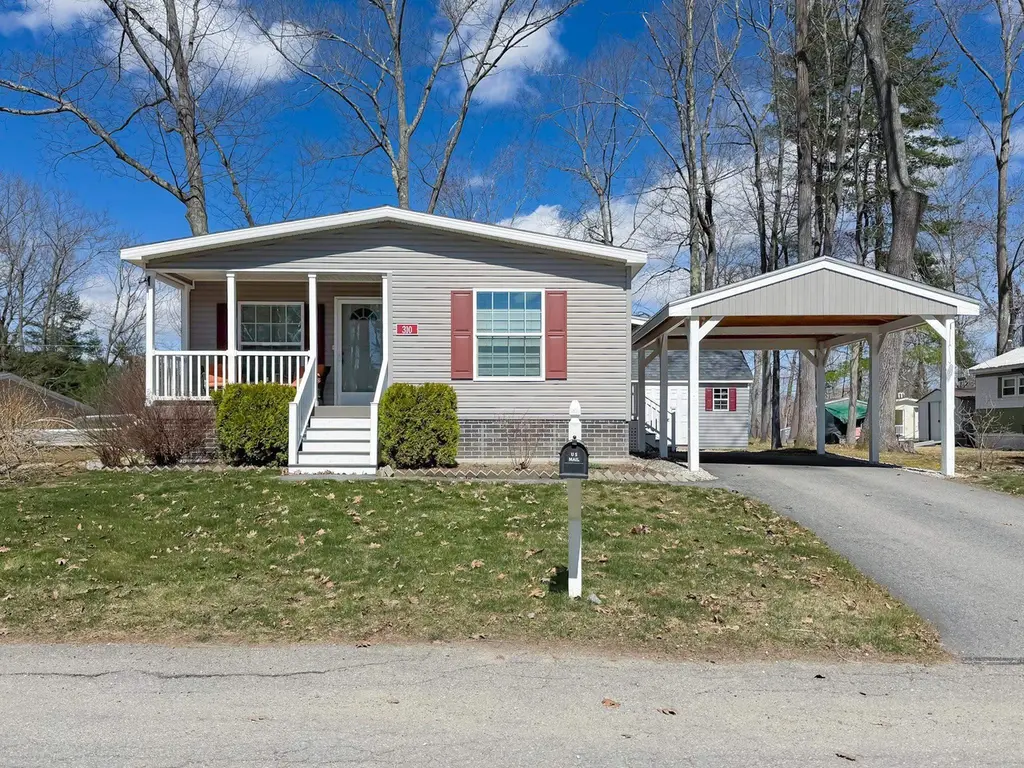
310 Friar Tuck Dr · Exeter, NH
Flood risk No data
- FEMA flood zone
- —
- Chance of flooding over 30 yrs
- —
- Est. flood insurance / yr
- —
Fire risk No data
- Est. fire insurance / yr
- —
Heat risk No data
- Hot days now (above threshold)
- —
- Hot days in 30 yrs
- —
Wind risk No data
- Chance of severe wind over 30 yrs
- —
Air-quality risk No data
- Unhealthy air days now
- —
- Unhealthy air days in 30 yrs
- —
Risk factors via First Street. Map © Google.
Why this score? — see what drove the D grade
The composite is a weighted blend of 9 inputs, each scored 0–100. Each bar is that input's sub-score; the figure is the points it added to the 100-point composite (weight × sub-score).
- Cash flow +13.6/30.0
- 1% rule +9.1/10.0
- Schools +4.6/10.0
- Livability +4.5/5.0
- DSCR +4.1/10.0
- Rent growth +2.5/5.0
- Condition / age +2.5/5.0
- ARV discount +1.5/15.0
- Appreciation +0.0/10.0
$235,000
🖨 Deal sheet 📄 Offer letter ✓ Due diligence
Listing remarks MLS
IMMACULATE HOME IN 55+ COMMUNITY, NEWER CARPETING AND KITCHEN FLOOR, WATER TANK AND FURNACE, ALL APPLIANCES TO STAY WITH HOME. MANY BUILT INS MAKE THIS A VERY DELIGHTFUL HOME TO SHOW. VERY EASY TO SHOW.
Key facts
- Built 2016
- Listed 71 days
Property features AI
Finance
- HOA & community: Monthly association fee (park rent) covering park rent, plowing, sewer, and trash; Association offers RV parking
Exterior
- Parking: RV parking available in the association
- Utilities: Public water; Public sewer; 100 amp electric service; High-speed internet available; Propane (LP/Bottle) gas
- Home design: Manufactured/mobile home; Existing construction; Located in River Run park; Park-approved placement; Mobile is anchored
- Construction: Built in 2016; Vinyl siding; Asphalt shingle roof
- Exterior features: Corner lot; Near shopping; In a neighborhood; Near hospital; Paved driveway
Interior
- Flooring: Vinyl plank
- Bathrooms: 2 full bathrooms
- Heating & cooling: Propane heat; Central air conditioning
- Interior features: 5 total rooms; Vinyl plank flooring
Neighborhood map
What this means for you Summary
Snapshot
- This is a 3-bed/2.0-bath manufactured listed at $235k.
Deal economics
- At list price, monthly cash flow is $14 ($165/yr) — positive.
- The deal already cash-flows at list — no discount required.
- Meets the 1% rule at list price ($3k rent vs $235k).
- Recommended offer: $221k (6.0% below list) — sets the bar for market timing.
- Cap rate 6.4% vs local median 2.8% in Exeter — top-decile yield for the area; either an underpriced asset or a hidden risk that comps aren't pricing in. Stress-test before assuming the spread holds.
Location & tenants
- Location reads 91/100 on livability (#1 in NH, #59 nationally) — a professional / high-income tenant draw. Strengths: crime A+, amenities A+, commute A+.
- Exeter School District (suburban): math 46% / reading 57% proficiency, ranked #32 of 98 in NH (top 33%) — acceptable for families but not a draw, mixed tenant base, ~2y average lease; only 13% free/reduced lunch — higher-income household profile.
- Market conditions: 142 active listings in the ZIP; 2 comparable units currently listed for rent nearby; high-income renter base; 1,276 units permitted in Rockingham County in 2024 (593 in 5+ unit buildings).
- This rent runs 33% of the median local income ($119k/yr) — at the standard rent-burdened threshold; future hikes will face affordability resistance.
Forward outlook
- Local home prices are declining (-3.0%/yr); year-one equity from $2k of loan paydown is wiped out by about $7k of value loss. Plan a longer hold.
Negotiation context
- It's been on market 71 days — a 6% lower offer ($221k) is reasonable based on typical stale-listing flexibility.
- 3 sale attempts since 26y ago with the ask held roughly flat each time — persistent listings suggest the price (not the market) is what's stuck; bring a comps-based counter.
- Current owner paid $24k; list at $235k implies a 859% gain — meaningful room to come down on a strong offer.
Risks & watch-outs
- Watch-outs: HOA is 27% of rent.
Questions for the listing agent
- It's been on market 71 days. Have you received any prior offers? Is the seller open to a 6% concession, seller financing, or rate buy-down credit?
- What does the HOA fee cover, when was the last increase, and are there any pending special assessments or reserve-fund shortfalls?
- Why hasn't it sold? Are there any deal-killer items the seller is aware of (foundation, flood, title, zoning, code violations)?
- Is there a deadline driving the sale (1031 exchange, divorce, estate, relocation)? That informs how much negotiation room exists.
- Schools are A-rated — typically a magnet for longer-tenancy family renters. What's the average tenant stay here, and is there a school-zone premium baked into asking?
- The area grade is low — what's the realistic commute time and amenity access for the typical tenant pool here? Any planned neighborhood developments (good or bad) we should know about?
- What's the average days-on-market for RENTAL listings here right now (not sales)? A rising rental-DOM trend means longer vacancies and softer asking-rent achievability than the comps imply.
- What's the recent tenant-quality profile in this submarket — average credit score on applications, eviction rate, late-payment / NSF rate, and stable-employment percentage? A property-management company in the area should have these aggregated.
- How much new for-sale + rental construction is in the pipeline within 1–3 miles? Heavy new supply typically softens prices + rents 12–24 months out; constrained supply supports both.
Investment metrics
- 1% rule
- 1.41% ✓
- Cap rate
- 6.36%
- Cash-on-cash
- 0.25%
- DSCR
- 1.01
- GRM
- 5.9
CMA / ARV
- ARV (on-the-fly)
- $207,207
- Comps found
- 12
Show comp detail 12 sales within ~0.75 mi
| Address | Dist | Beds/Ba | Sqft | Sold | Price | $/sf | Match |
|---|---|---|---|---|---|---|---|
| 23 Juniper St | 0.08mi | 3/2.0 | 1,344 (+4%) | 6mo | $260,000 | $193 | 84 |
| 807 Nottingham Dr | 0.08mi | 2/1.5 (-1) | 1,230 (-4%) | 2mo | $85,000 | $69 | 81 |
| 220 Robin Hood Dr #220 | 0.23mi | 3/2.0 | 1,352 (+5%) | 0mo | $187,500 | $139 | 80 |
| 104 Robin Hood Dr | 0.42mi | 3/2.0 | 1,296 (+1%) | 1mo | $239,900 | $185 | 79 |
| 75 Hilton Ave | 0.19mi | 3/2.0 | 1,188 (-8%) | 0mo | $272,000 | $229 | 78 |
| 605 Canterbury Dr | 0.16mi | 3/2.0 | 1,372 (+7%) | 5mo | $125,000 | $91 | 77 |
| 609 Canterbury Dr | 0.04mi | 2/2.0 (-1) | 1,464 (+14%) | 1mo | $250,000 | $171 | 70 |
| 426 Friar Tuck Dr | 0.01mi | 2/2.0 (-1) | 1,464 (+14%) | 2mo | $150,000 | $102 | 69 |
| 6 Dow St | 0.33mi | 3/1.0 | 1,170 (-9%) | 1mo | $190,000 | $162 | 64 |
| 802 Nottingham Dr Unit 79-802 | 0.10mi | 2/1.0 (-1) | 1,100 (-14%) | 2mo | $95,000 | $86 | 61 |
| 97 Linden St #4 | 0.41mi | 3/2.0 | 1,152 (-10%) | 4mo | $185,500 | $161 | 60 |
| 49 Lindenshire Ave | 0.60mi | 2/1.0 (-1) | 1,204 (-6%) | 6mo | $152,000 | $126 | 47 |
Match score weights: distance 35% · size 25% · config 20% · recency 20%. Top-matched comps best support the ARV.
Projected returns pro-forma
-3.0% appreciation · 3.0% rent growth · sell at horizon
- IRR
- -15.6%
- Equity multiple
- 0.44×
- Total profit
- $-36,548
- Equity at exit
- $35,039
- IRR
- -6.6%
- Equity multiple
- 0.57×
- Total profit
- $-28,036
- Equity at exit
- $20,319
Cash invested: $65,800 (down + closing). Projections, not guarantees.
Landlord ↔ Tenant lean methodology
- Overall (STATE)
- 56 Moderately Landlord-Leaning
- State New Hampshire
- 56 Moderately Landlord-Leaning · D+1
- County
- — inherits STATE
- City
- — inherits STATE
ZIP-level market 03833
- Active inventory
- 142
- Price-to-rent
- 5.9×
Monthly cashflow live
- Estimated rent
- $3,318 medium interval (Pro) →
- Mortgage (P&I)
- −$1,232
- Tax from tax record
- −$377 /mo · $4,525/yr
- Insurance
- −$98
- HOA
- −$900
- Vacancy / Maint / Mgmt
- −$697
- Net cashflow
- $14
Break-even live
UW: 25.0% down · 7.5% · 30yr · 1.5% tax · 5.0% vac · 8.0% maint · 8.0% mgmt
Financing live
Cash to close
- Down payment
- $58,750
- Closing costs
- $7,050
- Reserves months
- —
- Total cash needed
- —
Loan-product check · same deal, 3 products live
Conventional
25% down · 7.5% · 30yr
- Down + closing
- —
- Monthly P&I
- —
- Monthly cashflow
- —
- DSCR
- —
- Eligible?
- —
Personal DTI + credit; lowest rate.
DSCR
20% down · 8.5% · 30yr
- Down + closing
- —
- Monthly P&I
- —
- Monthly cashflow
- —
- DSCR
- —
- Eligible?
- —
No personal income docs; deal must DSCR.
Hard money
10% down · 12.0% · 12mo
- Down + closing
- —
- Monthly P&I
- —
- Monthly cashflow
- —
- DSCR
- —
- Eligible?
- —
Short-term bridge; refi at stabilization.
Rent comps 2 comps
| Address | Beds | Baths | Sqft | Rent | $/sqft | DOM | Units | Dist |
|---|---|---|---|---|---|---|---|---|
| 216B Front St Exeter, NH | 4.0 | 2.0 | 1700 | $3,495 | $2.06 | 2d | 1 | 1.09mi |
| 23 Garfield St Exeter, NH | 3.0 | 2.0 | 1853 | $3,800 | $2.05 | 2d | 1 | 1.28mi |
HOA detail
- Monthly dues
- $900 · $10,800/yr
- Likely covers
- water
Listing history 22 events
-
2026-06-18days on market $235,000 Active 71 DOM
-
2026-06-17days on market $235,000 Active 70 DOM
-
2026-06-16days on market $235,000 Active 69 DOM
-
2026-06-15days on market $235,000 Active 68 DOM
-
2026-06-13days on market $235,000 Active 66 DOM
-
2026-06-13days on market $235,000 Active 65 DOM
-
2026-06-09days on market $235,000 Active 62 DOM
-
2026-06-08days on market $235,000 Active 61 DOM
-
2026-06-07days on market $235,000 Active 60 DOM
-
2026-06-04days on market $235,000 Active 57 DOM
-
2026-06-03days on market $235,000 Active 56 DOM
-
2026-06-02days on market $235,000 Active 55 DOM
-
2026-06-01days on market $235,000 Active 54 DOM
-
2026-05-31days on market $235,000 Active 53 DOM
-
2026-04-08$245,000 Active
-
2005-07-01soldstatus $24,500 202-char remark
Show marketing remark (202 chars)
IMMACULATE HOME IN 55+ COMMUNITY, NEWER CARPETING AND KITCHEN FLOOR, WATER TANK AND FURNACE, ALL APPLIANCES TO STAY WITH HOME. MANY BUILT INS MAKE THIS A VERY DELIGHTFUL HOME TO SHOW. VERY EASY TO SHOW.
-
2005-07-01soldstatus $24,500
Show marketing remark (202 chars)
IMMACULATE HOME IN 55+ COMMUNITY, NEWER CARPETING AND KITCHEN FLOOR, WATER TANK AND FURNACE, ALL APPLIANCES TO STAY WITH HOME. MANY BUILT INS MAKE THIS A VERY DELIGHTFUL HOME TO SHOW. VERY EASY TO SHOW.
-
2005-06-07historical 202-char remark
Show marketing remark (202 chars)
IMMACULATE HOME IN 55+ COMMUNITY, NEWER CARPETING AND KITCHEN FLOOR, WATER TANK AND FURNACE, ALL APPLIANCES TO STAY WITH HOME. MANY BUILT INS MAKE THIS A VERY DELIGHTFUL HOME TO SHOW. VERY EASY TO SHOW.
-
2005-05-05$29,500 202-char remark
Show marketing remark (202 chars)
IMMACULATE HOME IN 55+ COMMUNITY, NEWER CARPETING AND KITCHEN FLOOR, WATER TANK AND FURNACE, ALL APPLIANCES TO STAY WITH HOME. MANY BUILT INS MAKE THIS A VERY DELIGHTFUL HOME TO SHOW. VERY EASY TO SHOW.
-
2001-05-09soldstatus $26,000 127-char remark
Show marketing remark (127 chars)
VERY WELL MAINTAINED HOME WITH RAMP IN "OVER 55" PARK. NEWER CARPETING, WATER TANK AND FURNACE. LITTLE NOTICE NEEDED.
-
2001-04-24historical 127-char remark
Show marketing remark (127 chars)
VERY WELL MAINTAINED HOME WITH RAMP IN "OVER 55" PARK. NEWER CARPETING, WATER TANK AND FURNACE. LITTLE NOTICE NEEDED.
-
2000-10-22$29,900 127-char remark
Show marketing remark (127 chars)
VERY WELL MAINTAINED HOME WITH RAMP IN "OVER 55" PARK. NEWER CARPETING, WATER TANK AND FURNACE. LITTLE NOTICE NEEDED.
ⓘ Source: listings_history table (triggers on properties + properties_extension) + one-shot
backfill from property_details.listing_events for pre-trigger history.
Tax reassessment forecast NH · Partial reset (capped growth)
- Current annual tax
- $4,525 · $377/mo
- Projected year-2 tax
- $4,824 · $402/mo
- Expected delta
- +$299/yr (+$25/mo · 6.6%)
ⓘ Screening estimate from a state-policy table — verify with the county assessor before closing.
Nearby sold comps map
Loading sold comps map…
Walkable amenities ~0.75 mi
Loading nearby amenities…
Taxation est. · year 1
- Rental income
- $39,815
- − Mortgage interest
- −$13,164
- − Property taxes
- −$4,525
- − Insurance
- −$1,175
- − Repairs & maintenance
- −$3,185
- − Management
- −$3,185
- − HOA
- −$10,800
- − Depreciation
- −$6,836
- Taxable loss
- −$3,055
- Est. tax savings @ 24.0%
- +$733
- After-tax cash flow
- $899/yr
For passive investors: Depreciation is non-cash, so a rental often shows a tax loss while cash-flowing — sheltering income. Rental losses are passive: they offset passive income freely, and up to $25,000/yr can offset ordinary (W-2) income if you actively participate and your MAGI is under $100k (phasing out to $0 by $150k); unused losses carry forward. On sale, claimed depreciation is recaptured at up to 25%, and gains may owe capital-gains tax (a 1031 exchange can defer both). Figures are a year-1 estimate at your 24.0% rate — not tax advice; consult a CPA.
Schools (NCES district)
- District
- Exeter School District
- NCES district ID
- 3302970
- Math proficiency
- 46% ▼ -21.00%
- Reading proficiency
- 57% ▼ -14.00%
- Median HH income
- $69,970
- Composite
- 45.9/100
- National rank
- #2549
- State rank
- #32 of 98 in NH
Livability — Exeter
- Score
- 91/100
- State rank
- #1
- US rank
- #59
Category grades
Schools grade is shown separately in the Schools card above.
Census & demographics
- Census place
- Exeter, NH
- County
- Rockingham County · 137,526 people
- City population
- 22,817
- Metro
- Boston-Cambridge-Newton, MA-NH
- Population (ZIP)
- 22,817
- Household income
- $119,393
- Rent vs Own
- Severe rent burden
- 485.0
Population outlook (Rockingham County) Hauer SSP2
- Today (2025)
- 316,118 people
- By 2030
- 320,929 · +1.5%
- By 2040
- 323,358 · +2.3%
- By 2050
- 314,977 · -0.4%
- By 2075
- 297,686 · -5.8%
- By 2100
- 256,363 · -18.9%
Race, ethnicity, and origin ACS 2023
- Neighborhood character
- Predominantly White (91%)
- Race & ethnicity
- White 91% Two or more races 4% Asian 3% Hispanic / Latino 2%
- Common ancestry
- Lithuanian 8% Slovak 5% Romanian 5%
- Foreign-born
- 6% · Canada, China, South Korea
- Languages at home
- 93% English-only · Spanish 2% Other Indo-European 1% German/W. Germanic 1%
Political lean MEDSL · Rockingham
- 2024 margin
- Toss-up / Even · D 48.3% · R 50.8%
- 2008→2024 swing
- -3.5pp toward R · 2008: 1.1pp · 2024: -2.4pp
- All cycles
- 2024: R+2.4 2020: D+2.1 2016: R+5.8 2012: R+4.5 2008: D+1.1
Not yet ingested
- Civics
- —
Market trends
- HPI YoY
- ▼ -202.07%
- Current HPI
- 288.0139
- Rent YoY
- —
- Metro
- Boston-Cambridge-Newton, MA-NH
- State GDP YoY
- —
- F500 in state
- 0
Price history
+719.4% since first listed8 events — show timeline
- 2026-04-08 Listed $245,000 PrimeMLS
- 2005-07-01 Sold (Public Records) $24,500 Public Records
- 2005-07-01 Sold (MLS) $24,500 PrimeMLS
- 2005-06-07 Delisted — PrimeMLS
- 2005-05-05 Listed $29,500 PrimeMLS
- 2001-05-09 Sold (MLS) $26,000 PrimeMLS
- 2001-04-24 Delisted — PrimeMLS
- 2000-10-22 Listed $29,900 PrimeMLS
Property tax history
+3.9%/yrLatest (2025): $4,525 · +5.5% YoY. Source: county tax records.
Cash-flow waterfall
monthlySold comps — $/sqft
last 12 mo · ≤1 miLoading sold comps…