 🔨 Auction
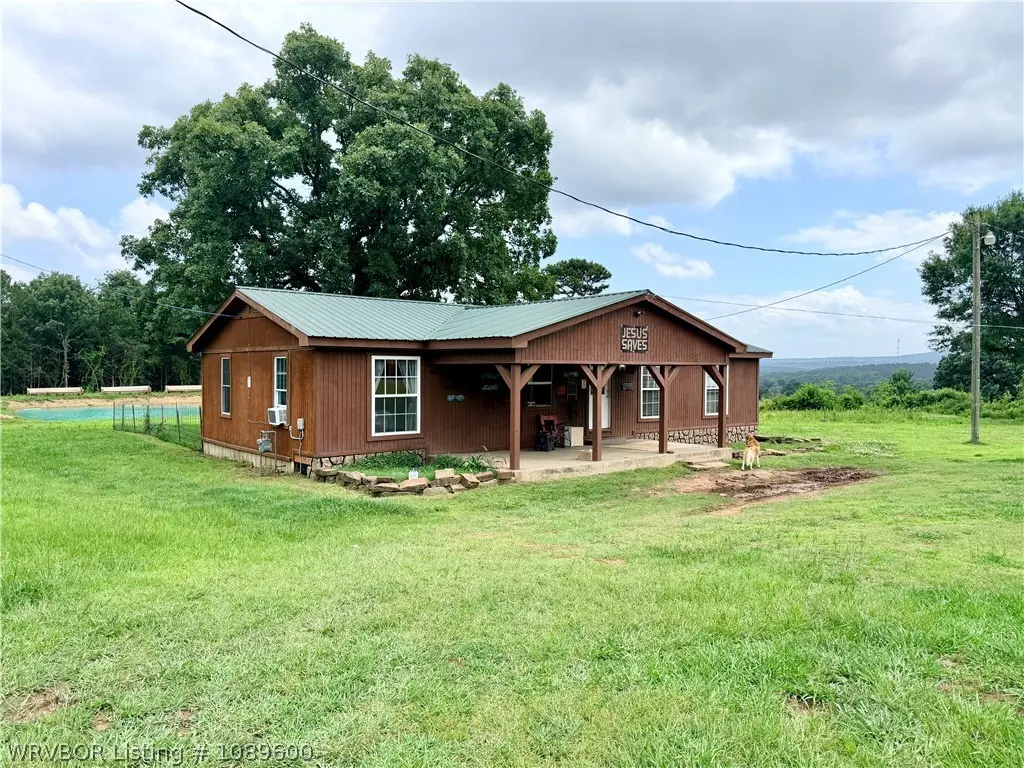
3377 Lucas Bottom Rd · Booneville, AR
Flood risk 1/10 · Minimal
- FEMA flood zone
- —
- Chance of flooding over 30 yrs
- 0.0%
- Est. flood insurance / yr
- —
Fire risk 7/10 · Major
- Est. fire insurance / yr
- $1,499 – $2,785
Heat risk 6/10 · Moderate
- Hot days now (above 113°F)
- 7 days/yr
- Hot days in 30 yrs
- 20 days/yr
Wind risk 2/10 · Minimal
- Chance of severe wind over 30 yrs
- 2.0%
Air-quality risk 2/10 · Minimal
- Unhealthy air days now
- 0 days/yr
- Unhealthy air days in 30 yrs
- 1 days/yr
Risk factors via First Street. Map © Google.
Why this score? — see what drove the D+ grade
The composite is a weighted blend of 9 inputs, each scored 0–100. Each bar is that input's sub-score; the figure is the points it added to the 100-point composite (weight × sub-score).
- Cash flow +15.0/30.0
- ARV discount +7.5/15.0
- 1% rule +5.0/10.0
- DSCR +5.0/10.0
- Livability +3.6/5.0
- Schools +3.0/10.0
- Appreciation +2.6/10.0
- Rent growth +2.5/5.0
- Condition / age +2.5/5.0
$1
🖨 Deal sheet (PDF) 📄 Offer letter ✓ Due diligence
Listing remarks
Real Estate Auction – July 8, 2026 at 9:00 AM 3377 Lucas Bottom Rd, Booneville, AR Don't miss this opportunity to purchase a beautiful country property in the heart of western Arkansas at auction. Situated on 2.3 +/- acres (to be surveyed), this property offers scenic rural living with stunning views, a pond, and multiple improvements that create endless possibilities for homeowners, investors, or those seeking a peaceful retreat. The main residence features approximately 1,296 square feet with 3 bedrooms and 1 bathroom, providing a comfortable layout with plenty of potential to make it your own. Just steps away, you'll find a versatile 960-square-foot utility building with highwa
Key facts
- Highway frontage
- Breathtaking views
- Pond
Tags
Property features AI
Exterior
- Parking: Gravel parking
- Utilities: Electricity available
- Home design: Single-family house; One level
- Construction: Frame construction; Metal roof
- Exterior features: Porch; Back yard fencing; Cleared, open lot with views; County road frontage
Interior
- Kitchen: Dishwasher; Range; Refrigerator; Gas water heater
- Flooring: Vinyl
- Bathrooms: 2 full bathrooms
- Heating & cooling: Electric heating; Electric cooling; Ceiling fan(s) for cooling
- Interior features: Ceiling fans; Eat-in kitchen; Electric fireplace in the family room
- Laundry & utility: Electric dryer hookup
Neighborhood map
What this means for you Summary
Snapshot
- This is a 4-bed/2.0-bath single-family listed at $1.
Deal economics
- At list price, monthly cash flow is $1k ($12k/yr) — positive.
- The deal already cash-flows at list — no discount required.
- Meets the 1% rule at list price ($1k rent vs $1).
- Cap rate 1218652.0% vs local median 3.7% in Booneville — top-decile yield for the area; either an underpriced asset or a hidden risk that comps aren't pricing in. Stress-test before assuming the spread holds.
Location & tenants
- Location reads 72/100 on livability (#34 in AR) — a middle-class / working-renter tenant base. Strengths: cost of living A+, health & safety A+, housing A; Watch: crime D-, amenities F, commute F.
- Mansfield School District (rural): math 37% / reading 34% proficiency, ranked #110 of 238 in AR (top 46%) — families likely to look elsewhere, expect single-tenant / working-renter base with shorter leases.
- Zoned schools: Mansfield Elementary School (math 37% / reading 32%, grade F, #254 of 454 statewide, top 59%, 302 students, 72% FRL); Mansfield Middle School (math 44% / reading 35%, grade F, #92 of 201 statewide, top 50%, 219 students, 73% FRL); Mansfield High School (math 27% / reading 32%, grade F, #142 of 292 statewide, top 53%, 254 students, 61% FRL) — zoned schools average 68% FRL vs 50% district-wide (18 pts higher); higher-poverty schools than district average — tighter screening recommended.
- Market conditions: 81 active listings in the ZIP.
Forward outlook
- Local home prices are declining (-3.0%/yr); year-one equity from $0 of loan paydown is wiped out by about $0 of value loss. Plan a longer hold.
- Scott County population projected at -42% by 2050 — secular population decline; favor cash flow + early exit over multi-decade hold.
- At projected returns (-3.0% appreciation + 3.0% rent growth), your $0 cash investment doubles in ~1 year — after that, you're playing with house money.
Negotiation context
- Only 1 days on market — expect competitive offers; lowballing is unlikely to land.
Risks & watch-outs
- Climate carrying-cost: major wildfire risk; extreme-heat days projected 7→20/yr by 2055 (HVAC capex compounding) — expect insurance premiums to compound above CPI over the hold.
Questions for the listing agent
- Built in 1965 — when were the roof, HVAC, electrical panel, plumbing, and water heater last replaced?
- Is there a deadline driving the sale (1031 exchange, divorce, estate, relocation)? That informs how much negotiation room exists.
- Schools are D-rated, which usually means shorter tenancies and higher turnover. Who's the typical renter profile here, and what's been the actual vacancy rate?
- Crime grade is D in this area — have there been break-ins, vandalism, or insurance claims at this property in the last 3 years? What carrier currently insures it and at what premium?
- The area grade is low — what's the realistic commute time and amenity access for the typical tenant pool here? Any planned neighborhood developments (good or bad) we should know about?
- What's the average days-on-market for RENTAL listings here right now (not sales)? A rising rental-DOM trend means longer vacancies and softer asking-rent achievability than the comps imply.
- What's the recent tenant-quality profile in this submarket — average credit score on applications, eviction rate, late-payment / NSF rate, and stable-employment percentage? A property-management company in the area should have these aggregated.
- How much new for-sale + rental construction is in the pipeline within 1–3 miles? Heavy new supply typically softens prices + rents 12–24 months out; constrained supply supports both.
Investment metrics
- 1% rule
- 128550.00% ✓
- Cap rate
- 1218652.00%
- Cash-on-cash
- 4352306.10%
- DSCR
- 193654.13
- GRM
- 0.0
CMA / ARV
No comps found within radius.
Projected returns pro-forma
-3.0% appreciation · 3.0% rent growth · sell at horizon
- IRR
- —
- Equity multiple
- 231070.26×
- Total profit
- $64,699
- Equity at exit
- $0
- IRR
- —
- Equity multiple
- 498943.62×
- Total profit
- $139,704
- Equity at exit
- $0
Cash invested: $0 (down + closing). Projections, not guarantees.
Landlord ↔ Tenant lean methodology
- Overall (STATE)
- 92 Strongly Landlord-Friendly
- State Arkansas
- 92 Strongly Landlord-Friendly · R+14
- County
- — inherits STATE
- City
- — inherits STATE
ZIP-level market 72927
- Home prices YoY
- -2.1%
- Active inventory
- 81
Monthly cashflow live
- Estimated rent
- $1,286 medium interval (Pro) →
- Mortgage (P&I)
- −$0
- Tax est. 1.5%
- −$0 /mo · $0/yr
- Insurance
- −$0
- HOA
- −$0
- Lot rent
- −$0
- Vacancy / Maint / Mgmt
- −$270
- Net cashflow
- $1,016
Break-even live
Sensitivity live
| Price | -10% $1,016 | -5% $1,016 | +0% $1,016 | +5% $1,016 | +10% $1,016 |
|---|---|---|---|---|---|
| Rent | -10% $914 | -5% $965 | +0% $1,016 | +5% $1,066 | +10% $1,117 |
| Rate | -1.0pp $1,016 | -0.5pp $1,016 | base $1,016 | +0.5pp $1,016 | +1.0pp $1,016 |
UW: 25.0% down · 7.5% · 30yr · 1.5% tax · 5.0% vac · 8.0% maint · 8.0% mgmt
Financing live
Cash to close
- Down payment
- $0
- Closing costs
- $0
- Reserves months
- —
- Total cash needed
- —
Loan-product check · same deal, 3 products live
Conventional
25% down · 7.5% · 30yr
- Down + closing
- —
- Monthly P&I
- —
- Monthly cashflow
- —
- DSCR
- —
- Eligible?
- —
Personal DTI + credit; lowest rate.
DSCR
20% down · 8.5% · 30yr
- Down + closing
- —
- Monthly P&I
- —
- Monthly cashflow
- —
- DSCR
- —
- Eligible?
- —
No personal income docs; deal must DSCR.
Hard money
10% down · 12.0% · 12mo
- Down + closing
- —
- Monthly P&I
- —
- Monthly cashflow
- —
- DSCR
- —
- Eligible?
- —
Short-term bridge; refi at stabilization.
Listing history 2 events
-
2026-06-09remarks 693-char remark
-
2026-06-09$1 Active 1 DOM
ⓘ Source: listings_history table (triggers on properties + properties_extension) + one-shot
backfill from property_details.listing_events for pre-trigger history.
Climate risk First Street
- Flood 1/10 Low 0% chance over 30 yrs
- Wildfire 7/10 Severe
- Heat 6/10 Major 7 d/yr ≥113°F today · 20 d/yr by 30 yrs out
- Wind 2/10 Low 2% chance of damaging wind over 30 yrs
- Air quality 2/10 Low 0 unhealthy d/yr today · 1 by 30 yrs out
Nearby sold comps map
Loading sold comps map…
Walkable amenities ~0.75 mi
Loading nearby amenities…
Taxation est. · year 1
- Rental income
- $15,426
- − Mortgage interest
- −$0
- − Property taxes
- −$0
- − Insurance
- −$0
- − Repairs & maintenance
- −$1,234
- − Management
- −$1,234
- − Depreciation
- −$0
- Taxable income
- $12,958
- Est. tax owed @ 24.0%
- −$3,110
- After-tax cash flow
- $9,077/yr
For passive investors: Depreciation is non-cash, so a rental often shows a tax loss while cash-flowing — sheltering income. Rental losses are passive: they offset passive income freely, and up to $25,000/yr can offset ordinary (W-2) income if you actively participate and your MAGI is under $100k (phasing out to $0 by $150k); unused losses carry forward. On sale, claimed depreciation is recaptured at up to 25%, and gains may owe capital-gains tax (a 1031 exchange can defer both). Figures are a year-1 estimate at your 24.0% rate — not tax advice; consult a CPA.
Schools (NCES district)
- District
- Mansfield School District
- NCES district ID
- 0509330
- Math proficiency
- 37% ▼ -8.00%
- Reading proficiency
- 34% ▼ -8.00%
- Median HH income
- $46,056
- Composite
- 30.41/100
- National rank
- #6245
- State rank
- #110 of 238 in AR
Livability — Booneville
- Score
- 72/100
- State rank
- #34
- US rank
- #6310
Category grades
Schools grade is shown separately in the Schools card above.
Census & demographics
- Population (ZIP)
- 8,314
Population outlook (Scott County) Hauer SSP2
- Today (2025)
- 8,981 people
- By 2030
- 8,188 · -8.8%
- By 2040
- 6,675 · -25.7%
- By 2050
- 5,228 · -41.8%
- By 2075
- 2,745 · -69.4%
- By 2100
- 1,302 · -85.5%
Race, ethnicity, and origin ACS 2023
- Neighborhood character
- Predominantly White (87%)
- Race & ethnicity
- White 87% Two or more races 9% Hispanic / Latino 5% Black 3%
- Common ancestry
- Italian 2% Romanian 1% Iranian 1%
- Foreign-born
- 2% · Canada
- Languages at home
- 96% English-only · Spanish 2% German/W. Germanic 1%
Political lean MEDSL · Scott
- 2024 margin
- Solid R (+73.5) · D 12.6% · R 86.1% · Other 1.4%
- 2008→2024 swing
- -30.0pp toward R · 2008: -43.5pp · 2024: -73.5pp
- All cycles
- 2024: R+73.5 2020: R+69.8 2016: R+62.0 2012: R+47.7 2008: R+43.5
Not yet ingested
- Civics
- —
Market trends
- HPI YoY
- ▼ -4.71%
- Current HPI
- 221.23
- Rent YoY
- —
- Metro
- —
- State GDP YoY
- ▲ 3.80%
- F500 in state
- 10
Industry mix (Fortune 500 HQ in AR)
| Industry | F500 HQs | Revenue |
|---|---|---|
| Retail | 1 | $681B |
|
||
| Food / Agriculture | 1 | $53B |
|
||
| Retail / Energy | 1 | $22B |
|
||
| Transportation / Logistics | 1 | $12B |
|
||
| Energy | 1 | $4B |
|
||
Cash-flow waterfall
monthlySold comps — $/sqft
last 12 mo · ≤1 miLoading sold comps…