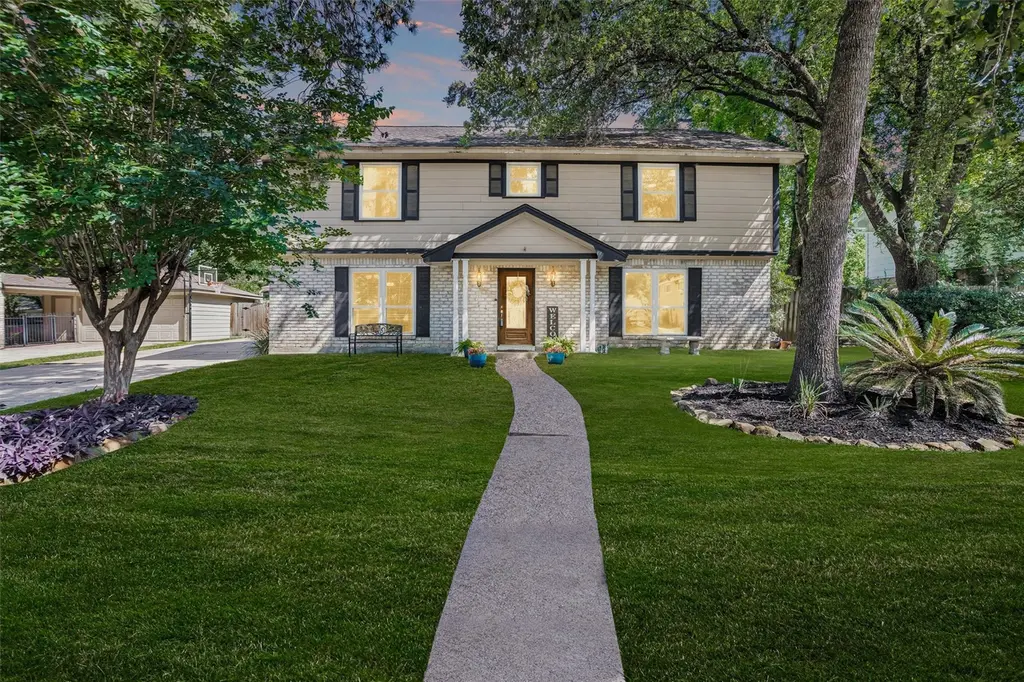
3419 Candlebrook Dr · Houston, TX
Flood risk 1/10 · Minimal
- FEMA flood zone
- X (unshaded)
- Chance of flooding over 30 yrs
- 0.0%
- Est. flood insurance / yr
- $507 – $1,088
Fire risk 1/10 · Minimal
- Est. fire insurance / yr
- $1,222 – $2,270
Heat risk 8/10 · Major
- Hot days now (above 111°F)
- 6 days/yr
- Hot days in 30 yrs
- 20 days/yr
Wind risk 8/10 · Major
- Chance of severe wind over 30 yrs
- 99.0%
Air-quality risk 3/10 · Minor
- Unhealthy air days now
- 3 days/yr
- Unhealthy air days in 30 yrs
- 3 days/yr
Risk factors via First Street. Map © Google.
Why this score? — see what drove the C- grade
The composite is a weighted blend of 9 inputs, each scored 0–100. Each bar is that input's sub-score; the figure is the points it added to the 100-point composite (weight × sub-score).
- Cash flow +15.1/30.0
- ARV discount +15.0/15.0
- 1% rule +5.0/10.0
- DSCR +4.6/10.0
- Schools +4.1/10.0
- Livability +3.7/5.0
- Condition / age +2.5/5.0
- Rent growth +2.2/5.0
- Appreciation +0.0/10.0
$299,000
🖨 Deal sheet (PDF) 📄 Offer letter ✓ Due diligence
Listing remarks MLS
Get ready for summer 2012 with your NEWLY RESURFACED SPARKLING POOL! This classic Spring floor plan features wood flooring, a large inviting kitchen with double ovens, new electric panel, formal dining, and HUGE study! This 4 bed 2.5 bath well maintained home is in a great location with great Klein schools nearby and is steal for under $160,000!!! Call for your priority showing and get the jump on next summers rush on homes with pools before another smart and savvy homebuyer beats you to it. ..
Key facts
- Breakfast nook
- Triple-pane windows
- Formal dining area
Tags
Property features AI
Finance
- Other: Community pool available; Pool is private and in-ground; pool/spa combo (association)
- Financial info: Association fee: $878 annually
- HOA & community: Part of Candlelight Hils Civic Association; Community amenities include clubhouse, park, and pool; Association fee collected annually
Exterior
- Parking: Detached garage; 2 garage spaces
- Security: Owned security system; Smoke detectors
- Utilities: Public water; Public sewer
- Home design: Residential property; Full ownership; Slab foundation; Composition roof; Built in 1974; Living area approximately 2,575
- Construction: Brick and wood siding construction
- Exterior features: Fenced backyard; Porch; Storage; Shed(s)
Interior
- Kitchen: Dishwasher; Electric cooktop; Electric oven; Microwave; Disposal; Refrigerator
- Bedrooms: Primary bedroom on second level (18 x 11); Bedroom on second level (14 x 14); Bedroom on second level (13 x 13); Bedroom on second level (11 x 13); Office on first level (20 x 11)
- Flooring: Carpet; Tile; Vinyl
- Bathrooms: 2 full bathrooms; 1 half bathroom
- Heating & cooling: Central heating (gas); Central air; Electric cooling; Attic fan
- Interior features: Entrance foyer; Granite counters; Pantry; Ceiling fans; Gas log fireplace
- Laundry & utility: Washer hookup; Electric dryer hookup; Washer included
Neighborhood map
What this means for you Summary
Snapshot
- This is a 5-bed/2.5-bath single-family listed at $299k.
Deal economics
- At list price, monthly cash flow is $99 ($1k/yr) — positive.
- The deal already cash-flows at list — no discount required.
- Meets the 1% rule at list price ($3k rent vs $299k).
- Recommended offer: $295k (1.5% below list) — sets the bar for market timing.
- Cap rate 6.7% vs local median 3.2% in Houston — top-decile yield for the area; either an underpriced asset or a hidden risk that comps aren't pricing in. Stress-test before assuming the spread holds.
Location & tenants
- Location reads 74/100 on livability (#184 in TX, #4,771 nationally) — a middle-class / working-renter tenant base. Strengths: amenities A+, cost of living A+, housing A+; Watch: crime F.
- Klein ISD (suburban): math 41% / reading 48% proficiency, ranked #213 of 826 in TX (top 26%) — families likely to look elsewhere, expect single-tenant / working-renter base with shorter leases.
- Zoned schools: Klein Collins H S (math 40% / reading 55%, grade D, #583 of 1,632 statewide, top 36%, 3,422 students, 45% FRL).
- Market conditions: Rents soft (-1.1%/yr); 329 active listings in the ZIP; 5 comparable units currently listed for rent nearby; rentals at typical pace (median 14d on market — plan ~3-4 weeks tenant-placement turnaround); solid renter incomes; 29,883 units permitted in Harris County in 2024 (8,621 in 5+ unit buildings).
- This rent runs 35% of the median local income ($102k/yr) — at the standard rent-burdened threshold; future hikes will face affordability resistance.
Forward outlook
- Local home prices are declining (-3.0%/yr); year-one equity from $2k of loan paydown is wiped out by about $9k of value loss. Plan a longer hold.
- Harris County population projected at +47% by 2050 — long-run rental-demand tailwind backs the buy-and-hold thesis.
Negotiation context
- It's been on market 17 days — a 2% lower offer ($295k) is reasonable based on typical stale-listing flexibility.
- 5 sale attempts since 16y ago with the ask held roughly flat each time — persistent listings suggest the price (not the market) is what's stuck; bring a comps-based counter.
- Current owner paid $134k; list at $299k implies a 123% gain — meaningful room to come down on a strong offer.
Risks & watch-outs
- Climate carrying-cost: severe wind risk, 99% chance of damaging wind over 30y; extreme-heat days projected 6→20/yr by 2055 (HVAC capex compounding) — expect insurance premiums to compound above CPI over the hold.
Questions for the listing agent
- Built in 1974 — when were the roof, HVAC, electrical panel, plumbing, and water heater last replaced?
- What does the HOA fee cover, when was the last increase, and are there any pending special assessments or reserve-fund shortfalls?
- Is there a deadline driving the sale (1031 exchange, divorce, estate, relocation)? That informs how much negotiation room exists.
- Schools are D-rated, which usually means shorter tenancies and higher turnover. Who's the typical renter profile here, and what's been the actual vacancy rate?
- Crime grade is F in this area — have there been break-ins, vandalism, or insurance claims at this property in the last 3 years? What carrier currently insures it and at what premium?
- What's the average days-on-market for RENTAL listings here right now (not sales)? A rising rental-DOM trend means longer vacancies and softer asking-rent achievability than the comps imply.
- What's the recent tenant-quality profile in this submarket — average credit score on applications, eviction rate, late-payment / NSF rate, and stable-employment percentage? A property-management company in the area should have these aggregated.
- How much new for-sale + rental construction is in the pipeline within 1–3 miles? Heavy new supply typically softens prices + rents 12–24 months out; constrained supply supports both.
Investment metrics
- 1% rule
- 1.00% ✓
- Cap rate
- 6.69%
- Cash-on-cash
- 1.42%
- DSCR
- 1.06
- GRM
- 8.3
CMA / ARV
- ARV (median comp)
- $386,531
- List price
- $299,000
- Delta
- -22.65%
- Verdict
- UNDERPRICED
- Comps
- 20 within 1.0 mi
Show comp detail 12 sales within ~0.75 mi
| Address | Dist | Beds/Ba | Sqft | Sold | Price | $/sf | Match |
|---|---|---|---|---|---|---|---|
| 3315 Candleridge Dr | 0.17mi | 4/2.5 (-1) | 2,719 (+6%) | 2mo | $334,999 | $123 | 76 |
| 18823 Cypress Mountain Dr | 0.28mi | 4/2.5 (-1) | 2,705 (+5%) | 3mo | $425,000 | $157 | 71 |
| 3511 Marywood Dr | 0.49mi | 4/2.5 (-1) | 2,566 (-0%) | 2mo | $275,000 | $107 | 69 |
| 3607 El James Dr | 0.60mi | 4/2.5 (-1) | 2,537 (-2%) | 3mo | $263,300 | $104 | 62 |
| 3018 Lexanne Ct | 0.44mi | 4/2.5 (-1) | 2,366 (-8%) | 1mo | $300,000 | $127 | 60 |
| 2739 Wisteria Walk | 0.61mi | 4/2.5 (-1) | 2,498 (-3%) | 3mo | $360,000 | $144 | 59 |
| 19011 Oakway Dr | 0.21mi | 4/2.5 (-1) | 2,951 (+15%) | 2mo | $415,000 | $141 | 59 |
| 18330 Ella Blvd | 0.61mi | 4/2.5 (-1) | 2,672 (+4%) | 2mo | $250,000 | $94 | 58 |
| 3630 Chapel Square Dr | 0.57mi | 4/2.5 (-1) | 2,447 (-5%) | 2mo | $340,000 | $139 | 58 |
| 3602 Cypresswood Dr | 0.60mi | 4/2.5 (-1) | 2,363 (-8%) | 1mo | $210,000 | $89 | 52 |
| 3603 Beech Hill Dr | 0.70mi | 4/2.5 (-1) | 2,861 (+11%) | 0mo | $375,000 | $131 | 44 |
| 3627 Rolling Forest Dr | 0.60mi | 4/2.5 (-1) | 2,198 (-15%) | 2mo | $339,900 | $155 | 41 |
Match score weights: distance 35% · size 25% · config 20% · recency 20%. Top-matched comps best support the ARV.
Projected returns pro-forma
-3.0% appreciation · 0.0% rent growth · sell at horizon
- IRR
- -17.7%
- Equity multiple
- 0.39×
- Total profit
- $-50,752
- Equity at exit
- $44,582
- IRR
- -17.8%
- Equity multiple
- 0.17×
- Total profit
- $-69,291
- Equity at exit
- $25,852
Cash invested: $83,720 (down + closing). Projections, not guarantees.
Landlord ↔ Tenant lean methodology
- Overall (STATE)
- 87 Strongly Landlord-Friendly
- State Texas
- 87 Strongly Landlord-Friendly · R+5
- County
- — inherits STATE
- City
- — inherits STATE
ZIP-level market 77388
- Home prices YoY
- -34.8%
- Rents YoY
- -1.1%
- Active inventory
- 329
- Price-to-rent
- 8.3×
Monthly cashflow live
- Estimated rent
- $2,992 high interval (Pro) →
- Mortgage (P&I)
- −$1,568
- Tax from tax record
- −$499 /mo · $5,992/yr
- Insurance
- −$125
- HOA
- −$73
- Vacancy / Maint / Mgmt
- −$628
- Net cashflow
- $99
Break-even live
Sensitivity live
| Price | -10% $268 | -5% $184 | +0% $99 | +5% $14 | +10% $-70 |
|---|---|---|---|---|---|
| Rent | -10% $-137 | -5% $-19 | +0% $99 | +5% $217 | +10% $335 |
| Rate | -1.0pp $250 | -0.5pp $175 | base $99 | +0.5pp $21 | +1.0pp $-57 |
UW: 25.0% down · 7.5% · 30yr · 1.5% tax · 5.0% vac · 8.0% maint · 8.0% mgmt
Financing live
Cash to close
- Down payment
- $74,750
- Closing costs
- $8,970
- Reserves months
- —
- Total cash needed
- —
Loan-product check · same deal, 3 products live
Conventional
25% down · 7.5% · 30yr
- Down + closing
- —
- Monthly P&I
- —
- Monthly cashflow
- —
- DSCR
- —
- Eligible?
- —
Personal DTI + credit; lowest rate.
DSCR
20% down · 8.5% · 30yr
- Down + closing
- —
- Monthly P&I
- —
- Monthly cashflow
- —
- DSCR
- —
- Eligible?
- —
No personal income docs; deal must DSCR.
Hard money
10% down · 12.0% · 12mo
- Down + closing
- —
- Monthly P&I
- —
- Monthly cashflow
- —
- DSCR
- —
- Eligible?
- —
Short-term bridge; refi at stabilization.
Rent comps 5 comps
| Address | Beds | Baths | Sqft | Rent | $/sqft | DOM | Units | Dist |
|---|---|---|---|---|---|---|---|---|
| 18631 Minden Oaks Dr Spring, TX | 4.0 | 3.5 | 3487 | $2,936 | $0.84 | 14d | 1 | 0.22mi |
| 3714 Cedar Glen Ln Spring, TX | 4.0 | 4.5 | 3205 | $4,500 | $1.40 | 45d | 1 | 0.90mi |
| 3906 Postwood Dr Spring, TX | 4.0 | 2.5 | 2211 | $2,045 | $0.92 | 9d | 1 | 1.10mi |
| 18011 Tall Cypress Dr Spring, TX | 4.0 | 2.5 | 2824 | $3,120 | $1.10 | 9d | 1 | 1.29mi |
| 18620 Louetta Creek Dr Spring, TX | 3.0–4.0 | 2.5–3.0 | 1930 | $2,499 | $1.29 | 14d | 3 | 1.34mi |
HOA detail
- Monthly dues
- $73 · $876/yr
- Likely covers
- electricpool
Listing history 15 events
-
2026-06-01days on market $299,000 Pending 17 DOM
-
2026-05-31days on market $299,000 Pending 16 DOM
-
2026-05-18status Pending 997-char remark
-
2026-05-15$299,000 Active 997-char remark
-
2012-05-14soldstatus
-
2012-05-10soldstatus 499-char remark
Show marketing remark (499 chars)
Get ready for summer 2012 with your NEWLY RESURFACED SPARKLING POOL! This classic Spring floor plan features wood flooring, a large inviting kitchen with double ovens, new electric panel, formal dining, and HUGE study! This 4 bed 2.5 bath well maintained home is in a great location with great Klein schools nearby and is steal for under $160,000!!! Call for your priority showing and get the jump on next summers rush on homes with pools before another smart and savvy homebuyer beats you to it. ..
-
2012-03-15historical 499-char remark
Show marketing remark (499 chars)
Get ready for summer 2012 with your NEWLY RESURFACED SPARKLING POOL! This classic Spring floor plan features wood flooring, a large inviting kitchen with double ovens, new electric panel, formal dining, and HUGE study! This 4 bed 2.5 bath well maintained home is in a great location with great Klein schools nearby and is steal for under $160,000!!! Call for your priority showing and get the jump on next summers rush on homes with pools before another smart and savvy homebuyer beats you to it. ..
-
2011-11-27$159,900 499-char remark
Show marketing remark (499 chars)
Get ready for summer 2012 with your NEWLY RESURFACED SPARKLING POOL! This classic Spring floor plan features wood flooring, a large inviting kitchen with double ovens, new electric panel, formal dining, and HUGE study! This 4 bed 2.5 bath well maintained home is in a great location with great Klein schools nearby and is steal for under $160,000!!! Call for your priority showing and get the jump on next summers rush on homes with pools before another smart and savvy homebuyer beats you to it. ..
-
2011-10-01historical
-
2011-03-09$153,500
-
2011-02-11historical
-
2010-08-12$169,900
-
2002-06-03soldstatus
-
1999-10-01soldstatus $134,000
-
1999-08-27soldstatus
ⓘ Source: listings_history table (triggers on properties + properties_extension) + one-shot
backfill from property_details.listing_events for pre-trigger history.
Tax reassessment forecast TX · Resets to sale price
- Current annual tax
- $5,992 · $499/mo
- Projected year-2 tax
- $5,992 · $499/mo
- Expected delta
- $0/yr ($0/mo · -0.0%)
ⓘ Screening estimate from a state-policy table — verify with the county assessor before closing.
Climate risk First Street
- Flood 1/10 Low FEMA zone X (unshaded) · 0% chance over 30 yrs
- Wildfire 1/10 Low
- Heat 8/10 Severe 6 d/yr ≥111°F today · 20 d/yr by 30 yrs out
- Wind 8/10 Severe 99% chance of damaging wind over 30 yrs
- Air quality 3/10 Moderate 3 unhealthy d/yr today · 3 by 30 yrs out
Nearby sold comps map
Loading sold comps map…
Walkable amenities ~0.75 mi
Loading nearby amenities…
Taxation est. · year 1
- Rental income
- $35,907
- − Mortgage interest
- −$16,749
- − Property taxes
- −$5,992
- − Insurance
- −$1,495
- − Repairs & maintenance
- −$2,873
- − Management
- −$2,873
- − HOA
- −$876
- − Depreciation
- −$8,698
- Taxable loss
- −$3,649
- Est. tax savings @ 24.0%
- +$876
- After-tax cash flow
- $2,063/yr
For passive investors: Depreciation is non-cash, so a rental often shows a tax loss while cash-flowing — sheltering income. Rental losses are passive: they offset passive income freely, and up to $25,000/yr can offset ordinary (W-2) income if you actively participate and your MAGI is under $100k (phasing out to $0 by $150k); unused losses carry forward. On sale, claimed depreciation is recaptured at up to 25%, and gains may owe capital-gains tax (a 1031 exchange can defer both). Figures are a year-1 estimate at your 24.0% rate — not tax advice; consult a CPA.
Schools (NCES district)
- District
- Klein ISD
- NCES district ID
- 4825740
- Math proficiency
- 41% ▼ -12.00%
- Reading proficiency
- 48% ▼ -3.00%
- Median HH income
- $78,288
- Composite
- 40.91/100
- National rank
- #3615
- State rank
- #213 of 826 in TX
Livability — Houston
- Score
- 74/100
- State rank
- #184
- US rank
- #4771
Category grades
Schools grade is shown separately in the Schools card above.
Census & demographics
- County
- Harris County · 4,702,590 people
- City population
- 3,226,434
- Metro
- Houston-The Woodlands-Sugar Land, TX
- Population (ZIP)
- 53,425
- Household income
- $102,323
- Rent vs Own
- Severe rent burden
- 1419.0
Population outlook (Harris County) Hauer SSP2
- Today (2025)
- 5,571,493 people
- By 2030
- 6,089,821 · +9.3%
- By 2040
- 7,142,806 · +28.2%
- By 2050
- 8,185,864 · +46.9%
- By 2075
- 10,574,329 · +89.8%
- By 2100
- 12,109,958 · +117.4%
Race, ethnicity, and origin ACS 2023
- Neighborhood character
- Diverse neighborhood (Simpson 0.70)
- Race & ethnicity
- White 45% Hispanic / Latino 25% Black 18% Two or more races 12% Asian 8%
- Hispanic origin (detail)
- Mexican 15%
- Common ancestry
- Slovak 2% Lithuanian 2% Romanian 1%
- Foreign-born
- 15% · Canada, Vietnam, China
- Languages at home
- 74% English-only · Spanish 18% Other Indo-European 2% Other Asian/Pacific 1%
Political lean MEDSL · Harris
- 2024 margin
- Lean D (+5.5) · D 52.0% · R 46.4% · Other 1.6%
- 2008→2024 swing
- +3.9pp toward D · 2008: 1.6pp · 2024: 5.5pp
- All cycles
- 2024: D+5.5 2020: D+13.3 2016: D+12.4 2012: D+0.1 2008: D+1.6
Not yet ingested
- Civics
- —
Market trends
- HPI YoY
- ▼ -121.68%
- Current HPI
- 228.128
- Rent YoY
- ▼ -1.08%
- Metro
- Houston-The Woodlands-Sugar Land, TX
- State GDP YoY
- ▲ 3.95%
- F500 in state
- 110
Industry mix (Fortune 500 HQ in TX)
| Industry | F500 HQs | Revenue |
|---|---|---|
| Energy | 16 | $1,198B |
|
||
| Technology | 5 | $198B |
|
||
| Engineering / Construction | 4 | $72B |
|
||
| Energy Services | 3 | $60B |
|
||
| Utilities | 3 | $41B |
|
||
| Healthcare | 2 | $330B |
|
||
Price history
+123.1% since first listed16 events — show timeline
- 2026-06-02 Pending — HARMLS
- 2026-05-26 Pending — HARMLS
- 2026-05-21 Relisted — HARMLS
- 2026-05-18 Pending — HARMLS
- 2026-05-15 Listed $299,000 HARMLS
- 2012-05-14 Sold (Public Records) — Public Records
- 2012-05-10 Sold (MLS) — HARMLS
- 2012-03-15 Listing Removed — HARMLS
- 2011-11-27 Listed $159,900 HARMLS
- 2011-10-01 Listing Removed — HARMLS
- 2011-03-09 Listed $153,500 HARMLS
- 2011-02-11 Listing Removed — HARMLS
- 2010-08-12 Listed $169,900 HARMLS
- 2002-06-03 Sold (Public Records) — Public Records
- 1999-10-01 Sold (Public Records) $134,000 Public Records
- 1999-08-27 Sold (Public Records) — Public Records
Property tax history
+3.7%/yrLatest (2025): $5,992 · +8.0% YoY. Source: county tax records.
Cash-flow waterfall
monthlySold comps — $/sqft
last 12 mo · ≤1 miLoading sold comps…