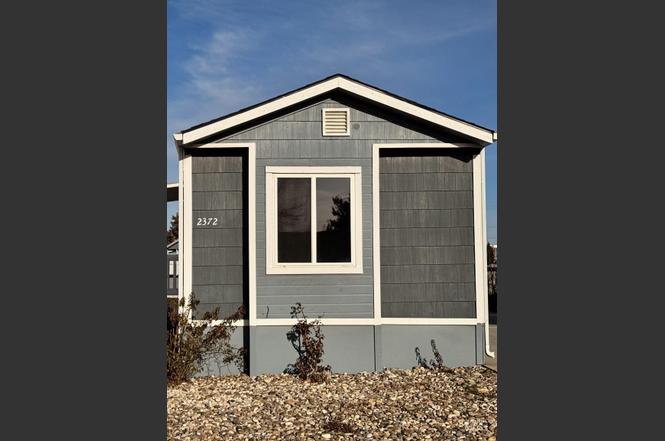
2372 Blue Sage Lane #87 Ln · Boise City, ID
Flood risk No data
- FEMA flood zone
- —
- Chance of flooding over 30 yrs
- —
- Est. flood insurance / yr
- —
Fire risk No data
- Est. fire insurance / yr
- —
Heat risk No data
- Hot days now (above threshold)
- —
- Hot days in 30 yrs
- —
Wind risk No data
- Chance of severe wind over 30 yrs
- —
Air-quality risk No data
- Unhealthy air days now
- —
- Unhealthy air days in 30 yrs
- —
Risk factors via First Street. Map © Google.
Why this score? — see what drove the B grade
The composite is a weighted blend of 9 inputs, each scored 0–100. Each bar is that input's sub-score; the figure is the points it added to the 100-point composite (weight × sub-score).
- Cash flow +30.0/30.0
- 1% rule +10.0/10.0
- DSCR +10.0/10.0
- ARV discount +7.5/15.0
- Schools +4.2/10.0
- Rent growth +3.7/5.0
- Livability +2.5/5.0
- Condition / age +2.5/5.0
- Appreciation +0.0/10.0
$120,000
🖨 Deal sheet (PDF) 📄 Offer letter ✓ Due diligence
Listing remarks
Well maintained single-wide manufactured home located on Lake Patricia in Blue Valley Lakeside Community! This very affordable home is conveniently located in Southeast Boise and provides easy access to I-84, Boise Airport, downtown Boise, shopping and is just 5 miles to Lucky Peak Reservoir. This home has two covered porches and an open living/kitchen area making it great for hosting friends and family while enjoining the views of Lake Patricia. This home also has built-in cabinets and plenty of storage and an alarm system. Lot rent is $750 plus $65 for water and sewer. Contact [email protected]. Must be pre-approved by park prior to seller accepting an offer.
Key facts
- Plenty of storage
- Built-in cabinets
- Alarm system
Tags
Property features AI
Finance
- Other:
- Financial info:
- HOA & community: Monthly association fee (approximately $660/month)
Exterior
- Parking:
- Security:
- Utilities: Community water service
- Home design: Mobile/manufactured home on a rented lot; Built in 1985
- Construction: Composition roof
- Exterior features: Vinyl fencing; Covered patio/deck; Composition roof; Located in a mobile home park; Private road frontage
Interior
- Kitchen: Pantry; Breakfast bar; Tile counters; Dishwasher; Disposal; Microwave; Freestanding oven/range; Refrigerator
- Bedrooms: 3 bedrooms, all on the main level
- Flooring: Carpet; Laminate
- Bathrooms: 2 bathrooms
- Heating & cooling: Heat pump heating; Central air conditioning
- Interior features: Primary bedroom with en-suite bath; Split bedroom floorplan; Walk-in closet(s); Breakfast bar; Pantry; Tile counters
- Laundry & utility: Washer; Dryer; Utility room on the main level; Electric water heater
Neighborhood map
What this means for you Summary
Snapshot
- This is a 3-bed/2.0-bath manufactured listed at $120k.
Deal economics
- At list price, monthly cash flow is $458 ($6k/yr) — positive.
- The deal already cash-flows at list — no discount required.
- Meets the 1% rule at list price ($2k rent vs $120k).
- Recommended offer: $106k (12.0% below list) — sets the bar for market timing.
- Cap rate 10.9% vs local median 2.6% in Boise City — top-decile yield for the area; either an underpriced asset or a hidden risk that comps aren't pricing in. Stress-test before assuming the spread holds.
Location & tenants
- Location reads: area grade B — affects rentability + tenant quality, not the cash-flow math above.
- Boise Independent District (urban): math 42% / reading 56% proficiency, ranked #36 of 92 in ID (top 39%) — families likely to look elsewhere, expect single-tenant / working-renter base with shorter leases.
- Zoned schools: Timberline High School (math 53% / reading 74%, grade B-, #14 of 169 statewide, top 8%, 1,398 students, 10% FRL) — zoned schools average 10% FRL vs 33% district-wide (24 pts lower); this property's tenant base skews higher-income than the district average.
- Zoned-school proficiency averages 64% at this address vs 49% district-wide (+14 pts) — the actual schools serving this property are materially stronger than the Boise Independent District average implies; a family-tenant draw the district grade alone would hide.
- Market conditions: Rents rising fast (+4.8%/yr); 328 active listings in the ZIP; high-income renter base; 5,129 units permitted in Ada County in 2024 (414 in 5+ unit buildings).
Forward outlook
- Local home prices are declining (-3.0%/yr); year-one equity from $830 of loan paydown is wiped out by about $4k of value loss. Plan a longer hold.
- Ada County population projected at +45% by 2050 — long-run rental-demand tailwind backs the buy-and-hold thesis.
- At projected returns (-3.0% appreciation + 4.8% rent growth), your $34k cash investment doubles in ~7 years — after that, you're playing with house money.
Negotiation context
- It's been on market 141 days — a 12% lower offer ($106k) is reasonable based on typical stale-listing flexibility.
- 4 sale attempts since 8y ago; this cycle's ask has dropped $20k (14%) from the opening price — seller is motivated, your offer sets the floor, not the list.
Risks & watch-outs
- Watch-outs: HOA is 27% of rent.
Questions for the listing agent
- It's been on market 141 days. Have you received any prior offers? Is the seller open to a 12% concession, seller financing, or rate buy-down credit?
- What does the HOA fee cover, when was the last increase, and are there any pending special assessments or reserve-fund shortfalls?
- Why hasn't it sold? Are there any deal-killer items the seller is aware of (foundation, flood, title, zoning, code violations)?
- Is there a deadline driving the sale (1031 exchange, divorce, estate, relocation)? That informs how much negotiation room exists.
- What's the average days-on-market for RENTAL listings here right now (not sales)? A rising rental-DOM trend means longer vacancies and softer asking-rent achievability than the comps imply.
- What's the recent tenant-quality profile in this submarket — average credit score on applications, eviction rate, late-payment / NSF rate, and stable-employment percentage? A property-management company in the area should have these aggregated.
- How much new for-sale + rental construction is in the pipeline within 1–3 miles? Heavy new supply typically softens prices + rents 12–24 months out; constrained supply supports both.
Investment metrics
- 1% rule
- 2.05% ✓
- Cap rate
- 10.88%
- Cash-on-cash
- 16.37%
- DSCR
- 1.73
- GRM
- 4.1
CMA / ARV
- ARV (on-the-fly)
- $60,984
- Comps found
- 1
Show comp detail 1 sale within ~0.75 mi
| Address | Dist | Beds/Ba | Sqft | Sold | Price | $/sf | Match |
|---|---|---|---|---|---|---|---|
| 2155 Blue Sage Ln | 0.13mi | 3/1.0 | 1,057 (+14%) | 11mo | $70,000 | $66 | 56 |
Match score weights: distance 35% · size 25% · config 20% · recency 20%. Top-matched comps best support the ARV.
Projected returns pro-forma
-3.0% appreciation · 4.78% rent growth · sell at horizon
- IRR
- 10.7%
- Equity multiple
- 1.44×
- Total profit
- $14,685
- Equity at exit
- $17,892
- IRR
- 21.9%
- Equity multiple
- 3.12×
- Total profit
- $71,300
- Equity at exit
- $10,375
Cash invested: $33,600 (down + closing). Projections, not guarantees.
Landlord ↔ Tenant lean methodology
- Overall (STATE)
- 91 Strongly Landlord-Friendly
- State Idaho
- 91 Strongly Landlord-Friendly · R+18
- County
- — inherits STATE
- City
- — inherits STATE
ZIP-level market 83716
- Home prices YoY
- -22.8%
- Rents YoY
- 4.8%
- Active inventory
- 328
- Price-to-rent
- 4.1×
Monthly cashflow live
- Estimated rent
- $2,465 medium interval (Pro) →
- Mortgage (P&I)
- −$629
- Tax est. 1.5%
- −$150 /mo · $1,800/yr
- Insurance
- −$50
- HOA
- −$660
- Vacancy / Maint / Mgmt
- −$518
- Net cashflow
- $458
Break-even live
Sensitivity live
| Price | -10% $541 | -5% $500 | +0% $458 | +5% $417 | +10% $375 |
|---|---|---|---|---|---|
| Rent | -10% $264 | -5% $361 | +0% $458 | +5% $556 | +10% $653 |
| Rate | -1.0pp $519 | -0.5pp $489 | base $458 | +0.5pp $427 | +1.0pp $396 |
UW: 25.0% down · 7.5% · 30yr · 1.5% tax · 5.0% vac · 8.0% maint · 8.0% mgmt
Financing live
Cash to close
- Down payment
- $30,000
- Closing costs
- $3,600
- Reserves months
- —
- Total cash needed
- —
Loan-product check · same deal, 3 products live
Conventional
25% down · 7.5% · 30yr
- Down + closing
- —
- Monthly P&I
- —
- Monthly cashflow
- —
- DSCR
- —
- Eligible?
- —
Personal DTI + credit; lowest rate.
DSCR
20% down · 8.5% · 30yr
- Down + closing
- —
- Monthly P&I
- —
- Monthly cashflow
- —
- DSCR
- —
- Eligible?
- —
No personal income docs; deal must DSCR.
Hard money
10% down · 12.0% · 12mo
- Down + closing
- —
- Monthly P&I
- —
- Monthly cashflow
- —
- DSCR
- —
- Eligible?
- —
Short-term bridge; refi at stabilization.
HOA detail
- Monthly dues
- $660 · $7,920/yr
- Likely covers
- watersewer
Listing history 26 events
-
2026-06-18days on market $120,000 Active 141 DOM
-
2026-06-17days on market $120,000 Active 140 DOM
-
2026-06-16days on market $120,000 Active 139 DOM
-
2026-06-15days on market $120,000 Active 138 DOM
-
2026-06-13days on market $120,000 Active 136 DOM
-
2026-06-10days on market $120,000 Active 133 DOM
-
2026-06-09days on market $120,000 Active 132 DOM
-
2026-06-08days on market $120,000 Active 131 DOM
-
2026-06-07days on market $120,000 Active 130 DOM
-
2026-06-05days on market $120,000 Active 127 DOM
-
2026-06-03days on market $120,000 Active 126 DOM
-
2026-06-03days on market $120,000 Active 125 DOM
-
2026-06-01days on market $120,000 Active 124 DOM
-
2026-05-31days on market $120,000 Active 123 DOM
-
2026-03-02price $120,000
-
2026-01-28$140,000 Active
-
2020-09-29price $76,825
-
2020-09-06status Pending
-
2020-08-11$80,000 Active
-
2018-03-21soldstatus Sold
-
2018-02-28historical
-
2018-02-16status Pending
-
2018-02-07price $42,000
-
2018-02-01status Active
-
2018-01-30status Pending
-
2018-01-09$43,000 Active
ⓘ Source: listings_history table (triggers on properties + properties_extension) + one-shot
backfill from property_details.listing_events for pre-trigger history.
Nearby sold comps map
Loading sold comps map…
Walkable amenities ~0.75 mi
Loading nearby amenities…
Taxation est. · year 1
- Rental income
- $29,585
- − Mortgage interest
- −$6,722
- − Property taxes
- −$1,800
- − Insurance
- −$600
- − Repairs & maintenance
- −$2,367
- − Management
- −$2,367
- − HOA
- −$7,920
- − Depreciation
- −$3,491
- Taxable income
- $4,318
- Est. tax owed @ 24.0%
- −$1,036
- After-tax cash flow
- $4,464/yr
For passive investors: Depreciation is non-cash, so a rental often shows a tax loss while cash-flowing — sheltering income. Rental losses are passive: they offset passive income freely, and up to $25,000/yr can offset ordinary (W-2) income if you actively participate and your MAGI is under $100k (phasing out to $0 by $150k); unused losses carry forward. On sale, claimed depreciation is recaptured at up to 25%, and gains may owe capital-gains tax (a 1031 exchange can defer both). Figures are a year-1 estimate at your 24.0% rate — not tax advice; consult a CPA.
Schools (NCES district)
- District
- Boise Independent District
- NCES district ID
- 1600360
- Math proficiency
- 42% ▼ -5.00%
- Reading proficiency
- 56% ▼ -1.00%
- Median HH income
- $49,135
- Composite
- 41.82/100
- National rank
- #3388
- State rank
- #36 of 92 in ID
Livability — Boise City
No livability data for this city. (Only ~50 U.S. cities are tracked.)
Census & demographics
- Census place
- Boise City, ID
- County
- Ada County · 522,161 people
- City population
- 152,689
- Metro
- Boise City, ID
- Population (ZIP)
- 21,402
- Household income
- $128,822
- Rent vs Own
- Severe rent burden
- 408.0
Population outlook (Ada County) Hauer SSP2
- Today (2025)
- 535,818 people
- By 2030
- 585,751 · +9.3%
- By 2040
- 682,435 · +27.4%
- By 2050
- 775,818 · +44.8%
- By 2075
- 994,458 · +85.6%
- By 2100
- 1,148,884 · +114.4%
Race, ethnicity, and origin ACS 2023
- Neighborhood character
- Predominantly White (77%)
- Race & ethnicity
- White 77% Asian 9% Two or more races 7% Hispanic / Latino 6%
- Hispanic origin (detail)
- Mexican 3%
- Common ancestry
- Italian 6% Portuguese 2% Slovak 2%
- Foreign-born
- 11% · Canada, China, South Korea
- Languages at home
- 87% English-only · Spanish 4% Chinese 2% Other Asian/Pacific 2%
Political lean MEDSL · Ada
- 2024 margin
- R (+10.3) · D 43.4% · R 53.8% · Other 2.8%
- 2008→2024 swing
- -4.2pp toward R · 2008: -6.2pp · 2024: -10.3pp
- All cycles
- 2024: R+10.3 2020: R+3.9 2016: R+9.2 2012: R+11.3 2008: R+6.2
Not yet ingested
- Civics
- —
Market trends
- HPI YoY
- ▼ -97.80%
- Current HPI
- 332.0696
- Rent YoY
- ▲ 4.78%
- Metro
- Boise City, ID
- State GDP YoY
- ▲ 4.51%
- F500 in state
- 6
Industry mix (Fortune 500 HQ in ID)
| Industry | F500 HQs | Revenue |
|---|---|---|
| Retail | 1 | $79B |
|
||
| Technology | 1 | $25B |
|
||
| Food / Agriculture | 1 | $6B |
|
||
Price history
+179.1% since first listed12 events — show timeline
- 2026-03-02 Price Changed $120,000 IMLS
- 2026-01-28 Listed $140,000 IMLS
- 2020-09-29 Price Changed $76,825 IMLS
- 2020-09-06 Pending — IMLS
- 2020-08-11 Listed $80,000 IMLS
- 2018-03-21 Sold (MLS) — IMLS
- 2018-02-28 Listing Removed — IMLS
- 2018-02-16 Pending — IMLS
- 2018-02-07 Price Changed $42,000 IMLS
- 2018-02-01 Relisted — IMLS
- 2018-01-30 Pending — IMLS
- 2018-01-09 Listed $43,000 IMLS
Cash-flow waterfall
monthlySold comps — $/sqft
last 12 mo · ≤1 miLoading sold comps…