8004 N Hiawatha Trl · Naubinway, MI
Flood risk 1/10 · Minimal
- FEMA flood zone
- X (unshaded)
- Chance of flooding over 30 yrs
- 0.0%
- Est. flood insurance / yr
- $473 – $860
Fire risk 3/10 · Minor
- Est. fire insurance / yr
- $784 – $1,456
Heat risk 1/10 · Minimal
- Hot days now (above 88°F)
- 7 days/yr
- Hot days in 30 yrs
- 14 days/yr
Wind risk 1/10 · Minimal
- Chance of severe wind over 30 yrs
- —
Air-quality risk 2/10 · Minimal
- Unhealthy air days now
- 1 days/yr
- Unhealthy air days in 30 yrs
- 1 days/yr
Risk factors via First Street. Map © Google.
Why this score? — see what drove the B- grade
The composite is a weighted blend of 9 inputs, each scored 0–100. Each bar is that input's sub-score; the figure is the points it added to the 100-point composite (weight × sub-score).
- Cash flow +27.8/30.0
- DSCR +9.8/10.0
- 1% rule +7.6/10.0
- ARV discount +7.5/15.0
- Appreciation +4.7/10.0
- Schools +3.0/10.0
- Rent growth +2.5/5.0
- Livability +2.5/5.0
- Condition / age +2.5/5.0
$85,000
🖨 Deal sheet (PDF) 📄 Offer letter ✓ Due diligence
Listing remarks MLS
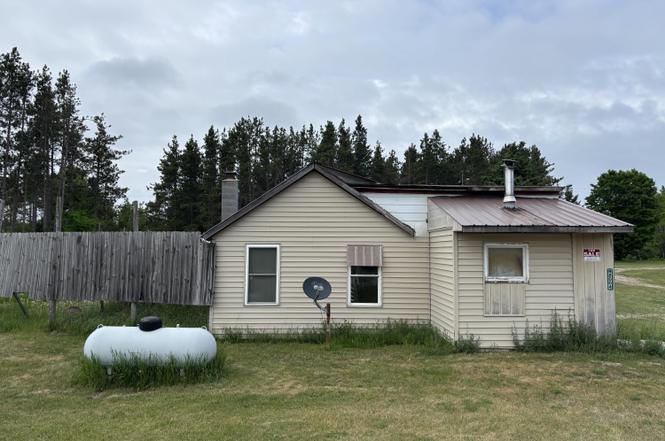
Located in the Eastern Upper Peninsula this 2 Bedroom 1 bath camp/home has electric installed, a full kitchen, wood stove, tongue and groove woodwork and a pole building. Located on Hiawatha Tral and M-123 with Trout Lake to the north, Lake Michigan to the South, Black River, Garnet Lake and ORV/snowmobile trails to the East. This was a primary residence for the previous owner. It can also make a great home base to venture out to all the recreational activities in the area including fishing, hunting, trail riding and/or snowmobiling. This is an estate sale being sold AS-IS.
Key facts
- Full kitchen
- Wood stove
- Pole building
Tags
Property features AI
Exterior
- Parking: Detached garage (40 x 32) with 3 parking spaces
- Utilities: Drilled well water; Septic sewer; Electricity available; Propane available; Cable available; No water heater listed
- Home design: One-story residential home; Built in 1950
- Construction: Slab foundation
- Exterior features: Vinyl siding; Fenced yard; Road frontage (frontage approx. 100'); Paved country road access
Interior
- Kitchen: Refrigerator
- Bedrooms: First-floor bedroom — 10 x 10; First-floor bedroom — 15 x 7; First-floor bedroom — approx. 12 wide
- Bathrooms: One full bathroom (located on first floor)
- Heating & cooling: Forced air heating; Wood supplemental heat; No central cooling listed
- Interior features: Wood stove fireplace (1 total)
- Laundry & utility: No basement
Neighborhood map
What this means for you Summary
Snapshot
- This is a 3-bed/1.0-bath single-family listed at $85k.
Deal economics
- At list price, monthly cash flow is $260 ($3k/yr) — positive.
- The deal already cash-flows at list — no discount required.
- Meets the 1% rule at list price ($1k rent vs $85k).
Location & tenants
- Location reads: area grade B — affects rentability + tenant quality, not the cash-flow math above.
- Engadine Consolidated Schools (rural): math 25% / reading 40% proficiency, ranked #504 of 760 in MI (top 66%) — families likely to look elsewhere, expect single-tenant / working-renter base with shorter leases.
- Market conditions: 22 active listings in the ZIP; 41 units permitted in Mackinac County in 2024 (0 in 5+ unit buildings).
Forward outlook
- In year one you build about $41 of equity ($588 loan paydown + $-547 appreciation (-0.6% local appreciation)).
- Mackinac County population projected at -18% by 2050 — secular population decline; favor cash flow + early exit over multi-decade hold.
- At projected returns (-0.6% appreciation + 3.0% rent growth), your $24k cash investment doubles in ~6 years — after that, you're playing with house money.
Negotiation context
- Only 5 days on market — expect competitive offers; lowballing is unlikely to land.
- 2 sale attempts with the ask held roughly flat each time — persistent listings suggest the price (not the market) is what's stuck; bring a comps-based counter.
Risks & watch-outs
- Watch-outs: built in 1950 — expect roof / HVAC / electrical / plumbing capex.
Questions for the listing agent
- Built in 1950 — when were the roof, HVAC, electrical panel, plumbing, and water heater last replaced?
- Is there a deadline driving the sale (1031 exchange, divorce, estate, relocation)? That informs how much negotiation room exists.
- What's the average days-on-market for RENTAL listings here right now (not sales)? A rising rental-DOM trend means longer vacancies and softer asking-rent achievability than the comps imply.
- What's the recent tenant-quality profile in this submarket — average credit score on applications, eviction rate, late-payment / NSF rate, and stable-employment percentage? A property-management company in the area should have these aggregated.
- How much new for-sale + rental construction is in the pipeline within 1–3 miles? Heavy new supply typically softens prices + rents 12–24 months out; constrained supply supports both.
Investment metrics
- 1% rule
- 1.26% ✓
- Cap rate
- 9.96%
- Cash-on-cash
- 13.09%
- DSCR
- 1.58
- GRM
- 6.6
CMA / ARV
No comps found within radius.
Projected returns pro-forma
-0.64% appreciation · 3.0% rent growth · sell at horizon
- IRR
- 10.5%
- Equity multiple
- 1.48×
- Total profit
- $11,521
- Equity at exit
- $21,980
- IRR
- 16.2%
- Equity multiple
- 2.67×
- Total profit
- $39,748
- Equity at exit
- $24,351
Cash invested: $23,800 (down + closing). Projections, not guarantees.
Landlord ↔ Tenant lean methodology
- Overall (STATE)
- 62 Landlord-Friendly
- State Michigan
- 62 Landlord-Friendly · EVEN
- County
- — inherits STATE
- City
- — inherits STATE
ZIP-level market 49762
- Home prices YoY
- -0.5%
- Active inventory
- 22
- Price-to-rent
- 6.6×
Monthly cashflow live
- Estimated rent
- $1,072 medium interval (Pro) →
- Mortgage (P&I)
- −$446
- Tax est. 1.5%
- −$106 /mo · $1,275/yr
- Insurance
- −$35
- HOA
- −$0
- Vacancy / Maint / Mgmt
- −$225
- Net cashflow
- $260
Break-even live
Sensitivity live
| Price | -10% $318 | -5% $289 | +0% $260 | +5% $230 | +10% $201 |
|---|---|---|---|---|---|
| Rent | -10% $175 | -5% $217 | +0% $260 | +5% $302 | +10% $344 |
| Rate | -1.0pp $302 | -0.5pp $281 | base $260 | +0.5pp $238 | +1.0pp $215 |
UW: 25.0% down · 7.5% · 30yr · 1.5% tax · 5.0% vac · 8.0% maint · 8.0% mgmt
Financing live
Cash to close
- Down payment
- $21,250
- Closing costs
- $2,550
- Reserves months
- —
- Total cash needed
- —
Loan-product check · same deal, 3 products live
Conventional
25% down · 7.5% · 30yr
- Down + closing
- —
- Monthly P&I
- —
- Monthly cashflow
- —
- DSCR
- —
- Eligible?
- —
Personal DTI + credit; lowest rate.
DSCR
20% down · 8.5% · 30yr
- Down + closing
- —
- Monthly P&I
- —
- Monthly cashflow
- —
- DSCR
- —
- Eligible?
- —
No personal income docs; deal must DSCR.
Hard money
10% down · 12.0% · 12mo
- Down + closing
- —
- Monthly P&I
- —
- Monthly cashflow
- —
- DSCR
- —
- Eligible?
- —
Short-term bridge; refi at stabilization.
Listing history 5 events
-
2026-06-21days on market $85,000 Active 5 DOM
-
2026-06-18days on market $85,000 Active 3 DOM
-
2026-06-17days on market $85,000 Active 2 DOM
-
2026-06-16remarks 580-char remark
-
2026-06-16$85,000 Active 1 DOM
ⓘ Source: listings_history table (triggers on properties + properties_extension) + one-shot
backfill from property_details.listing_events for pre-trigger history.
Climate risk First Street
- Flood 1/10 Low FEMA zone X (unshaded) · 0% chance over 30 yrs
- Wildfire 3/10 Moderate
- Heat 1/10 Low 7 d/yr ≥88°F today · 14 d/yr by 30 yrs out
- Wind 1/10 Low
- Air quality 2/10 Low 1 unhealthy d/yr today · 1 by 30 yrs out
Nearby sold comps map
Loading sold comps map…
Walkable amenities ~0.75 mi
Loading nearby amenities…
Taxation est. · year 1
- Rental income
- $12,865
- − Mortgage interest
- −$4,761
- − Property taxes
- −$1,275
- − Insurance
- −$425
- − Repairs & maintenance
- −$1,029
- − Management
- −$1,029
- − Depreciation
- −$2,473
- Taxable income
- $1,873
- Est. tax owed @ 24.0%
- −$449
- After-tax cash flow
- $2,665/yr
For passive investors: Depreciation is non-cash, so a rental often shows a tax loss while cash-flowing — sheltering income. Rental losses are passive: they offset passive income freely, and up to $25,000/yr can offset ordinary (W-2) income if you actively participate and your MAGI is under $100k (phasing out to $0 by $150k); unused losses carry forward. On sale, claimed depreciation is recaptured at up to 25%, and gains may owe capital-gains tax (a 1031 exchange can defer both). Figures are a year-1 estimate at your 24.0% rate — not tax advice; consult a CPA.
Schools (NCES district)
- District
- Engadine Consolidated Schools
- NCES district ID
- 2615600
- Math proficiency
- 25% ▲ 5.00%
- Reading proficiency
- 40% ▲ 15.00%
- Median HH income
- $39,019
- Composite
- 29.93/100
- National rank
- #11667
- State rank
- #504 of 760 in MI
Livability — Naubinway
No livability data for this city. (Only ~50 U.S. cities are tracked.)
Census & demographics
- Population (ZIP)
- 620
Population outlook (Mackinac County) Hauer SSP2
- Today (2025)
- 10,449 people
- By 2030
- 10,075 · -3.6%
- By 2040
- 9,220 · -11.8%
- By 2050
- 8,595 · -17.7%
- By 2075
- 7,996 · -23.5%
- By 2100
- 7,434 · -28.9%
Race, ethnicity, and origin ACS 2023
- Neighborhood character
- Predominantly White (75%)
- Race & ethnicity
- White 75% Native American 14% Two or more races 9% Hispanic / Latino 2%
- Common ancestry
- Iranian 9% Lithuanian 6% Romanian 4%
- Foreign-born
- 1% · Canada
- Languages at home
- 98% English-only · Spanish 1% French/Haitian/Cajun 0% Other Indo-European 0%
Political lean MEDSL · Mackinac
- 2024 margin
- Strong R (+24.9) · D 37.0% · R 61.8% · Other 1.2%
- 2008→2024 swing
- -21.1pp toward R · 2008: -3.8pp · 2024: -24.9pp
- All cycles
- 2024: R+24.9 2020: R+23.8 2016: R+27.2 2012: R+12.2 2008: R+3.8
Not yet ingested
- Civics
- —
Market trends
- HPI YoY
- ▼ -0.64%
- Current HPI
- 128.9922
- Rent YoY
- —
- Metro
- —
- State GDP YoY
- ▲ 1.37%
- F500 in state
- 28
Industry mix (Fortune 500 HQ in MI)
| Industry | F500 HQs | Revenue |
|---|---|---|
| Automotive Parts | 3 | $48B |
|
||
| Automotive | 2 | $372B |
|
||
| Chemicals | 1 | $45B |
|
||
| Automotive Retail | 1 | $29B |
|
||
| Healthcare / Medical Devices | 1 | $23B |
|
||
| Automotive Technology | 1 | $20B |
|
||
Price history
+0.0% since first listed2 events — show timeline
- 2026-06-15 Listed $85,000 UPAR
- 2026-06-15 Listed $85,000 MiRealSource-MiMLS
Property tax history
-3.3%/yrLatest (2024): $82 · -55.6% YoY. Source: county tax records.
Cash-flow waterfall
monthlySold comps — $/sqft
last 12 mo · ≤1 miLoading sold comps…