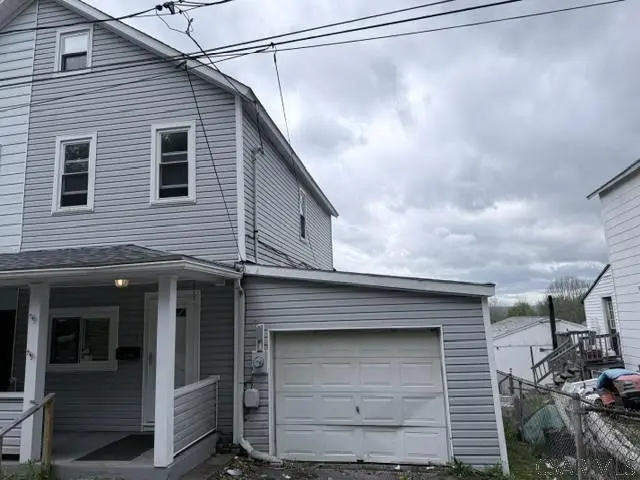
729 Third St · Scalp Level, PA
Flood risk 1/10 · Minimal
- FEMA flood zone
- X (unshaded)
- Chance of flooding over 30 yrs
- 0.0%
- Est. flood insurance / yr
- $473 – $860
Fire risk 2/10 · Minimal
- Est. fire insurance / yr
- $511 – $949
Heat risk 2/10 · Minimal
- Hot days now (above 91°F)
- 7 days/yr
- Hot days in 30 yrs
- 17 days/yr
Wind risk 2/10 · Minimal
- Chance of severe wind over 30 yrs
- —
Air-quality risk 2/10 · Minimal
- Unhealthy air days now
- 1 days/yr
- Unhealthy air days in 30 yrs
- 2 days/yr
Risk factors via First Street. Map © Google.
Why this score? — see what drove the B+ grade
The composite is a weighted blend of 9 inputs, each scored 0–100. Each bar is that input's sub-score; the figure is the points it added to the 100-point composite (weight × sub-score).
- Cash flow +30.0/30.0
- ARV discount +15.0/15.0
- 1% rule +10.0/10.0
- DSCR +10.0/10.0
- Schools +5.5/10.0
- Livability +3.2/5.0
- Rent growth +2.5/5.0
- Condition / age +2.5/5.0
- Appreciation +0.0/10.0
$47,500
🖨 Deal sheet 📄 Offer letter ✓ Due diligence
Listing remarks
RICHLAND TOWNSHIP 1/2 DOUBLE HOME IS WAITING FOR IT'S NEXT OWNER. This 3 bedroom home's 1st floor includes living room with panelled walls and WW carpet; eat-in kitchen with oak cabinets and appliances, updated 3/4 bath with vanity and walk-in shower, and mud room. Upstairs you will find 3 bedrooms with panelled walls and WW carpet. Walk-up attic provides plenty of storage. Laundry area with washer and dryer is located in the unfinished basement. Oil forced air heat to keep you warm. Covered front porch, rear deck, one-car attached garage plus off-street parking, newer roof, and so much more. Conveniently located to all local amenities including shopping, hospitals/medical facilities, resta
Key facts
- Covered front porch
- Updated bath
- Eat-in kitchen
Tags
Property features AI
Finance
- Financial info: Annual tax amount: $445
Exterior
- Parking: Attached garage (1 car); Off-street parking; Gravel parking area
- Utilities: Public water; Public sewer (sewer available)
- Home design: Two-story single family residence; Residential zoning
- Construction: Aluminum siding and frame construction; Shingle roof
- Exterior features: Covered porch; Deck; Patio; Rectangular lot; Public maintained road; City street frontage
Interior
- Kitchen: Dishwasher; Range / Oven; Refrigerator
- Flooring: Carpet; Linoleum
- Bathrooms: 1 full bathroom
- Heating & cooling: Forced air heating (oil); Ceiling fan(s)
- Interior features: Eat-in kitchen; Double pane windows; Full unfinished basement
- Laundry & utility: Washer; Dryer
Neighborhood map
What this means for you Summary
Snapshot
- This is a 3-bed/1.0-bath single-family listed at $48k.
Deal economics
- At list price, monthly cash flow is $752 ($9k/yr) — positive.
- The deal already cash-flows at list — no discount required.
- Meets the 1% rule at list price ($1k rent vs $48k).
- Recommended offer: $46k (3.0% below list) — sets the bar for market timing.
Location & tenants
- Location reads 64/100 on livability (#1,230 in PA) — a middle-class / working-renter tenant base. Strengths: cost of living A+, housing A+, health & safety A+; Watch: crime D+, schools F, amenities F.
- Richland SD (suburban): math 57% / reading 72% proficiency, ranked #54 of 539 in PA (top 10%) — acceptable for families but not a draw, mixed tenant base, ~2y average lease; only 19% free/reduced lunch — higher-income household profile.
- Market conditions: 45 active listings in the ZIP; 64 units permitted in Cambria County in 2024 (0 in 5+ unit buildings).
Forward outlook
- Local home prices are declining (-3.0%/yr); year-one equity from $328 of loan paydown is wiped out by about $1k of value loss. Plan a longer hold.
- Cambria County population projected at -28% by 2050 — secular population decline; favor cash flow + early exit over multi-decade hold.
- At projected returns (-3.0% appreciation + 3.0% rent growth), your $13k cash investment doubles in ~2 years — after that, you're playing with house money.
Negotiation context
- It's been on market 36 days — a 3% lower offer ($46k) is reasonable based on typical stale-listing flexibility.
Questions for the listing agent
- It's been on market 36 days. Have you received any prior offers? Is the seller open to a 3% concession, seller financing, or rate buy-down credit?
- Is there a deadline driving the sale (1031 exchange, divorce, estate, relocation)? That informs how much negotiation room exists.
- Schools are F-rated, which usually means shorter tenancies and higher turnover. Who's the typical renter profile here, and what's been the actual vacancy rate?
- Crime grade is D in this area — have there been break-ins, vandalism, or insurance claims at this property in the last 3 years? What carrier currently insures it and at what premium?
- What's the average days-on-market for RENTAL listings here right now (not sales)? A rising rental-DOM trend means longer vacancies and softer asking-rent achievability than the comps imply.
- What's the recent tenant-quality profile in this submarket — average credit score on applications, eviction rate, late-payment / NSF rate, and stable-employment percentage? A property-management company in the area should have these aggregated.
- How much new for-sale + rental construction is in the pipeline within 1–3 miles? Heavy new supply typically softens prices + rents 12–24 months out; constrained supply supports both.
Investment metrics
- 1% rule
- 2.81% ✓
- Cap rate
- 25.30%
- Cash-on-cash
- 67.87%
- DSCR
- 4.02
- GRM
- 3.0
CMA / ARV
- ARV (median comp)
- $61,134
- List price
- $47,500
- Delta
- -22.30%
- Verdict
- UNDERPRICED
- Comps
- 7 within 1.0 mi
Show comp detail 1 sale within ~0.75 mi
| Address | Dist | Beds/Ba | Sqft | Sold | Price | $/sf | Match |
|---|---|---|---|---|---|---|---|
| 1540 Paint St | 0.75mi | 3/2.5 | 1,104 (+2%) | 20mo | $42,500 | $38 | 39 |
Match score weights: distance 35% · size 25% · config 20% · recency 20%. Top-matched comps best support the ARV.
Projected returns pro-forma
-3.0% appreciation · 3.0% rent growth · sell at horizon
- IRR
- 67.2%
- Equity multiple
- 4.02×
- Total profit
- $40,218
- Equity at exit
- $7,082
- IRR
- 71.4%
- Equity multiple
- 8.27×
- Total profit
- $96,732
- Equity at exit
- $4,107
Cash invested: $13,300 (down + closing). Projections, not guarantees.
Landlord ↔ Tenant lean methodology
- Overall (STATE)
- 62 Landlord-Friendly
- State Pennsylvania
- 62 Landlord-Friendly · EVEN
- County
- — inherits STATE
- City
- — inherits STATE
ZIP-level market 15963
- Home prices YoY
- -24.4%
- Active inventory
- 45
- Price-to-rent
- 3.0×
Monthly cashflow live
- Estimated rent
- $1,337 medium interval (Pro) →
- Mortgage (P&I)
- −$249
- Tax from tax record
- −$35 /mo · $417/yr
- Insurance
- −$20
- HOA
- −$0
- Vacancy / Maint / Mgmt
- −$281
- Net cashflow
- $752
Break-even live
UW: 25.0% down · 7.5% · 30yr · 1.5% tax · 5.0% vac · 8.0% maint · 8.0% mgmt
Financing live
Cash to close
- Down payment
- $11,875
- Closing costs
- $1,425
- Reserves months
- —
- Total cash needed
- —
Loan-product check · same deal, 3 products live
Conventional
25% down · 7.5% · 30yr
- Down + closing
- —
- Monthly P&I
- —
- Monthly cashflow
- —
- DSCR
- —
- Eligible?
- —
Personal DTI + credit; lowest rate.
DSCR
20% down · 8.5% · 30yr
- Down + closing
- —
- Monthly P&I
- —
- Monthly cashflow
- —
- DSCR
- —
- Eligible?
- —
No personal income docs; deal must DSCR.
Hard money
10% down · 12.0% · 12mo
- Down + closing
- —
- Monthly P&I
- —
- Monthly cashflow
- —
- DSCR
- —
- Eligible?
- —
Short-term bridge; refi at stabilization.
Listing history 17 events
-
2026-06-19days on market $47,500 Active 36 DOM
-
2026-06-18days on market $47,500 Active 35 DOM
-
2026-06-17days on market $47,500 Active 34 DOM
-
2026-06-16days on market $47,500 Active 33 DOM
-
2026-06-15days on market $47,500 Active 32 DOM
-
2026-06-14days on market $47,500 Active 30 DOM
-
2026-06-12days on market $47,500 Active 29 DOM
-
2026-06-09days on market $47,500 Active 26 DOM
-
2026-06-08days on market $47,500 Active 25 DOM
-
2026-06-07days on market $47,500 Active 24 DOM
-
2026-06-05days on market $47,500 Active 21 DOM
-
2026-06-03days on market $47,500 Active 20 DOM
-
2026-06-02days on market $47,500 Active 19 DOM
-
2026-06-01days on market $47,500 Active 18 DOM
-
2026-05-31days on market $47,500 Active 17 DOM
-
2026-05-30days on market $47,500 Active 16 DOM
-
2026-05-14$47,500 Active 852-char remark
ⓘ Source: listings_history table (triggers on properties + properties_extension) + one-shot
backfill from property_details.listing_events for pre-trigger history.
Tax reassessment forecast PA · Partial reset (capped growth)
- Current annual tax
- $417 · $35/mo
- Projected year-2 tax
- $584 · $49/mo
- Expected delta
- +$167/yr (+$14/mo · 39.9%)
ⓘ Screening estimate from a state-policy table — verify with the county assessor before closing.
Climate risk First Street
- Flood 1/10 Low FEMA zone X (unshaded) · 0% chance over 30 yrs
- Wildfire 2/10 Low
- Heat 2/10 Low 7 d/yr ≥91°F today · 17 d/yr by 30 yrs out
- Wind 2/10 Low
- Air quality 2/10 Low 1 unhealthy d/yr today · 2 by 30 yrs out
Nearby sold comps map
Loading sold comps map…
Walkable amenities ~0.75 mi
Loading nearby amenities…
Taxation est. · year 1
- Rental income
- $16,039
- − Mortgage interest
- −$2,661
- − Property taxes
- −$417
- − Insurance
- −$238
- − Repairs & maintenance
- −$1,283
- − Management
- −$1,283
- − Depreciation
- −$1,382
- Taxable income
- $8,775
- Est. tax owed @ 24.0%
- −$2,106
- After-tax cash flow
- $6,921/yr
For passive investors: Depreciation is non-cash, so a rental often shows a tax loss while cash-flowing — sheltering income. Rental losses are passive: they offset passive income freely, and up to $25,000/yr can offset ordinary (W-2) income if you actively participate and your MAGI is under $100k (phasing out to $0 by $150k); unused losses carry forward. On sale, claimed depreciation is recaptured at up to 25%, and gains may owe capital-gains tax (a 1031 exchange can defer both). Figures are a year-1 estimate at your 24.0% rate — not tax advice; consult a CPA.
Schools (NCES district)
- District
- Richland SD
- NCES district ID
- 4220250
- Math proficiency
- 57% ▼ -4.00%
- Reading proficiency
- 72% ▼ -1.00%
- Median HH income
- $49,705
- Composite
- 54.72/100
- National rank
- #1322
- State rank
- #54 of 539 in PA
Livability — Scalp Level
- Score
- 64/100
- State rank
- #1230
- US rank
- #14673
Category grades
Schools grade is shown separately in the Schools card above.
Census & demographics
- Population (ZIP)
- 10,383
Population outlook (Cambria County) Hauer SSP2
- Today (2025)
- 122,754 people
- By 2030
- 115,827 · -5.6%
- By 2040
- 101,309 · -17.5%
- By 2050
- 88,379 · -28.0%
- By 2075
- 65,237 · -46.9%
- By 2100
- 46,909 · -61.8%
Race, ethnicity, and origin ACS 2023
- Neighborhood character
- Predominantly White (96%)
- Race & ethnicity
- White 96% Hispanic / Latino 3% Two or more races 2%
- Common ancestry
- Romanian 17% Slovak 3% Iranian 3%
- Foreign-born
- 0%
- Languages at home
- 98% English-only · Spanish 2%
Political lean MEDSL · Cambria
- 2024 margin
- Solid R (+39.7) · D 29.8% · R 69.5%
- 2008→2024 swing
- -40.4pp toward R · 2008: 0.7pp · 2024: -39.7pp
- All cycles
- 2024: R+39.7 2020: R+37.3 2016: R+37.8 2012: R+17.8 2008: D+0.7
Not yet ingested
- Civics
- —
Market trends
- HPI YoY
- ▼ -45.99%
- Current HPI
- 142.2017
- Rent YoY
- —
- Metro
- —
- State GDP YoY
- ▲ 1.68%
- F500 in state
- 34
Industry mix (Fortune 500 HQ in PA)
| Industry | F500 HQs | Revenue |
|---|---|---|
| Healthcare | 2 | $309B |
|
||
| Insurance | 2 | $27B |
|
||
| Telecommunications / Media | 1 | $124B |
|
||
| Industrial Distribution | 1 | $22B |
|
||
| Financial Services | 1 | $20B |
|
||
| Chemicals / Materials | 1 | $18B |
|
||
Price history
1 event — show timeline
- 2026-05-14 Listed $47,500 CSMLS
Property tax history
+1.6%/yrLatest (2026): $417 · +2.9% YoY. Source: county tax records.
Cash-flow waterfall
monthlySold comps — $/sqft
last 12 mo · ≤1 miLoading sold comps…