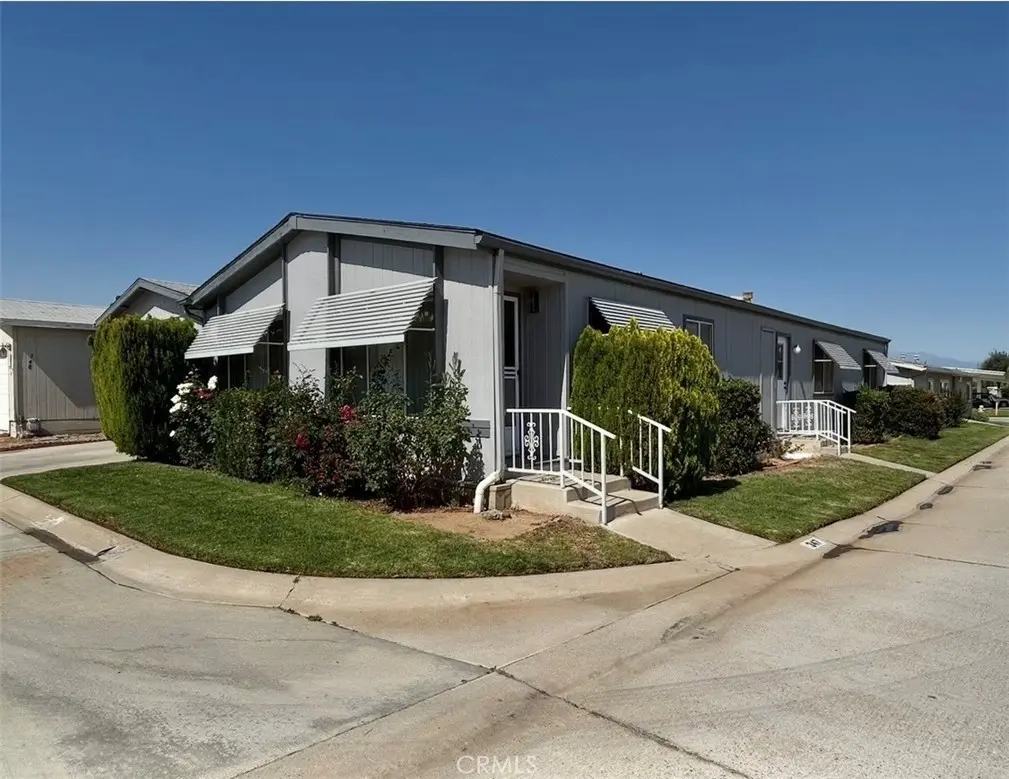
27250 Murrieta Rd #347 · Menifee, CA
Flood risk 1/10 · Minimal
- FEMA flood zone
- X (unshaded)
- Chance of flooding over 30 yrs
- 0.0%
- Est. flood insurance / yr
- $507 – $1,088
Fire risk 7/10 · Major
- Est. fire insurance / yr
- $659 – $1,223
Heat risk 7/10 · Major
- Hot days now (above 105°F)
- 7 days/yr
- Hot days in 30 yrs
- 20 days/yr
Wind risk 1/10 · Minimal
- Chance of severe wind over 30 yrs
- —
Air-quality risk 5/10 · Moderate
- Unhealthy air days now
- 9 days/yr
- Unhealthy air days in 30 yrs
- 11 days/yr
Risk factors via First Street. Map © Google.
Why this score? — see what drove the B+ grade
The composite is a weighted blend of 9 inputs, each scored 0–100. Each bar is that input's sub-score; the figure is the points it added to the 100-point composite (weight × sub-score).
- Cash flow +30.0/30.0
- ARV discount +13.4/15.0
- 1% rule +10.0/10.0
- DSCR +10.0/10.0
- Schools +4.5/10.0
- Rent growth +4.0/5.0
- Livability +3.2/5.0
- Condition / age +2.2/5.0
- Appreciation +0.0/10.0
$175,000
🖨 Deal sheet 📄 Offer letter ✓ Due diligence
Listing remarks
DIAMOND IN THE ROUGH!!! Located in a desirable 55+ community, this spacious triple-section manufactured home sits on a fantastic corner location with great curb appeal and is just steps from the Sun Meadows clubhouse, pool/spa, putting green, and community amenities! This 3-bedroom, 2-bath home offers a functional floor plan with each bedroom featuring a walk-in closet. Interior features include finished drywall, vaulted ceilings, ceiling fans, white raised-panel doors, and a cozy corner fireplace with hearth and mantel in the family room. The open kitchen offers abundant cabinetry and a breakfast bar overlooking the living area. Large primary suite includes dual sinks, walk-in shower with
Key facts
- Corner location
- Community amenities
- Walk-in closet
Tags
Property features AI
Finance
- Other: Special assessments; Park name: SUN MEADOWS MOBILE HOME PARK; Pets allowed with breed restrictions
- Financial info: Monthly land lease of $997 (seller provided)
- HOA & community: Part of the Sun Meadow association (Sun Meadow amenities include pool, clubhouse, pickleball, sauna, and front yard maintenance); Senior community; Manager approval required; Park on property
Exterior
- Parking: Attached 2-car garage; 2 total parking spaces
- Utilities: Public sewer; District/public water
- Home design: Single-story manufactured home (Villa West 608C); Mobile home remains; One story
- Construction: Model: Villa West 608C; Year built (from public records)
- Exterior features: Association pool; Sprinklers in front and on side; Landscaped front and back yards; Lawn; Level/flat lot with street access; Front yard; Back yard; Paved; Corner lot; Close to clubhouse
Interior
- Bathrooms: 2 full bathrooms
- Heating & cooling: Central electric cooling; Central natural gas furnace heating
- Interior features: One-level floorplan with front door entry; Entry located at the front door
- Laundry & utility: Inside laundry room; Washer included; Dryer included; Washer hookup; Gas dryer hookup; Individual laundry room
Neighborhood map
What this means for you Summary
Snapshot
- This is a 3-bed/2.0-bath manufactured listed at $175k. Condition is rated fair.
Deal economics
- At list price, monthly cash flow is $969 ($12k/yr) — positive.
- The deal already cash-flows at list — no discount required.
- Meets the 1% rule at list price ($3k rent vs $175k).
- Recommended offer: $172k (1.5% below list) — sets the bar for market timing.
- Cap rate 12.9% vs local median 3.6% in Menifee — top-decile yield for the area; either an underpriced asset or a hidden risk that comps aren't pricing in. Stress-test before assuming the spread holds.
Location & tenants
- Location reads 64/100 on livability (#407 in CA) — a middle-class / working-renter tenant base. Strengths: housing A+, crime A, employment A-; Watch: schools D+, health & safety D+, amenities D.
- Menifee Union Elementary (suburban): math 43% / reading 56% proficiency, ranked #434 of 1,400 in CA (top 31%) — families likely to look elsewhere, expect single-tenant / working-renter base with shorter leases.
- Market conditions: Rents rising fast (+6.1%/yr); 197 active listings in the ZIP; 18 comparable units currently listed for rent nearby; rentals leasing fast (median 2d on market — plan ~1-2 weeks tenant-placement turnaround); 9,195 units permitted in Riverside County in 2024 (1,512 in 5+ unit buildings).
- At $2,757/mo this rent would consume 57% of the median local household income ($58k/yr) (locally 1163% of renters already pay >50% of income on rent) — very limited rent-growth headroom before tenants either downsize or default.
Forward outlook
- Local home prices are declining (-3.0%/yr); year-one equity from $1k of loan paydown is wiped out by about $5k of value loss. Plan a longer hold.
- Riverside County population projected at +22% by 2050 — long-run rental-demand tailwind backs the buy-and-hold thesis.
- At projected returns (-3.0% appreciation + 6.1% rent growth), your $49k cash investment doubles in ~5 years — after that, you're playing with house money.
Negotiation context
- It's been on market 27 days — a 2% lower offer ($172k) is reasonable based on typical stale-listing flexibility.
Risks & watch-outs
- Climate carrying-cost: major wildfire risk; extreme-heat days projected 7→20/yr by 2055 (HVAC capex compounding) — expect insurance premiums to compound above CPI over the hold.
Questions for the listing agent
- Have any recent inspections been done? Can we get a copy of the seller's disclosures and any deferred-maintenance estimates?
- Is there a deadline driving the sale (1031 exchange, divorce, estate, relocation)? That informs how much negotiation room exists.
- Schools are D-rated, which usually means shorter tenancies and higher turnover. Who's the typical renter profile here, and what's been the actual vacancy rate?
- What's the average days-on-market for RENTAL listings here right now (not sales)? A rising rental-DOM trend means longer vacancies and softer asking-rent achievability than the comps imply.
- What's the recent tenant-quality profile in this submarket — average credit score on applications, eviction rate, late-payment / NSF rate, and stable-employment percentage? A property-management company in the area should have these aggregated.
- How much new for-sale + rental construction is in the pipeline within 1–3 miles? Heavy new supply typically softens prices + rents 12–24 months out; constrained supply supports both.
Investment metrics
- 1% rule
- 1.58% ✓
- Cap rate
- 12.94%
- Cash-on-cash
- 23.73%
- DSCR
- 2.06
- GRM
- 5.3
CMA / ARV
- ARV (on-the-fly)
- $201,630
- Comps found
- 12
Show comp detail 12 sales within ~0.75 mi
| Address | Dist | Beds/Ba | Sqft | Sold | Price | $/sf | Match |
|---|---|---|---|---|---|---|---|
| 27250 Murrieta Rd #1 | 0.00mi | 3/2.0 | 1,830 (-0%) | 6mo | $127,500 | $70 | 95 |
| 27250 Murrieta Rd #298 | 0.00mi | 3/2.0 | 1,568 (-14%) | 4mo | $210,000 | $134 | 72 |
| 27250 Murrieta #126 | 0.09mi | 3/2.0 | 1,568 (-14%) | 0mo | $225,000 | $143 | 72 |
| 27250 Murrieta #85 | 0.00mi | 2/2.0 (-1) | 1,570 (-14%) | 0mo | $145,000 | $92 | 71 |
| 27250 Murrieta Rd #332 | 0.00mi | 2/2.0 (-1) | 1,570 (-14%) | 1mo | $160,000 | $102 | 70 |
| 27250 Murrieta Rd #225 | 0.00mi | 3/2.0 | 1,568 (-14%) | 10mo | $222,500 | $142 | 67 |
| 27250 Murrieta #84 | 0.00mi | 2/2.0 (-1) | 1,560 (-15%) | 4mo | $179,900 | $115 | 67 |
| 27250 Murrieta Rd #295 | 0.00mi | 3/2.0 | 2,072 (+13%) | 14mo | $195,000 | $94 | 67 |
| 27250 Murrieta Rd #220 | 0.20mi | 3/2.0 | 1,568 (-14%) | 14mo | $209,000 | $133 | 55 |
| 27701 Murrieta Rd #217 | 0.58mi | 3/2.0 | 1,692 (-8%) | 11mo | $65,000 | $38 | 51 |
| 27601 Sun City Blvd Sp 127 | 0.70mi | 2/2.0 (-1) | 1,704 (-7%) | 12mo | $85,000 | $50 | 40 |
| 27601 Sun City Blvd #312 | 0.64mi | 2/2.0 (-1) | 1,636 (-11%) | 11mo | $180,000 | $110 | 38 |
Match score weights: distance 35% · size 25% · config 20% · recency 20%. Top-matched comps best support the ARV.
Projected returns pro-forma
-3.0% appreciation · 6.1% rent growth · sell at horizon
- IRR
- 20.4%
- Equity multiple
- 1.86×
- Total profit
- $42,256
- Equity at exit
- $26,093
- IRR
- 30.6%
- Equity multiple
- 4.17×
- Total profit
- $155,199
- Equity at exit
- $15,131
Cash invested: $49,000 (down + closing). Projections, not guarantees.
Landlord ↔ Tenant lean methodology
- Overall (STATE)
- 18 Strongly Tenant-Friendly
- State California
- 18 Strongly Tenant-Friendly · D+13
- County
- — inherits STATE
- City
- — inherits STATE
ZIP-level market 92586
- Home prices YoY
- -19.1%
- Rents YoY
- 6.1%
- Active inventory
- 197
- Price-to-rent
- 5.3×
Monthly cashflow live
- Estimated rent
- $2,757 high interval (Pro) →
- Mortgage (P&I)
- −$918
- Tax est. 1.5%
- −$219 /mo · $2,625/yr
- Insurance
- −$73
- HOA
- −$0
- Vacancy / Maint / Mgmt
- −$579
- Net cashflow
- $969
Break-even live
UW: 25.0% down · 7.5% · 30yr · 1.5% tax · 5.0% vac · 8.0% maint · 8.0% mgmt
Financing live
Cash to close
- Down payment
- $43,750
- Closing costs
- $5,250
- Reserves months
- —
- Total cash needed
- —
Loan-product check · same deal, 3 products live
Conventional
25% down · 7.5% · 30yr
- Down + closing
- —
- Monthly P&I
- —
- Monthly cashflow
- —
- DSCR
- —
- Eligible?
- —
Personal DTI + credit; lowest rate.
DSCR
20% down · 8.5% · 30yr
- Down + closing
- —
- Monthly P&I
- —
- Monthly cashflow
- —
- DSCR
- —
- Eligible?
- —
No personal income docs; deal must DSCR.
Hard money
10% down · 12.0% · 12mo
- Down + closing
- —
- Monthly P&I
- —
- Monthly cashflow
- —
- DSCR
- —
- Eligible?
- —
Short-term bridge; refi at stabilization.
Rent comps 18 comps
| Address | Beds | Baths | Sqft | Rent | $/sqft | DOM | Units | Dist |
|---|---|---|---|---|---|---|---|---|
| 29196 Crestone Dr Sun City, CA | 2.0 | 2.0 | 1393 | $1,995 | $1.43 | 19d | 1 | 0.30mi |
| 26460 Spaniel Ln Menifee, CA | 3.0 | 2.0 | 2000 | $2,995 | $1.50 | 1d | 1 | 0.32mi |
| 26772 Maris Ct Menifee, CA | 3.0 | 2.0 | 1715 | $2,800 | $1.63 | 1d | 1 | 0.48mi |
| 27305 Uppercrest Ct Menifee, CA | 3.0 | 2.0 | 1318 | $2,353 | $1.79 | 22d | 1 | 0.53mi |
| 27055 Fan Ln Menifee, CA | 2.0 | 2.0 | 1800 | $2,950 | $1.64 | 1d | 1 | 0.63mi |
| 25615 Union Hill Dr Menifee, CA | 3.0 | 2.0 | 1350 | $2,550 | $1.89 | 15d | 1 | 0.66mi |
| 26805 China Dr Menifee, CA | 3.0 | 2.5 | 1773 | $3,000 | $1.69 | 24d | 1 | 0.82mi |
| 25861 McCall Blvd Menifee, CA | 2.0 | 2.0 | 1378 | $2,350 | $1.71 | 1d | 1 | 0.83mi |
| 28033 Radford Dr Menifee, CA | 2.0 | 2.0 | 1520 | $2,400 | $1.58 | 10d | 1 | 0.91mi |
| 27218 Pennywhistle Way Menifee, CA | 3.0 | 2.0 | 2000 | $3,700 | $1.85 | 1d | 1 | 0.91mi |
| 26156 Birkdale Rd Menifee, CA | 2.0 | 2.0 | 1285 | $2,000 | $1.56 | 1d | 1 | 0.91mi |
| 28375 Paseo Grande Dr Menifee, CA | 2.0 | 2.0 | 1285 | $2,395 | $1.86 | 1d | 1 | 0.96mi |
| 27379 Zeolite Rd Menifee, CA | 4.0 | 3.0 | 2529 | $3,700 | $1.46 | 10d | 1 | 1.02mi |
| 27379 Zeolite Rd Menifee, CA | 4.0 | 3.0 | 2550 | $3,700 | $1.45 | 1d | 1 | 1.02mi |
| 25650 Hartwick Rd Menifee, CA | 3.0 | 2.0 | 1603 | $2,650 | $1.65 | 22d | 1 | 1.13mi |
| 28461 Portsmouth Dr Menifee, CA | 3.0 | 2.0 | 1450 | $2,685 | $1.85 | 1d | 1 | 1.37mi |
| 26542 Sun City Blvd Menifee, CA | 2.0 | 2.0 | 1530 | $2,295 | $1.50 | 10d | 1 | 1.38mi |
| 27709 Camino Donaire Menifee, CA | 3.0 | 2.0 | 1317 | $3,000 | $2.28 | 1d | 1 | 1.48mi |
Listing history 14 events
-
2026-06-18days on market $175,000 Active 27 DOM
-
2026-06-17days on market $175,000 Active 26 DOM
-
2026-06-16days on market $175,000 Active 25 DOM
-
2026-06-15days on market $175,000 Active 24 DOM
-
2026-06-13days on market $175,000 Active 22 DOM
-
2026-06-09days on market $175,000 Active 18 DOM
-
2026-06-08days on market $175,000 Active 17 DOM
-
2026-06-07days on market $175,000 Active 16 DOM
-
2026-06-04days on market $175,000 Active 13 DOM
-
2026-06-03days on market $175,000 Active 12 DOM
-
2026-06-02days on market $175,000 Active 11 DOM
-
2026-06-01days on market $175,000 Active 10 DOM
-
2026-05-31days on market $175,000 Active 9 DOM
-
2026-05-22$175,000 Active
ⓘ Source: listings_history table (triggers on properties + properties_extension) + one-shot
backfill from property_details.listing_events for pre-trigger history.
Climate risk First Street
- Flood 1/10 Low FEMA zone X (unshaded) · 0% chance over 30 yrs
- Wildfire 7/10 Severe
- Heat 7/10 Severe 7 d/yr ≥105°F today · 20 d/yr by 30 yrs out
- Wind 1/10 Low
- Air quality 5/10 Major 9 unhealthy d/yr today · 11 by 30 yrs out
Nearby sold comps map
Loading sold comps map…
Walkable amenities ~0.75 mi
Loading nearby amenities…
Taxation est. · year 1
- Rental income
- $33,087
- − Mortgage interest
- −$9,803
- − Property taxes
- −$2,625
- − Insurance
- −$875
- − Repairs & maintenance
- −$2,647
- − Management
- −$2,647
- − Depreciation
- −$5,091
- Taxable income
- $9,399
- Est. tax owed @ 24.0%
- −$2,256
- After-tax cash flow
- $9,370/yr
For passive investors: Depreciation is non-cash, so a rental often shows a tax loss while cash-flowing — sheltering income. Rental losses are passive: they offset passive income freely, and up to $25,000/yr can offset ordinary (W-2) income if you actively participate and your MAGI is under $100k (phasing out to $0 by $150k); unused losses carry forward. On sale, claimed depreciation is recaptured at up to 25%, and gains may owe capital-gains tax (a 1031 exchange can defer both). Figures are a year-1 estimate at your 24.0% rate — not tax advice; consult a CPA.
Condition & rehab AI · 30 photos
This 3-bedroom, 2-bath home in a desirable 55+ community requires moderate renovations to modernize the kitchen and bathrooms, which will significantly increase its resale and rental value.
Repairs flagged
- Major kitchen cabinets — dated and worn
- Major bathroom cabinets — dated and worn
- Minor interior walls — paint peeling
Value-add opportunities
- Resale new kitchen cabinets — modernizes the space and adds value
- Resale new bathroom cabinets — modernizes the space and adds value
- Both paint interior walls — improves the appearance and adds value
Renovation cost estimate screening
| Repair item | Severity | Est. cost |
|---|---|---|
| kitchen cabinets · dated and worn | Major | $15,000–50,000 |
| bathroom cabinets · dated and worn | Major | $15,000–50,000 |
| interior walls · paint peeling | Minor | $500–3,000 |
| Total estimated repair cost · 3 items | $30,500–103,000 |
Value-add ROI direction
- Resale new kitchen cabinets — modernizes the space and adds value ↑
- Resale new bathroom cabinets — modernizes the space and adds value ↑
- Both paint interior walls — improves the appearance and adds value ↑
ⓘ Cost ranges are severity-bucket heuristics (US national rule-of-thumb). Get contractor quotes + a written scope before underwriting a rehab budget.
Schools (NCES district)
- District
- Menifee Union Elementary
- NCES district ID
- 0624540
- Math proficiency
- 43% ▬ 0.00%
- Reading proficiency
- 56% ▲ 3.00%
- Median HH income
- $58,228
- Composite
- 45.17/100
- National rank
- #5790
- State rank
- #434 of 1400 in CA
Livability — Menifee
- Score
- 64/100
- State rank
- #407
- US rank
- #13882
Category grades
Schools grade is shown separately in the Schools card above.
Census & demographics
- Census place
- Menifee, CA
- County
- Riverside County · 2,287,001 people
- City population
- 111,667
- Metro
- Riverside-San Bernardino-Ontario, CA
- Population (ZIP)
- 20,767
- Household income
- $57,708
- Rent vs Own
- Severe rent burden
- 1163.0
Population outlook (Riverside County) Hauer SSP2
- Today (2025)
- 2,664,475 people
- By 2030
- 2,802,692 · +5.2%
- By 2040
- 3,050,904 · +14.5%
- By 2050
- 3,256,783 · +22.2%
- By 2075
- 3,655,058 · +37.2%
- By 2100
- 3,766,594 · +41.4%
Race, ethnicity, and origin ACS 2023
- Neighborhood character
- Diverse neighborhood (Simpson 0.59)
- Race & ethnicity
- White 55% Hispanic / Latino 31% Two or more races 17% Black 6% Asian 3%
- Hispanic origin (detail)
- Mexican 25% Puerto Rican 1%
- Common ancestry
- Lithuanian 3% Italian 2% Romanian 1%
- Foreign-born
- 15% · Canada, Vietnam, China
- Languages at home
- 77% English-only · Spanish 18% Other Asian/Pacific 1% Other Indo-European 1%
Political lean MEDSL · Riverside
- 2024 margin
- Toss-up / Even · D 48.0% · R 49.3% · Other 2.6%
- 2008→2024 swing
- -3.6pp toward R · 2008: 2.3pp · 2024: -1.3pp
- All cycles
- 2024: R+1.3 2020: D+8.0 2016: D+4.3 2012: R+0.4 2008: D+2.3
Not yet ingested
- Civics
- —
Market trends
- HPI YoY
- ▼ -86.18%
- Current HPI
- 364.9577
- Rent YoY
- ▲ 6.10%
- Metro
- Riverside-San Bernardino-Ontario, CA
- State GDP YoY
- ▲ 3.21%
- F500 in state
- 116
Industry mix (Fortune 500 HQ in CA)
| Industry | F500 HQs | Revenue |
|---|---|---|
| Technology | 27 | $1,492B |
|
||
| Financial Services | 3 | $174B |
|
||
| Retail | 3 | $44B |
|
||
| Insurance | 3 | $26B |
|
||
| Media / Entertainment | 2 | $115B |
|
||
| Pharmaceuticals / Biotech | 2 | $62B |
|
||
Price history
1 event — show timeline
- 2026-05-22 Listed $175,000 CRMLS
Cash-flow waterfall
monthlySold comps — $/sqft
last 12 mo · ≤1 miLoading sold comps…