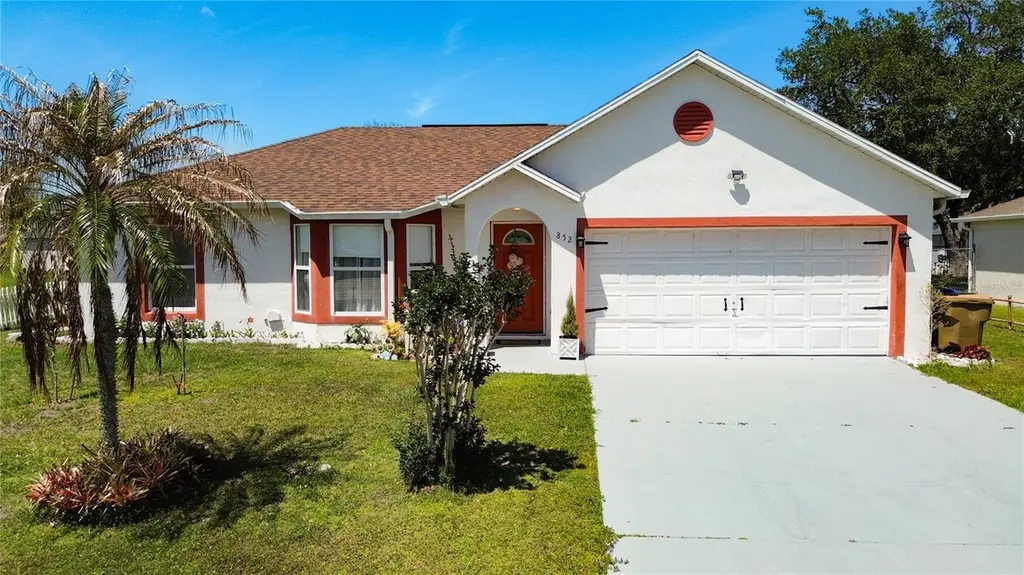
852 Franconville Ct · Poinciana, FL
Flood risk 1/10 · Minimal
- FEMA flood zone
- X (unshaded)
- Chance of flooding over 30 yrs
- 0.0%
- Est. flood insurance / yr
- $507 – $1,088
Fire risk 5/10 · Moderate
- Est. fire insurance / yr
- $947 – $1,759
Heat risk 9/10 · Severe
- Hot days now (above 108°F)
- 7 days/yr
- Hot days in 30 yrs
- 25 days/yr
Wind risk 9/10 · Severe
- Chance of severe wind over 30 yrs
- 99.0%
Air-quality risk 1/10 · Minimal
- Unhealthy air days now
- 0 days/yr
- Unhealthy air days in 30 yrs
- 0 days/yr
Risk factors via First Street. Map © Google.
Why this score? — see what drove the D grade
The composite is a weighted blend of 9 inputs, each scored 0–100. Each bar is that input's sub-score; the figure is the points it added to the 100-point composite (weight × sub-score).
- Cash flow +10.6/30.0
- ARV discount +8.9/15.0
- Appreciation +4.3/10.0
- Schools +3.6/10.0
- DSCR +3.1/10.0
- Livability +2.9/5.0
- Rent growth +2.8/5.0
- 1% rule +2.5/10.0
- Condition / age +2.5/5.0
$249,900
🖨 Deal sheet 📄 Offer letter ✓ Due diligence
Listing remarks MLS
This is not a Short Sale. This is a bank owned 3 BR 2 Bath home with a spacious layout, split bedroom plan, large open living room and a breakfast nook. Inside laundry and large fenced in backyard. Seller offering a BONUS to the SELLING AGENT andCLOSING COST CREDIT. BACK ON MARKET!
Key facts
- Replaced roof
- Fenced backyard
- 8,233 sq ft lot
Tags
Property features AI
Finance
- Other: Homestead exempt; No lease restrictions; Zoning: OPUD
- HOA & community: Homeowners association (Association of Poinciana Villages) with a required monthly fee of $100; Pets allowed
Exterior
- Parking: Attached 2-car garage (20 x 20)
- Utilities: Public water; Public sewer; Public utilities
- Home design: Single-family residence; One story; South-facing
- Construction: Block construction; Shingle roof; Slab foundation; Built area approximately 1,806 square feet (living area reported separately)
- Exterior features: Asphalt road frontage; Lot approximately 0.19 acres (0 to less than 1/4 acre)
Interior
- Kitchen: Dishwasher; Microwave; Range; Refrigerator
- Bedrooms: 3 bedrooms
- Flooring: Tile
- Bathrooms: 2 full bathrooms
- Heating & cooling: Central heating; Central air conditioning
- Interior features: Ceiling fans
- Laundry & utility: Laundry in garage
Neighborhood map
What this means for you Summary
Snapshot
- This is a 3-bed/2.0-bath single-family listed at $250k.
Deal economics
- At list price, monthly cash flow is $-124 ($-1k/yr) — negative.
- To cash-flow at today's rent, offer at most $228k (8.8% below list).
- To meet the 1% rule (rent ≥ 1% of price), the offer needs to be $186k (25.5% below list).
- Recommended offer: $186k (25.5% below list) — sets the bar for 1% rule.
- Cap rate 5.7% vs local median 4.3% in Poinciana — top-decile yield for the area; either an underpriced asset or a hidden risk that comps aren't pricing in. Stress-test before assuming the spread holds.
Location & tenants
- Location reads 57/100 on livability (#859 in FL) — a working-class tenant base; expect higher turnover. Strengths: cost of living A+, housing A+; Watch: employment D+, amenities F, commute F.
- Osceola (suburban): math 39% / reading 45% proficiency, ranked #60 of 73 in FL (top 82%) — families likely to look elsewhere, expect single-tenant / working-renter base with shorter leases; 60% free/reduced lunch — lower-income household profile, screen leases tightly.
- Zoned schools: Chestnut Elementary School For Science And Engineering (math 35% / reading 41%, grade F, #1,587 of 2,144 statewide, top 74%, 736 students, 62% FRL); Liberty High School (math 15% / reading 25%, grade F, #554 of 667 statewide, top 84%, 1,613 students, 52% FRL) — zoned schools at 57% FRL track the district average.
- Zoned-school proficiency averages 29% at this address vs 42% district-wide (-13 pts) — the specific schools serving this property underperform the Osceola average; the district grade overstates school quality for this exact location.
- Market conditions: Rents rising (+1.1%/yr); 1151 active listings in the ZIP; 40 comparable units currently listed for rent nearby; rentals at typical pace (median 24d on market — plan ~3-4 weeks tenant-placement turnaround); 8,813 units permitted in Osceola County in 2024 (3,072 in 5+ unit buildings).
- This rent runs 32% of the median local income ($69k/yr) — at the standard rent-burdened threshold; future hikes will face affordability resistance.
Forward outlook
- Local home prices are declining (-1.5%/yr); year-one equity from $2k of loan paydown is wiped out by about $4k of value loss. Plan a longer hold.
- Osceola County population projected at +73% by 2050 — long-run rental-demand tailwind backs the buy-and-hold thesis.
Negotiation context
- It's been on market 61 days — a 6% lower offer ($235k) is reasonable based on typical stale-listing flexibility.
- 6 sale attempts since 20y ago with the ask held roughly flat each time — persistent listings suggest the price (not the market) is what's stuck; bring a comps-based counter.
- Current owner paid $70k; list at $250k implies a 257% gain — meaningful room to come down on a strong offer.
Risks & watch-outs
- Climate carrying-cost: severe wind risk, 99% chance of damaging wind over 30y; moderate wildfire risk; extreme-heat days projected 7→25/yr by 2055 (HVAC capex compounding) — expect insurance premiums to compound above CPI over the hold.
Questions for the listing agent
- What do current leases actually rent for vs. the listed asking? Can we see a recent rent roll and the last 12 months of T-12 income?
- It's been on market 61 days. Have you received any prior offers? Is the seller open to a 25% concession, seller financing, or rate buy-down credit?
- What does the HOA fee cover, when was the last increase, and are there any pending special assessments or reserve-fund shortfalls?
- Why hasn't it sold? Are there any deal-killer items the seller is aware of (foundation, flood, title, zoning, code violations)?
- Is there a deadline driving the sale (1031 exchange, divorce, estate, relocation)? That informs how much negotiation room exists.
- Schools are F-rated, which usually means shorter tenancies and higher turnover. Who's the typical renter profile here, and what's been the actual vacancy rate?
- The area grade is low — what's the realistic commute time and amenity access for the typical tenant pool here? Any planned neighborhood developments (good or bad) we should know about?
- What's the average days-on-market for RENTAL listings here right now (not sales)? A rising rental-DOM trend means longer vacancies and softer asking-rent achievability than the comps imply.
- What's the recent tenant-quality profile in this submarket — average credit score on applications, eviction rate, late-payment / NSF rate, and stable-employment percentage? A property-management company in the area should have these aggregated.
- How much new for-sale + rental construction is in the pipeline within 1–3 miles? Heavy new supply typically softens prices + rents 12–24 months out; constrained supply supports both.
Investment metrics
- 1% rule
- 0.75% ✗
- Cap rate
- 5.70%
- Cash-on-cash
- -2.13%
- DSCR
- 0.91
- GRM
- 11.2
CMA / ARV
- ARV (on-the-fly)
- $257,670
- Comps found
- 8
Show comp detail 8 sales within ~0.75 mi
| Address | Dist | Beds/Ba | Sqft | Sold | Price | $/sf | Match |
|---|---|---|---|---|---|---|---|
| 814 Cabaret Ct | 0.19mi | 3/2.0 | 1,283 (+5%) | 20mo | $316,350 | $247 | 67 |
| 849 Jarnac Dr | 0.23mi | 3/2.0 | 1,336 (+9%) | 12mo | $260,000 | $195 | 65 |
| 918 Cannes Dr | 0.26mi | 3/2.0 | 1,284 (+5%) | 23mo | $270,000 | $210 | 61 |
| 702 Pasteur Ln | 0.41mi | 3/2.0 | 1,383 (+13%) | 6mo | $240,000 | $174 | 55 |
| 405 Martigues Dr | 0.59mi | 3/2.0 | 1,224 (-0%) | 21mo | $295,000 | $241 | 54 |
| 847 Massy Ct | 0.32mi | 3/2.0 | 1,332 (+9%) | 20mo | $260,000 | $195 | 54 |
| 306 Clermont Dr | 0.75mi | 3/2.0 | 1,153 (-6%) | 11mo | $255,000 | $221 | 46 |
| 859 Ognon Ct | 0.38mi | 3/2.0 | 1,400 (+14%) | 17mo | $275,000 | $196 | 44 |
Match score weights: distance 35% · size 25% · config 20% · recency 20%. Top-matched comps best support the ARV.
Projected returns pro-forma
-1.48% appreciation · 1.14% rent growth · sell at horizon
- IRR
- -12.5%
- Equity multiple
- 0.49×
- Total profit
- $-35,543
- Equity at exit
- $54,634
- IRR
- -7.2%
- Equity multiple
- 0.43×
- Total profit
- $-39,909
- Equity at exit
- $52,651
Cash invested: $69,972 (down + closing). Projections, not guarantees.
Landlord ↔ Tenant lean methodology
- Overall (STATE)
- 87 Strongly Landlord-Friendly
- State Florida
- 87 Strongly Landlord-Friendly · R+3
- County
- — inherits STATE
- City
- — inherits STATE
ZIP-level market 34759
- Home prices YoY
- -0.5%
- Rents YoY
- 1.1%
- Active inventory
- 1151
- Price-to-rent
- 11.2×
Monthly cashflow live
- Estimated rent
- $1,863 high interval (Pro) →
- Mortgage (P&I)
- −$1,311
- Tax from tax record
- −$81 /mo · $972/yr
- Insurance
- −$104
- HOA
- −$100
- Vacancy / Maint / Mgmt
- −$391
- Net cashflow
- $-124
Break-even live
UW: 25.0% down · 7.5% · 30yr · 1.5% tax · 5.0% vac · 8.0% maint · 8.0% mgmt
Financing live
Cash to close
- Down payment
- $62,475
- Closing costs
- $7,497
- Reserves months
- —
- Total cash needed
- —
Loan-product check · same deal, 3 products live
Conventional
25% down · 7.5% · 30yr
- Down + closing
- —
- Monthly P&I
- —
- Monthly cashflow
- —
- DSCR
- —
- Eligible?
- —
Personal DTI + credit; lowest rate.
DSCR
20% down · 8.5% · 30yr
- Down + closing
- —
- Monthly P&I
- —
- Monthly cashflow
- —
- DSCR
- —
- Eligible?
- —
No personal income docs; deal must DSCR.
Hard money
10% down · 12.0% · 12mo
- Down + closing
- —
- Monthly P&I
- —
- Monthly cashflow
- —
- DSCR
- —
- Eligible?
- —
Short-term bridge; refi at stabilization.
Rent comps 40 comps
| Address | Beds | Baths | Sqft | Rent | $/sqft | DOM | Units | Dist |
|---|---|---|---|---|---|---|---|---|
| 870 Jarnac Dr Kissimmee, FL | 3.0 | 2.0 | 1356 | $1,710 | $1.26 | 8d | 1 | 0.20mi |
| 657 Koala Ct Kissimmee, FL | 3.0 | 2.0 | 1246 | $2,020 | $1.62 | 3d | 1 | 0.24mi |
| 657 Koala Ct Kissimmee, FL | 3.0 | 2.0 | 1246 | $1,870 | $1.50 | 3d | 1 | 0.24mi |
| 827 Massy Ct Kissimmee, FL | 3.0 | 2.0 | 1480 | $1,639 | $1.11 | 22d | 1 | 0.25mi |
| 653 Koala Ct Kissimmee, FL | 3.0 | 2.0 | 1246 | $2,000 | $1.61 | 14d | 1 | 0.25mi |
| 853 Blanc Ct Kissimmee, FL | 3.0 | 2.0 | 1266 | $1,795 | $1.42 | 8d | 1 | 0.31mi |
| 659 Gazelle Dr Kissimmee, FL | 3.0 | 2.0 | 1495 | $1,875 | $1.25 | 23d | 1 | 0.44mi |
| 601 Fisher Ct Poinciana, FL | 3.0 | 2.0 | 1250 | $1,525 | $1.22 | 23d | 1 | 0.46mi |
| 319 Baccarat Ct Unit A Kissimmee, FL | 2.0 | 2.0 | 1092 | $1,375 | $1.26 | 24d | 1 | 0.54mi |
| 658 Caribou Ct Kissimmee, FL | 3.0 | 2.0 | 1300 | $1,800 | $1.38 | 3d | 1 | 0.56mi |
| 609 Tamarin Ln Kissimmee, FL | 3.0 | 2.0 | 1250 | $1,725 | $1.38 | 14d | 1 | 0.58mi |
| 721 Bittern Ln Unit A Kissimmee, FL | 3.0 | 2.0 | 1350 | $1,750 | $1.30 | 23d | 1 | 0.59mi |
| 736 Bittern Ln Kissimmee, FL | 3.0 | 2.0 | 1200 | $1,775 | $1.48 | 23d | 1 | 0.67mi |
| 641 Yak Ct Unit B Kissimmee, FL | 3.0 | 2.0 | 1162 | $1,650 | $1.42 | 23d | 1 | 0.71mi |
| 774 Squirrel Ct Kissimmee, FL | 3.0 | 2.0 | 1000 | $1,750 | $1.75 | 23d | 1 | 0.71mi |
| 783 Squirrel Ct Unit B Kissimmee, FL | 2.0 | 2.0 | 1100 | $1,300 | $1.18 | 23d | 1 | 0.72mi |
| 702 Bluebill Pl Unit A Poinciana, FL | 3.0 | 2.0 | 1240 | $1,650 | $1.33 | 23d | 1 | 0.75mi |
| 780 Platypus Ct Kissimmee, FL | 3.0 | 2.0 | 1350 | $1,695 | $1.26 | 23d | 1 | 0.78mi |
| 309 Clermont Dr Unit B Kissimmee, FL | 3.0 | 2.0 | 1400 | $1,800 | $1.29 | 24d | 1 | 0.78mi |
| 627 Bittern Ct Unit B Kissimmee, FL | 2.0 | 2.0 | 1113 | $1,400 | $1.26 | 3d | 1 | 0.82mi |
| 627B Bittern Ct Kissimmee, FL | 2.0 | 2.0 | 1113 | $1,400 | $1.26 | 12d | 1 | 0.82mi |
| 767 Platypus Ct Unit 767 Kissimmee, FL | 3.0 | 2.0 | 1162 | $1,650 | $1.42 | 23d | 1 | 0.83mi |
| 603 Muskrat Dr Kissimmee, FL | 4.0 | 2.0 | 1496 | $2,050 | $1.37 | 3d | 1 | 0.84mi |
| 612 Bluebill Ct Unit A Kissimmee, FL | 3.0 | 2.0 | 1162 | $1,650 | $1.42 | 3d | 1 | 0.86mi |
| 627 Bluebill Ct Kissimmee, FL | 3.0 | 2.0 | 1430 | $1,760 | $1.23 | 23d | 1 | 0.90mi |
| 754 Pelican Ct Kissimmee, FL | 3.0 | 2.0 | 1306 | $1,695 | $1.30 | 3d | 1 | 0.96mi |
| 519 Blackbird Ln Kissimmee, FL | 3.0 | 2.0 | 1200 | $1,700 | $1.42 | 23d | 1 | 0.98mi |
| 517 Blackbird Ln Kissimmee, FL | 3.0 | 2.0 | 1304 | $1,530 | $1.17 | 23d | 1 | 0.99mi |
| 539 Albatross Dr Unit B Kissimmee, FL | 3.0 | 2.0 | 1220 | $1,500 | $1.23 | 23d | 1 | 1.01mi |
| 514 Blackbird Ln Unit B Kissimmee, FL | 3.0 | 2.0 | 1394 | $1,600 | $1.15 | 21d | 1 | 1.04mi |
| 504 Albatross Dr Kissimmee, FL | 3.0 | 2.0 | 1250 | $1,700 | $1.36 | 3d | 1 | 1.05mi |
| 504 Albatross Dr Kissimmee, FL | 3.0 | 2.0 | 1250 | $1,700 | $1.36 | 23d | 1 | 1.05mi |
| 510 Blackbird Ln Kissimmee, FL | 3.0 | 2.0 | 1207 | $1,599 | $1.32 | 23d | 1 | 1.07mi |
| 510 Blackbird Ln Kissimmee, FL | 3.0 | 2.0 | 1207 | $1,650 | $1.37 | 10d | 1 | 1.07mi |
| 327 Poinciana, FL | 2.0 | 2.0 | 1107 | $1,500 | $1.36 | 24d | 1 | 1.09mi |
| 401 Albatross Ct Unit B Kissimmee, FL | 3.0 | 2.0 | 1200 | $1,650 | $1.38 | 23d | 1 | 1.09mi |
| 504 Blackbird Ln Unit A Kissimmee, FL | 2.0 | 1.5 | 908 | $1,580 | $1.74 | 19d | 1 | 1.10mi |
| 504 Blackbird Ln Kissimmee, FL | 2.0 | 1.5 | 908 | $1,550 | $1.71 | 14d | 1 | 1.10mi |
| 439 Albatross Ct Unit B Kissimmee, FL | 3.0 | 2.0 | 1344 | $1,700 | $1.26 | 23d | 1 | 1.16mi |
| 543 Cardinal Dr Kissimmee, FL | 3.0 | 2.0 | 1007 | $1,860 | $1.85 | 23d | 1 | 1.16mi |
HOA detail
- Monthly dues
- $100 · $1,200/yr
Listing history 26 events
-
2026-06-18days on market $249,900 Active 61 DOM
-
2026-06-17days on market $249,900 Active 60 DOM
-
2026-06-16days on market $249,900 Active 59 DOM
-
2026-06-15days on market $249,900 Active 58 DOM
-
2026-06-13days on market $249,900 Active 56 DOM
-
2026-06-13days on market $249,900 Active 55 DOM
-
2026-06-09days on market $249,900 Active 52 DOM
-
2026-06-08days on market $249,900 Active 51 DOM
-
2026-06-07days on market $249,900 Active 50 DOM
-
2026-06-04days on market $249,900 Active 47 DOM
-
2026-06-03days on market $249,900 Active 46 DOM
-
2026-06-02days on market $249,900 Active 45 DOM
-
2026-06-02days on market $249,900 Active 44 DOM
-
2026-05-31days on market $249,900 Active 43 DOM
-
2026-04-18$249,900 Active
-
2008-10-22soldstatus $70,000 282-char remark
Show marketing remark (282 chars)
This is not a Short Sale. This is a bank owned 3 BR 2 Bath home with a spacious layout, split bedroom plan, large open living room and a breakfast nook. Inside laundry and large fenced in backyard. Seller offering a BONUS to the SELLING AGENT andCLOSING COST CREDIT. BACK ON MARKET!
-
2008-07-02$68,000 282-char remark
Show marketing remark (282 chars)
This is not a Short Sale. This is a bank owned 3 BR 2 Bath home with a spacious layout, split bedroom plan, large open living room and a breakfast nook. Inside laundry and large fenced in backyard. Seller offering a BONUS to the SELLING AGENT andCLOSING COST CREDIT. BACK ON MARKET!
-
2007-07-26historical
-
2007-07-26$158,900
-
2007-03-02$168,900
-
2006-11-28$189,900
-
2006-11-28historical
-
2006-09-01$179,900
-
2004-04-02soldstatus $112,000
-
2000-11-08soldstatus $66,900
-
1991-10-07soldstatus $9,000
ⓘ Source: listings_history table (triggers on properties + properties_extension) + one-shot
backfill from property_details.listing_events for pre-trigger history.
Tax reassessment forecast FL · Resets to sale price
- Current annual tax
- $972 · $81/mo
- Projected year-2 tax
- $2,074 · $173/mo
- Expected delta
- +$1,102/yr (+$92/mo · 113.3%)
ⓘ Screening estimate from a state-policy table — verify with the county assessor before closing.
Climate risk First Street
- Flood 1/10 Low FEMA zone X (unshaded) · 0% chance over 30 yrs
- Wildfire 5/10 Major
- Heat 9/10 Extreme 7 d/yr ≥108°F today · 25 d/yr by 30 yrs out
- Wind 9/10 Extreme 99% chance of damaging wind over 30 yrs
- Air quality 1/10 Low 0 unhealthy d/yr today · 0 by 30 yrs out
Nearby sold comps map
Loading sold comps map…
Walkable amenities ~0.75 mi
Loading nearby amenities…
Taxation est. · year 1
- Rental income
- $22,353
- − Mortgage interest
- −$13,998
- − Property taxes
- −$972
- − Insurance
- −$1,250
- − Repairs & maintenance
- −$1,788
- − Management
- −$1,788
- − HOA
- −$1,200
- − Depreciation
- −$7,270
- Taxable loss
- −$5,914
- Est. tax savings @ 24.0%
- +$1,419
- After-tax cash flow
- $-70/yr
For passive investors: Depreciation is non-cash, so a rental often shows a tax loss while cash-flowing — sheltering income. Rental losses are passive: they offset passive income freely, and up to $25,000/yr can offset ordinary (W-2) income if you actively participate and your MAGI is under $100k (phasing out to $0 by $150k); unused losses carry forward. On sale, claimed depreciation is recaptured at up to 25%, and gains may owe capital-gains tax (a 1031 exchange can defer both). Figures are a year-1 estimate at your 24.0% rate — not tax advice; consult a CPA.
Schools (NCES district)
- District
- Osceola
- NCES district ID
- 1201470
- Math proficiency
- 39% ▼ -9.00%
- Reading proficiency
- 45% ▼ -4.00%
- Median HH income
- $45,528
- Composite
- 35.7/100
- National rank
- #4865
- State rank
- #60 of 73 in FL
Livability — Poinciana
- Score
- 57/100
- State rank
- #859
- US rank
- #21760
Category grades
Schools grade is shown separately in the Schools card above.
Census & demographics
- Census place
- Poinciana, FL
- County
- Polk County · 740,051 people
- City population
- 91,336
- Metro
- Lakeland-Winter Haven, FL
- Population (ZIP)
- 44,568
- Household income
- $69,373
- Rent vs Own
- Severe rent burden
- 1186.0
Population outlook (Osceola County) Hauer SSP2
- Today (2025)
- 447,624 people
- By 2030
- 511,823 · +14.3%
- By 2040
- 642,986 · +43.6%
- By 2050
- 774,552 · +73.0%
- By 2075
- 1,078,144 · +140.9%
- By 2100
- 1,269,660 · +183.6%
Race, ethnicity, and origin ACS 2023
- Neighborhood character
- Diverse neighborhood (Simpson 0.62)
- Race & ethnicity
- Hispanic / Latino 55% White 21% Two or more races 20% Black 19%
- Hispanic origin (detail)
- Mexican 2% Puerto Rican 38% Cuban 6% Dominican 3%
- Common ancestry
- Hispanic 3% Romanian 2% Scotch-Irish 1%
- Foreign-born
- 17% · Canada, Jamaica
- Languages at home
- 49% English-only · Spanish 48% French/Haitian/Cajun 2%
Political lean MEDSL · Osceola
- 2024 margin
- Toss-up / Even · D 48.7% · R 50.2% · Other 1.1%
- 2008→2024 swing
- -21.2pp toward R · 2008: 19.7pp · 2024: -1.4pp
- All cycles
- 2024: R+1.4 2020: D+13.8 2016: D+25.0 2012: D+24.5 2008: D+19.7
Not yet ingested
- Civics
- —
Market trends
- HPI YoY
- ▼ -1.48%
- Current HPI
- 276.6861
- Rent YoY
- ▲ 1.14%
- Metro
- Lakeland-Winter Haven, FL
- State GDP YoY
- ▲ 3.28%
- F500 in state
- 36
Industry mix (Fortune 500 HQ in FL)
| Industry | F500 HQs | Revenue |
|---|---|---|
| Industrial Technology | 2 | $29B |
|
||
| Insurance | 2 | $17B |
|
||
| Retail | 1 | $60B |
|
||
| Technology Distribution | 1 | $58B |
|
||
| Homebuilding | 1 | $35B |
|
||
| Technology Manufacturing | 1 | $35B |
|
||
Price history
+2676.7% since first listed12 events — show timeline
- 2026-04-18 Listed $249,900 Stellar MLS as Distributed by MLS Grid
- 2008-10-22 Sold (MLS) $70,000 Stellar MLS as Distributed by MLS Grid
- 2008-07-02 Listed $68,000 Stellar MLS as Distributed by MLS Grid
- 2007-07-26 Listed $158,900 Stellar MLS as Distributed by MLS Grid
- 2007-07-26 Listing Removed — Stellar MLS as Distributed by MLS Grid
- 2007-03-02 Listed $168,900 Stellar MLS as Distributed by MLS Grid
- 2006-11-28 Listing Removed — Stellar MLS as Distributed by MLS Grid
- 2006-11-28 Listed $189,900 Stellar MLS as Distributed by MLS Grid
- 2006-09-01 Listed $179,900 Stellar MLS as Distributed by MLS Grid
- 2004-04-02 Sold (Public Records) $112,000 Public Records
- 2000-11-08 Sold (Public Records) $66,900 Public Records
- 1991-10-07 Sold (Public Records) $9,000 Public Records
Property tax history
+4.2%/yrLatest (2025): $972 · +10.5% YoY. Source: county tax records.
Cash-flow waterfall
monthlySold comps — $/sqft
last 12 mo · ≤1 miLoading sold comps…