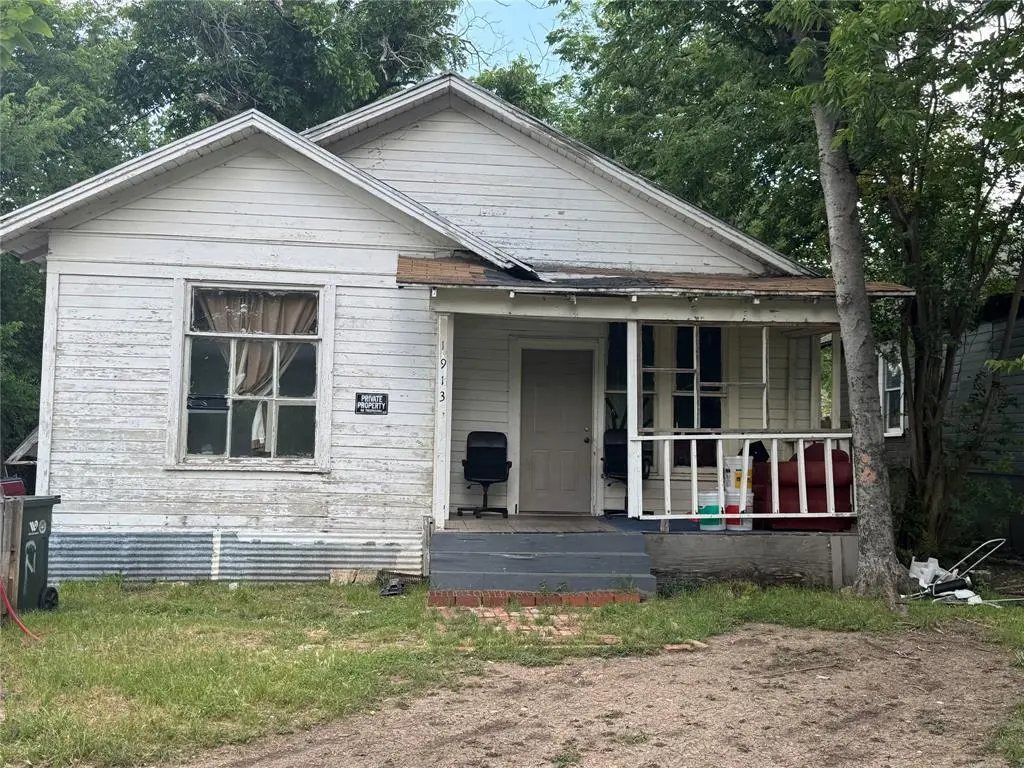
1913 Homan Ave · Waco, TX
Flood risk 1/10 · Minimal
- FEMA flood zone
- X (unshaded)
- Chance of flooding over 30 yrs
- 0.0%
- Est. flood insurance / yr
- $507 – $1,088
Fire risk 1/10 · Minimal
- Est. fire insurance / yr
- $1,222 – $2,270
Heat risk 7/10 · Major
- Hot days now (above 109°F)
- 7 days/yr
- Hot days in 30 yrs
- 22 days/yr
Wind risk 6/10 · Moderate
- Chance of severe wind over 30 yrs
- 59.0%
Air-quality risk 2/10 · Minimal
- Unhealthy air days now
- 0 days/yr
- Unhealthy air days in 30 yrs
- 1 days/yr
Risk factors via First Street. Map © Google.
Why this score? — see what drove the B- grade
The composite is a weighted blend of 9 inputs, each scored 0–100. Each bar is that input's sub-score; the figure is the points it added to the 100-point composite (weight × sub-score).
- Cash flow +30.0/30.0
- 1% rule +10.0/10.0
- DSCR +10.0/10.0
- ARV discount +7.5/15.0
- Livability +3.7/5.0
- Rent growth +2.8/5.0
- Condition / age +2.5/5.0
- Schools +1.8/10.0
- Appreciation +0.0/10.0
$89,000
🖨 Deal sheet 📄 Offer letter ✓ Due diligence
Listing remarks
You’ve found your next investment opportunity in the heart of North Waco’s sought-after Sanger Heights neighborhood on Homan Avenue. Built in 1917, this 1,193 square foot bungalow is full of potential and ready for your vision to bring it back to life. Classic early-1900s character, mature neighborhood charm, and strong upside make this the perfect fix-and-flip or long-term investment property. Step inside and imagine the possibilities to restore the historic appeal while incorporating modern updates today’s buyers love. With the right renovations, this property could truly shine and become a standout home in one of Waco’s established neighborhoods. Whether you&rsquo
Key facts
- Modern updates
- Historic appeal
- Rehab project
Tags
Property features AI
Finance
- Other: Parcel: 480340000025009; Lot described as less than 0.5 acre
- Financial info: Listing terms: Cash; No second mortgage reported
- HOA & community: No association
Exterior
- Parking: Off-street parking (no covered or carport spaces listed)
- Utilities: City water; City sewer; Electricity available; Not in a municipal utility district
- Home design: Single-family residence; Residential property; Built in 1917; Provident subdivision
- Construction: Composition/shingle roof; Originally constructed in 1917
- Exterior features: Off-street parking
Interior
- Kitchen: Electric range
- Bedrooms: Primary bedroom (1st level) — 10 x 12
- Flooring: Laminate; Linoleum; Tile; Varies
- Bathrooms: 1 full bathroom
- Heating & cooling: Ceiling fan(s); No heating system listed
- Interior features: One-level layout; Built-in cabinets in living room; Fireplace in living room; Other interior features
- Laundry & utility: Washer hookup
Neighborhood map
What this means for you Summary
Snapshot
- This is a 3-bed/1.0-bath single-family listed at $89k.
Deal economics
- At list price, monthly cash flow is $509 ($6k/yr) — positive.
- The deal already cash-flows at list — no discount required.
- Meets the 1% rule at list price ($1k rent vs $89k).
- Recommended offer: $88k (1.5% below list) — sets the bar for market timing.
- Cap rate 13.2% vs local median 3.9% in Waco — top-decile yield for the area; either an underpriced asset or a hidden risk that comps aren't pricing in. Stress-test before assuming the spread holds.
Location & tenants
- Location reads 74/100 on livability (#166 in TX, #4,378 nationally) — a middle-class / working-renter tenant base. Strengths: cost of living A+, housing A+, health & safety A+; Watch: crime D, commute F, employment D-.
- Waco ISD (urban): math 20% / reading 24% proficiency, ranked #773 of 826 in TX (top 94%) — low school quality limits family demand, transient renter base, plan for 1-2y turnover; 81% free/reduced lunch — lower-income household profile, screen leases tightly.
- Zoned schools: West Avenue El (math 17% / reading 22%, grade F, #3,583 of 4,322 statewide, top 86%, 289 students, 96% FRL).
- Market conditions: Rents rising (+1.1%/yr); 144 active listings in the ZIP; 40 comparable units currently listed for rent nearby; rentals at typical pace (median 21d on market — plan ~3-4 weeks tenant-placement turnaround); lower-income renter base — watch delinquency; 1,014 units permitted in McLennan County in 2024 (200 in 5+ unit buildings).
- This rent runs 44% of the median local income ($40k/yr) — at the standard rent-burdened threshold; future hikes will face affordability resistance.
Forward outlook
- Local home prices are declining (-3.0%/yr); year-one equity from $615 of loan paydown is wiped out by about $3k of value loss. Plan a longer hold.
- McLennan County population projected at +17% by 2050 — long-run rental-demand tailwind backs the buy-and-hold thesis.
- At projected returns (-3.0% appreciation + 1.1% rent growth), your $25k cash investment doubles in ~6 years — after that, you're playing with house money.
Negotiation context
- It's been on market 23 days — a 2% lower offer ($88k) is reasonable based on typical stale-listing flexibility.
Risks & watch-outs
- Watch-outs: built in 1917 — expect roof / HVAC / electrical / plumbing capex.
- Climate carrying-cost: major wind risk, 59% chance of damaging wind over 30y; extreme-heat days projected 7→22/yr by 2055 (HVAC capex compounding) — expect insurance premiums to compound above CPI over the hold.
Questions for the listing agent
- Built in 1917 — when were the roof, HVAC, electrical panel, plumbing, and water heater last replaced?
- Is there a deadline driving the sale (1031 exchange, divorce, estate, relocation)? That informs how much negotiation room exists.
- Schools are D-rated, which usually means shorter tenancies and higher turnover. Who's the typical renter profile here, and what's been the actual vacancy rate?
- Crime grade is D in this area — have there been break-ins, vandalism, or insurance claims at this property in the last 3 years? What carrier currently insures it and at what premium?
- What's the average days-on-market for RENTAL listings here right now (not sales)? A rising rental-DOM trend means longer vacancies and softer asking-rent achievability than the comps imply.
- What's the recent tenant-quality profile in this submarket — average credit score on applications, eviction rate, late-payment / NSF rate, and stable-employment percentage? A property-management company in the area should have these aggregated.
- How much new for-sale + rental construction is in the pipeline within 1–3 miles? Heavy new supply typically softens prices + rents 12–24 months out; constrained supply supports both.
Investment metrics
- 1% rule
- 1.67% ✓
- Cap rate
- 13.15%
- Cash-on-cash
- 24.49%
- DSCR
- 2.09
- GRM
- 5.0
CMA / ARV
- ARV (on-the-fly)
- $195,652
- Comps found
- 12
Show comp detail 12 sales within ~0.75 mi
| Address | Dist | Beds/Ba | Sqft | Sold | Price | $/sf | Match |
|---|---|---|---|---|---|---|---|
| 912 N 22nd St | 0.35mi | 3/2.0 | 1,168 (-2%) | 2mo | $199,999 | $171 | 75 |
| 1901 Algonquin St | 0.24mi | 3/2.0 | 1,176 (-1%) | 10mo | $248,000 | $211 | 74 |
| 2013 Homan Ave | 0.07mi | 3/1.0 | 1,064 (-11%) | 6mo | $175,000 | $164 | 74 |
| 900 N 16th St | 0.32mi | 3/1.0 | 1,239 (+4%) | 9mo | $135,000 | $109 | 71 |
| 1521 Homan Ave | 0.30mi | 3/2.0 | 1,256 (+5%) | 4mo | $169,900 | $135 | 70 |
| 2110 Gorman Ave | 0.35mi | 3/2.0 | 1,252 (+5%) | 4mo | $214,999 | $172 | 68 |
| 1123 N 14th St | 0.46mi | 3/1.0 | 1,272 (+7%) | 1mo | $40,000 | $31 | 66 |
| 2319 Parrot | 0.41mi | 2/2.0 (-1) | 1,152 (-3%) | 0mo | $75,000 | $65 | 66 |
| 2015 Gorman Ave | 0.28mi | 2/1.0 (-1) | 1,320 (+11%) | 0mo | $140,000 | $106 | 64 |
| 2620 Lasker Ave | 0.63mi | 2/2.0 (-1) | 1,200 (+1%) | 4mo | $220,000 | $183 | 58 |
| 2805 Parrott Ave | 0.72mi | 3/2.0 | 1,236 (+4%) | 3mo | $190,000 | $154 | 54 |
| 1113 N 10th St | 0.72mi | 3/2.0 | 1,028 (-14%) | 1mo | $199,000 | $194 | 39 |
Match score weights: distance 35% · size 25% · config 20% · recency 20%. Top-matched comps best support the ARV.
Projected returns pro-forma
-3.0% appreciation · 1.14% rent growth · sell at horizon
- IRR
- 15.7%
- Equity multiple
- 1.61×
- Total profit
- $15,300
- Equity at exit
- $13,270
- IRR
- 22.8%
- Equity multiple
- 2.78×
- Total profit
- $44,475
- Equity at exit
- $7,695
Cash invested: $24,920 (down + closing). Projections, not guarantees.
Landlord ↔ Tenant lean methodology
- Overall (STATE)
- 87 Strongly Landlord-Friendly
- State Texas
- 87 Strongly Landlord-Friendly · R+5
- County
- — inherits STATE
- City
- — inherits STATE
ZIP-level market 76707
- Rents YoY
- 1.1%
- Active inventory
- 144
- Price-to-rent
- 5.0×
Monthly cashflow live
- Estimated rent
- $1,483 high interval (Pro) →
- Mortgage (P&I)
- −$467
- Tax from tax record
- −$159 /mo · $1,913/yr
- Insurance
- −$37
- HOA
- −$0
- Vacancy / Maint / Mgmt
- −$312
- Net cashflow
- $509
Break-even live
UW: 25.0% down · 7.5% · 30yr · 1.5% tax · 5.0% vac · 8.0% maint · 8.0% mgmt
Financing live
Cash to close
- Down payment
- $22,250
- Closing costs
- $2,670
- Reserves months
- —
- Total cash needed
- —
Loan-product check · same deal, 3 products live
Conventional
25% down · 7.5% · 30yr
- Down + closing
- —
- Monthly P&I
- —
- Monthly cashflow
- —
- DSCR
- —
- Eligible?
- —
Personal DTI + credit; lowest rate.
DSCR
20% down · 8.5% · 30yr
- Down + closing
- —
- Monthly P&I
- —
- Monthly cashflow
- —
- DSCR
- —
- Eligible?
- —
No personal income docs; deal must DSCR.
Hard money
10% down · 12.0% · 12mo
- Down + closing
- —
- Monthly P&I
- —
- Monthly cashflow
- —
- DSCR
- —
- Eligible?
- —
Short-term bridge; refi at stabilization.
Rent comps 40 comps
| Address | Beds | Baths | Sqft | Rent | $/sqft | DOM | Units | Dist |
|---|---|---|---|---|---|---|---|---|
| 1821 Algonquin St Waco, TX | 2.0 | 1.0 | 930 | $1,150 | $1.24 | 43d | 1 | 0.26mi |
| 1815 Seneca Ave Waco, TX | 3.0 | 2.0 | 1471 | $1,650 | $1.12 | 21d | 1 | 0.33mi |
| 2511 Parrott Ave Waco, TX | 3.0 | 2.0 | 1463 | $1,695 | $1.16 | 43d | 1 | 0.50mi |
| 2225 Trice Ave Waco, TX | 2.0 | 1.0 | 803 | $1,300 | $1.62 | 13d | 1 | 0.50mi |
| 2225 Trice Ave Waco, TX | 2.0 | 1.0 | 803 | $1,300 | $1.62 | 43d | 1 | 0.50mi |
| 615 N 23rd St Waco, TX | 2.0 | 1.0 | 900 | $1,275 | $1.42 | 21d | 1 | 0.54mi |
| 608 N 23rd St Waco, TX | 3.0 | 1.0 | 1361 | $1,695 | $1.25 | 21d | 1 | 0.56mi |
| 2632 Colonial Ave Unit B Waco, TX | 2.0 | 1.0 | 896 | $1,050 | $1.17 | 21d | 1 | 0.58mi |
| 1825 Cumberland Ave Waco, TX | 3.0 | 1.0 | 1400 | $1,325 | $0.95 | 13d | 1 | 0.58mi |
| 1216 Tennessee Ave Unit B Waco, TX | 3.0 | 2.0 | 872 | $1,350 | $1.55 | 21d | 1 | 0.58mi |
| 1216 Tennessee Ave Waco, TX | 3.0 | 2.0 | 872 | $1,250 | $1.43 | 21d | 1 | 0.58mi |
| 2705 Bosque Blvd Waco, TX | 3.0 | 2.0 | 1028 | $1,599 | $1.56 | 43d | 1 | 0.58mi |
| 1511 Maple Ave Waco, TX | 3.0 | 2.0 | 1487 | $1,450 | $0.98 | 43d | 1 | 0.60mi |
| 2224 Cumberland Ave Waco, TX | 2.0 | 1.0 | 768 | $1,075 | $1.40 | 43d | 1 | 0.62mi |
| 1920 Windsor Ave Waco, TX | 3.0 | 1.0 | 1216 | $1,200 | $0.99 | 43d | 1 | 0.63mi |
| 2000 Windsor Ave Waco, TX | 4.0 | 2.5 | 1450 | $1,800 | $1.24 | 43d | 1 | 0.63mi |
| 1818 Windsor Ave Waco, TX | 4.0 | 2.0 | 1112 | $1,625 | $1.46 | 21d | 1 | 0.63mi |
| 716 N 13th St Waco, TX | 4.0 | 2.0 | 1349 | $1,675 | $1.24 | 21d | 1 | 0.63mi |
| 2724 Bosque Blvd Waco, TX | 2.0 | 1.0 | 1120 | $1,100 | $0.98 | 21d | 1 | 0.63mi |
| 1110 N 11th St Waco, TX | 3.0 | 2.0 | 1172 | $1,495 | $1.28 | 21d | 1 | 0.66mi |
| 1600 N 11th St Unit A Waco, TX | 3.0 | 2.0 | 1217 | $1,750 | $1.44 | 43d | 1 | 0.66mi |
| 1104 N 11th St Waco, TX | 3.0 | 2.0 | 1231 | $1,650 | $1.34 | 21d | 1 | 0.66mi |
| 804 N 11th St Waco, TX | 1.0–2.0 | 1.0 | 838 | $1,200 | $1.43 | 21d | 1 | 0.72mi |
| 2225 Windsor Ave Waco, TX | 2.0 | 1.0 | 840 | $1,100 | $1.31 | 43d | 1 | 0.72mi |
| 2601 Fort Ave Unit 4 Waco, TX | 2.0 | 1.0 | 1000 | $990 | $0.99 | 43d | 1 | 0.73mi |
| 2714 Morrow Ave Waco, TX | 2.0 | 1.0 | 1484 | $1,375 | $0.93 | 21d | 1 | 0.75mi |
| 1923 Austin Ave Unit 5202 Waco, TX | 2.0 | 2.5 | 1265 | $1,395 | $1.10 | 21d | 1 | 0.82mi |
| 3007 Parrott Ave Unit 1 Waco, TX | 3.0 | 2.0 | 1458 | $1,650 | $1.13 | 21d | 1 | 0.83mi |
| 1606 N 9th St Waco, TX | 4.0 | 2.0 | 1392 | $1,525 | $1.10 | 21d | 1 | 0.83mi |
| 718 Garland Ave Unit b Waco, TX | 3.0 | 1.0 | 838 | $985 | $1.18 | 13d | 1 | 0.84mi |
| 2300 Washington Ave Waco, TX | 3.0 | 1.0 | 1232 | $1,650 | $1.34 | 13d | 1 | 0.85mi |
| 2621 Windsor Ave Waco, TX | 2.0 | 1.0 | 1108 | $1,175 | $1.06 | 21d | 1 | 0.85mi |
| 2714 Windsor Ave Waco, TX | 2.0 | 1.0 | 979 | $1,300 | $1.33 | 43d | 1 | 0.87mi |
| 3121 Colonial Ave Waco, TX | 3.0 | 2.0 | 1085 | $1,600 | $1.47 | 43d | 1 | 0.94mi |
| 3121 Colonial Ave Waco, TX | 3.0 | 2.0 | 1085 | $1,600 | $1.47 | 21d | 1 | 0.94mi |
| 3116 Bosque Blvd Waco, TX | 2.0 | 1.0 | 1100 | $1,250 | $1.14 | 13d | 1 | 0.95mi |
| 712 Proctor Ave Waco, TX | 4.0 | 2.0 | 1184 | $1,450 | $1.22 | 21d | 1 | 1.03mi |
| 3400 W Brookview Dr Waco, TX | 1.0–2.0 | 1.0 | 865 | $1,209 | $1.40 | 13d | 5 | 1.05mi |
| 2121 Lyle Ave Waco, TX | 2.0 | 1.0 | 1080 | $1,000 | $0.93 | 13d | 1 | 1.07mi |
| 2601 Herring Ave Unit 1 Waco, TX | 3.0 | 1.0 | 989 | $1,295 | $1.31 | 43d | 1 | 1.10mi |
Listing history 18 events
-
2026-06-18days on market $89,000 Active 23 DOM
-
2026-06-17days on market $89,000 Active 22 DOM
-
2026-06-16days on market $89,000 Active 21 DOM
-
2026-06-15days on market $89,000 Active 20 DOM
-
2026-06-14pricedays on market $89,000 Active 18 DOM
-
2026-06-13days on market $92,900 Active 17 DOM
-
2026-06-10days on market $92,900 Active 15 DOM
-
2026-06-09days on market $92,900 Active 14 DOM
-
2026-06-08days on market $92,900 Active 13 DOM
-
2026-06-07pricedays on market $92,900 Active 12 DOM
-
2026-06-05days on market $99,000 Active 9 DOM
-
2026-06-03days on market $99,000 Active 8 DOM
-
2026-06-02days on market $99,000 Active 7 DOM
-
2026-06-01days on market $99,000 Active 6 DOM
-
2026-05-31days on market $99,000 Active 5 DOM
-
2026-05-30days on market $99,000 Active 4 DOM
-
2026-05-26$99,000 Active
-
2007-09-25soldstatus
ⓘ Source: listings_history table (triggers on properties + properties_extension) + one-shot
backfill from property_details.listing_events for pre-trigger history.
Tax reassessment forecast TX · Resets to sale price
- Current annual tax
- $1,913 · $159/mo
- Projected year-2 tax
- $1,913 · $159/mo
- Expected delta
- $0/yr ($0/mo · 0.0%)
ⓘ Screening estimate from a state-policy table — verify with the county assessor before closing.
Climate risk First Street
- Flood 1/10 Low FEMA zone X (unshaded) · 0% chance over 30 yrs
- Wildfire 1/10 Low
- Heat 7/10 Severe 7 d/yr ≥109°F today · 22 d/yr by 30 yrs out
- Wind 6/10 Major 59% chance of damaging wind over 30 yrs
- Air quality 2/10 Low 0 unhealthy d/yr today · 1 by 30 yrs out
Nearby sold comps map
Loading sold comps map…
Walkable amenities ~0.75 mi
Loading nearby amenities…
Taxation est. · year 1
- Rental income
- $17,801
- − Mortgage interest
- −$4,985
- − Property taxes
- −$1,913
- − Insurance
- −$445
- − Repairs & maintenance
- −$1,424
- − Management
- −$1,424
- − Depreciation
- −$2,589
- Taxable income
- $5,020
- Est. tax owed @ 24.0%
- −$1,205
- After-tax cash flow
- $4,899/yr
For passive investors: Depreciation is non-cash, so a rental often shows a tax loss while cash-flowing — sheltering income. Rental losses are passive: they offset passive income freely, and up to $25,000/yr can offset ordinary (W-2) income if you actively participate and your MAGI is under $100k (phasing out to $0 by $150k); unused losses carry forward. On sale, claimed depreciation is recaptured at up to 25%, and gains may owe capital-gains tax (a 1031 exchange can defer both). Figures are a year-1 estimate at your 24.0% rate — not tax advice; consult a CPA.
Schools (NCES district)
- District
- Waco ISD
- NCES district ID
- 4844280
- Math proficiency
- 20% ▼ -14.00%
- Reading proficiency
- 24% ▼ -6.00%
- Median HH income
- $29,208
- Composite
- 17.57/100
- National rank
- #9043
- State rank
- #773 of 826 in TX
Livability — Waco
- Score
- 74/100
- State rank
- #166
- US rank
- #4378
Category grades
Schools grade is shown separately in the Schools card above.
Census & demographics
- Census place
- Waco, TX
- County
- McLennan County · 213,088 people
- City population
- 125,319
- Metro
- Waco, TX
- Population (ZIP)
- 15,879
- Household income
- $40,443
- Rent vs Own
- Severe rent burden
- 704.0
Population outlook (McLennan County) Hauer SSP2
- Today (2025)
- 264,191 people
- By 2030
- 273,578 · +3.6%
- By 2040
- 291,506 · +10.3%
- By 2050
- 308,044 · +16.6%
- By 2075
- 349,648 · +32.3%
- By 2100
- 364,779 · +38.1%
Race, ethnicity, and origin ACS 2023
- Neighborhood character
- Diverse neighborhood (Simpson 0.64)
- Race & ethnicity
- Hispanic / Latino 47% Black 32% Two or more races 26% White 18%
- Hispanic origin (detail)
- Mexican 43%
- Common ancestry
- Romanian 1% Lithuanian 1% Italian 1%
- Foreign-born
- 15% · Canada
- Languages at home
- 65% English-only · Spanish 34% Tagalog/Filipino 1%
Political lean MEDSL · McLennan
- 2024 margin
- Solid R (+30.9) · D 34.0% · R 64.9% · Other 1.0%
- 2008→2024 swing
- -7.0pp toward R · 2008: -23.9pp · 2024: -30.9pp
- All cycles
- 2024: R+30.9 2020: R+23.4 2016: R+27.1 2012: R+29.8 2008: R+23.9
Not yet ingested
- Civics
- —
Market trends
- HPI YoY
- ▼ -134.95%
- Current HPI
- 239.639
- Rent YoY
- ▲ 1.14%
- Metro
- Waco, TX
- State GDP YoY
- ▲ 3.95%
- F500 in state
- 110
Industry mix (Fortune 500 HQ in TX)
| Industry | F500 HQs | Revenue |
|---|---|---|
| Energy | 16 | $1,198B |
|
||
| Technology | 5 | $198B |
|
||
| Engineering / Construction | 4 | $72B |
|
||
| Energy Services | 3 | $60B |
|
||
| Utilities | 3 | $41B |
|
||
| Healthcare | 2 | $330B |
|
||
Price history
2 events — show timeline
- 2026-05-26 Listed $99,000 NTREIS
- 2007-09-25 Sold (Public Records) — Public Records
Property tax history
+7.8%/yrLatest (2025): $1,913 · -3.7% YoY. Source: county tax records.
Cash-flow waterfall
monthlySold comps — $/sqft
last 12 mo · ≤1 miLoading sold comps…