12482 NY RT 38 B · Newark Valley, NY
Flood risk No data
- FEMA flood zone
- —
- Chance of flooding over 30 yrs
- —
- Est. flood insurance / yr
- —
Fire risk No data
- Est. fire insurance / yr
- —
Heat risk No data
- Hot days now (above threshold)
- —
- Hot days in 30 yrs
- —
Wind risk No data
- Chance of severe wind over 30 yrs
- —
Air-quality risk No data
- Unhealthy air days now
- —
- Unhealthy air days in 30 yrs
- —
Risk factors via First Street. Map © Google.
Why this score? — see what drove the B+ grade
The composite is a weighted blend of 9 inputs, each scored 0–100. Each bar is that input's sub-score; the figure is the points it added to the 100-point composite (weight × sub-score).
- Cash flow +30.0/30.0
- 1% rule +10.0/10.0
- DSCR +10.0/10.0
- Appreciation +10.0/10.0
- ARV discount +7.5/15.0
- Schools +3.8/10.0
- Livability +3.5/5.0
- Rent growth +2.5/5.0
- Condition / age +1.0/5.0
$75,000
🖨 Deal sheet 📄 Offer letter ✓ Due diligence
Listing remarks
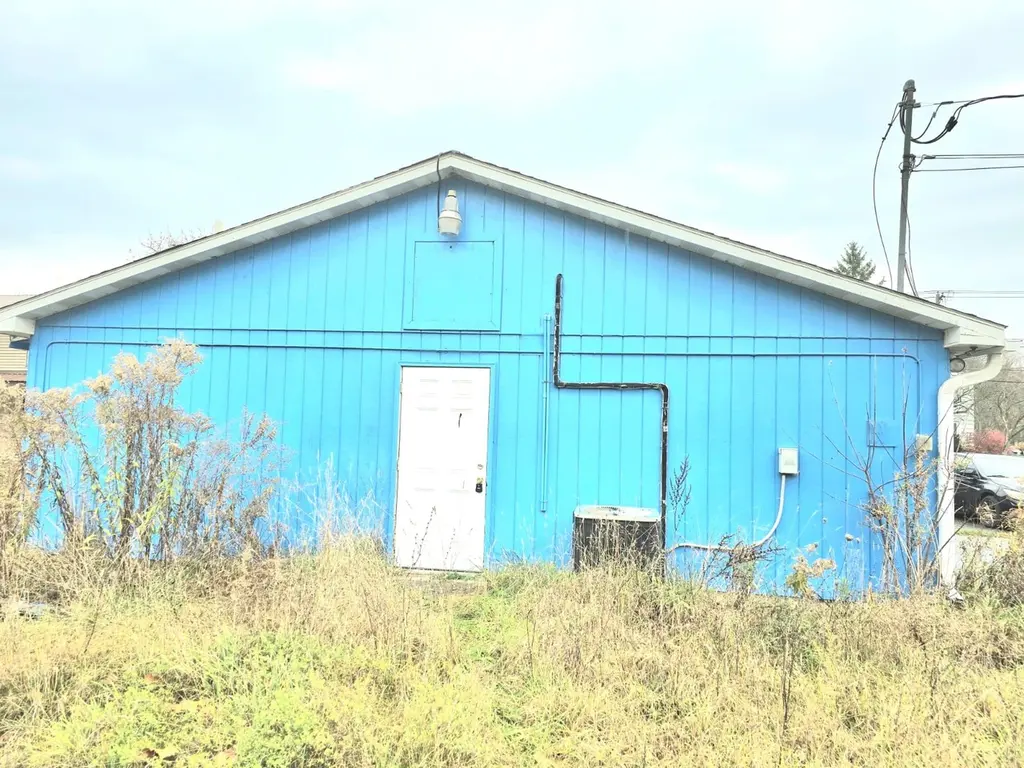
unique property opportunity. This site previously operated as a gas station with a convenience store and food service facilities. The property offers significant flexibility; it can continue to be used as a gas station, smoke shop, or restaurant. Alternatively, there is the opportunity to design and convert the interior into a custom residence. Please note that all existing equipment will remain on-site as is.
Key facts
- Custom residence
- 0.45 acre lot
- Built 1990
Tags
Property features AI
Finance
- Other: Approximately 2,150 above-grade finished area (listed figure); Property type listed as Residential
Exterior
- Utilities: Well water; Septic tank; Cable available
- Home design: Single-family residence; Single story
- Construction: Vinyl siding; Slab foundation; Built on 1 story
- Exterior features: Garden; Level lot
Interior
- Flooring: Brick; Tile
- Bathrooms: 1 full bathroom; 1 half bathroom
- Heating & cooling: Forced air heating
- Interior features: Electric water heater; Brick and tile flooring
Neighborhood map
What this means for you Summary
Snapshot
- This is a 3-bed/1.5-bath single-family listed at $75k. Condition is rated poor.
Deal economics
- At list price, monthly cash flow is $639 ($8k/yr) — positive.
- The deal already cash-flows at list — no discount required.
- Meets the 1% rule at list price ($1k rent vs $75k).
- Recommended offer: $73k (3.0% below list) — sets the bar for market timing.
Location & tenants
- Location reads 70/100 on livability (#462 in NY) — a middle-class / working-renter tenant base. Strengths: cost of living A+, housing A+, employment B; Watch: health & safety D, crime F, amenities F.
- Newark Valley Central School District (rural): math 37% / reading 51% proficiency, ranked #466 of 590 in NY (top 79%) — families likely to look elsewhere, expect single-tenant / working-renter base with shorter leases.
- Zoned schools: Nathan T Hall School (math 37% / reading 47%, grade F, #1,361 of 2,108 statewide, top 67%, 322 students, 50% FRL).
- Market conditions: 11 active listings in the ZIP; 139 units permitted in Tioga County in 2024 (65 in 5+ unit buildings).
Forward outlook
- In year one you build about $8k of equity ($519 loan paydown + $8k appreciation (10.0% local appreciation)).
- Tioga County population projected at -27% by 2050 — secular population decline; favor cash flow + early exit over multi-decade hold.
- At projected returns (10.0% appreciation + 3.0% rent growth), your $21k cash investment doubles in ~2 years — after that, you're playing with house money.
- By year 5, paydown + projected appreciation supports a ~$37k cash-out refi (75% LTV) — recoverable capital for the next deal without selling this one.
Negotiation context
- It's been on market 55 days — a 3% lower offer ($73k) is reasonable based on typical stale-listing flexibility.
Questions for the listing agent
- It's been on market 55 days. Have you received any prior offers? Is the seller open to a 3% concession, seller financing, or rate buy-down credit?
- Have any recent inspections been done? Can we get a copy of the seller's disclosures and any deferred-maintenance estimates?
- Is there a deadline driving the sale (1031 exchange, divorce, estate, relocation)? That informs how much negotiation room exists.
- Crime grade is F in this area — have there been break-ins, vandalism, or insurance claims at this property in the last 3 years? What carrier currently insures it and at what premium?
- What's the average days-on-market for RENTAL listings here right now (not sales)? A rising rental-DOM trend means longer vacancies and softer asking-rent achievability than the comps imply.
- What's the recent tenant-quality profile in this submarket — average credit score on applications, eviction rate, late-payment / NSF rate, and stable-employment percentage? A property-management company in the area should have these aggregated.
- How much new for-sale + rental construction is in the pipeline within 1–3 miles? Heavy new supply typically softens prices + rents 12–24 months out; constrained supply supports both.
Investment metrics
- 1% rule
- 1.95% ✓
- Cap rate
- 16.52%
- Cash-on-cash
- 36.53%
- DSCR
- 2.63
- GRM
- 4.3
CMA / ARV
- ARV (median comp)
- $383,651
- List price
- $75,000
- Delta
- -80.45%
- Verdict
- UNDERPRICED
- Comps
- 5 within 2.0 mi
Projected returns pro-forma
10.0% appreciation · 3.0% rent growth · sell at horizon
- IRR
- 52.4%
- Equity multiple
- 4.89×
- Total profit
- $81,587
- Equity at exit
- $67,566
- IRR
- 46.0%
- Equity multiple
- 10.92×
- Total profit
- $208,284
- Equity at exit
- $145,709
Cash invested: $21,000 (down + closing). Projections, not guarantees.
Landlord ↔ Tenant lean methodology
- Overall (STATE)
- 15 Strongly Tenant-Friendly
- State New York
- 15 Strongly Tenant-Friendly · D+10
- County
- — inherits STATE
- City
- — inherits STATE
ZIP-level market 13736
- Home prices YoY
- 3.5%
- Active inventory
- 11
- Price-to-rent
- 4.3×
Monthly cashflow live
- Estimated rent
- $1,465 medium interval (Pro) →
- Mortgage (P&I)
- −$393
- Tax est. 1.5%
- −$94 /mo · $1,125/yr
- Insurance
- −$31
- HOA
- −$0
- Vacancy / Maint / Mgmt
- −$308
- Net cashflow
- $639
Break-even live
UW: 25.0% down · 7.5% · 30yr · 1.5% tax · 5.0% vac · 8.0% maint · 8.0% mgmt
Financing live
Cash to close
- Down payment
- $18,750
- Closing costs
- $2,250
- Reserves months
- —
- Total cash needed
- —
Loan-product check · same deal, 3 products live
Conventional
25% down · 7.5% · 30yr
- Down + closing
- —
- Monthly P&I
- —
- Monthly cashflow
- —
- DSCR
- —
- Eligible?
- —
Personal DTI + credit; lowest rate.
DSCR
20% down · 8.5% · 30yr
- Down + closing
- —
- Monthly P&I
- —
- Monthly cashflow
- —
- DSCR
- —
- Eligible?
- —
No personal income docs; deal must DSCR.
Hard money
10% down · 12.0% · 12mo
- Down + closing
- —
- Monthly P&I
- —
- Monthly cashflow
- —
- DSCR
- —
- Eligible?
- —
Short-term bridge; refi at stabilization.
Listing history 17 events
-
2026-06-19days on market $75,000 Active 55 DOM
-
2026-06-18days on market $75,000 Active 54 DOM
-
2026-06-17days on market $75,000 Active 53 DOM
-
2026-06-16days on market $75,000 Active 52 DOM
-
2026-06-15days on market $75,000 Active 51 DOM
-
2026-06-14days on market $75,000 Active 49 DOM
-
2026-06-13days on market $75,000 Active 48 DOM
-
2026-06-10days on market $75,000 Active 46 DOM
-
2026-06-09days on market $75,000 Active 45 DOM
-
2026-06-08days on market $75,000 Active 44 DOM
-
2026-06-07days on market $75,000 Active 43 DOM
-
2026-06-03days on market $75,000 Active 39 DOM
-
2026-06-02days on market $75,000 Active 38 DOM
-
2026-06-01days on market $75,000 Active 37 DOM
-
2026-05-31days on market $75,000 Active 36 DOM
-
2026-05-30days on market $75,000 Active 35 DOM
-
2026-04-26$75,000 Active 413-char remark
ⓘ Source: listings_history table (triggers on properties + properties_extension) + one-shot
backfill from property_details.listing_events for pre-trigger history.
Nearby sold comps map
Loading sold comps map…
Walkable amenities ~0.75 mi
Loading nearby amenities…
Taxation est. · year 1
- Rental income
- $17,584
- − Mortgage interest
- −$4,201
- − Property taxes
- −$1,125
- − Insurance
- −$375
- − Repairs & maintenance
- −$1,407
- − Management
- −$1,407
- − Depreciation
- −$2,182
- Taxable income
- $6,888
- Est. tax owed @ 24.0%
- −$1,653
- After-tax cash flow
- $6,019/yr
For passive investors: Depreciation is non-cash, so a rental often shows a tax loss while cash-flowing — sheltering income. Rental losses are passive: they offset passive income freely, and up to $25,000/yr can offset ordinary (W-2) income if you actively participate and your MAGI is under $100k (phasing out to $0 by $150k); unused losses carry forward. On sale, claimed depreciation is recaptured at up to 25%, and gains may owe capital-gains tax (a 1031 exchange can defer both). Figures are a year-1 estimate at your 24.0% rate — not tax advice; consult a CPA.
Condition & rehab AI · 7 photos
This property requires extensive repairs and maintenance to become habitable. Immediate attention to structural issues and landscaping is crucial for safety and value.
Repairs flagged
- Major Exposed plumbing in kitchen — Structural damage
- Major Exposed plumbing in bathroom — Structural damage
- Major Exposed ductwork in HVAC — Structural damage
- Major Overgrown vegetation — Safety hazard
Value-add opportunities
- Both Painting and landscaping — Enhances curb appeal and interior aesthetics
- Both Structural repairs — Improves safety and functionality
- Both Refrigeration and HVAC systems — Enhances comfort and energy efficiency
Renovation cost estimate screening
| Repair item | Severity | Est. cost |
|---|---|---|
| Exposed plumbing in kitchen · Structural damage | Major | $15,000–50,000 |
| Exposed plumbing in bathroom · Structural damage | Major | $15,000–50,000 |
| Exposed ductwork in HVAC · Structural damage | Major | $15,000–50,000 |
| Overgrown vegetation · Safety hazard | Major | $15,000–50,000 |
| Total estimated repair cost · 4 items | $60,000–200,000 |
Value-add ROI direction
- Both Painting and landscaping — Enhances curb appeal and interior aesthetics ↑
- Both Structural repairs — Improves safety and functionality ↑
- Both Refrigeration and HVAC systems — Enhances comfort and energy efficiency ↑
ⓘ Cost ranges are severity-bucket heuristics (US national rule-of-thumb). Get contractor quotes + a written scope before underwriting a rehab budget.
Schools (NCES district)
- District
- Newark Valley Central School District
- NCES district ID
- 3620670
- Math proficiency
- 37% ▼ -10.00%
- Reading proficiency
- 51% ▲ 9.00%
- Median HH income
- $53,770
- Composite
- 38.12/100
- National rank
- #4273
- State rank
- #466 of 590 in NY
Livability — Newark Valley
- Score
- 70/100
- State rank
- #462
- US rank
- #8031
Category grades
Schools grade is shown separately in the Schools card above.
Census & demographics
- Population (ZIP)
- 1,887
Population outlook (Tioga County) Hauer SSP2
- Today (2025)
- 45,155 people
- By 2030
- 42,801 · -5.2%
- By 2040
- 37,960 · -15.9%
- By 2050
- 33,071 · -26.8%
- By 2075
- 24,144 · -46.5%
- By 2100
- 16,545 · -63.4%
Race, ethnicity, and origin ACS 2023
- Neighborhood character
- Predominantly White (95%)
- Race & ethnicity
- White 95% Two or more races 3% Hispanic / Latino 1%
- Common ancestry
- Romanian 4% Slovak 3% Italian 2%
- Foreign-born
- 1%
- Languages at home
- 98% English-only · Spanish 1%
Political lean MEDSL · Tioga
- 2024 margin
- Strong R (+22.9) · D 38.6% · R 61.4%
- 2008→2024 swing
- -12.7pp toward R · 2008: -10.2pp · 2024: -22.9pp
- All cycles
- 2024: R+22.9 2020: R+20.6 2016: R+27.6 2012: R+15.1 2008: R+10.2
Not yet ingested
- Civics
- —
Market trends
- HPI YoY
- ▲ 10.36%
- Current HPI
- 304.4569
- Rent YoY
- —
- Metro
- —
- State GDP YoY
- ▲ 2.60%
- F500 in state
- 92
Industry mix (Fortune 500 HQ in NY)
| Industry | F500 HQs | Revenue |
|---|---|---|
| Financial Services | 10 | $950B |
|
||
| Consumer Goods | 9 | $162B |
|
||
| Insurance | 4 | $225B |
|
||
| Telecommunications | 2 | $144B |
|
||
| Pharmaceuticals | 2 | $112B |
|
||
| Media / Entertainment | 2 | $69B |
|
||
Price history
1 event — show timeline
- 2026-04-26 Listed $75,000 GBAOR
Cash-flow waterfall
monthlySold comps — $/sqft
last 12 mo · ≤1 miLoading sold comps…