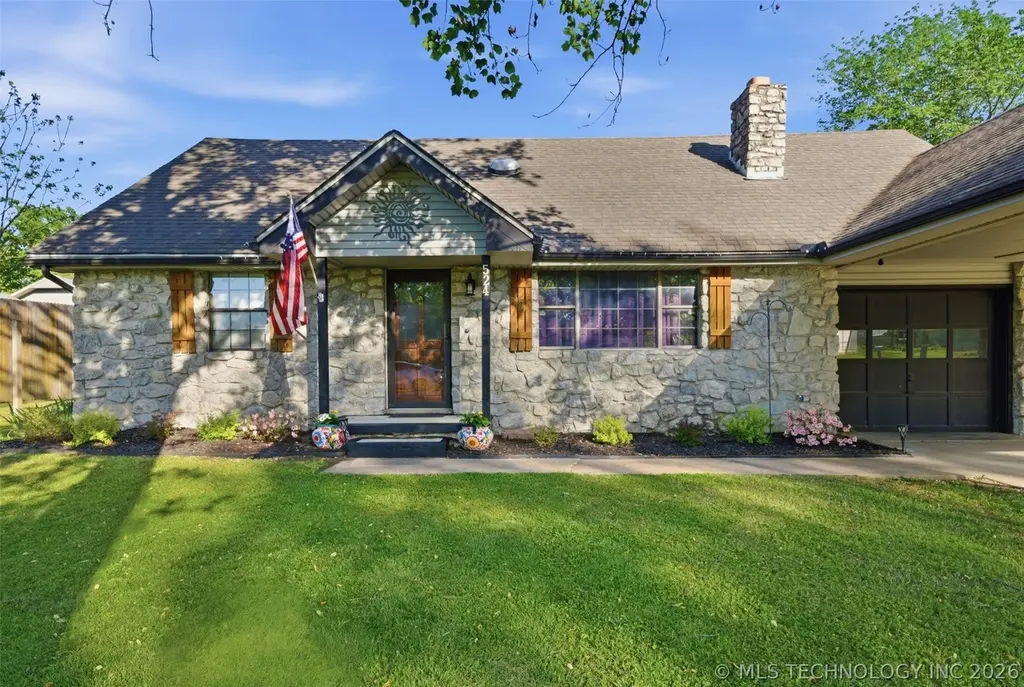
524 N Brown St · Vinita, OK
Flood risk 1/10 · Minimal
- FEMA flood zone
- X (unshaded)
- Chance of flooding over 30 yrs
- 0.0%
- Est. flood insurance / yr
- $507 – $1,088
Fire risk 5/10 · Moderate
- Est. fire insurance / yr
- $2,463 – $4,575
Heat risk 6/10 · Moderate
- Hot days now (above 110°F)
- 7 days/yr
- Hot days in 30 yrs
- 20 days/yr
Wind risk 2/10 · Minimal
- Chance of severe wind over 30 yrs
- 3.0%
Air-quality risk 2/10 · Minimal
- Unhealthy air days now
- 1 days/yr
- Unhealthy air days in 30 yrs
- 1 days/yr
Risk factors via First Street. Map © Google.
Why this score? — see what drove the F grade
The composite is a weighted blend of 9 inputs, each scored 0–100. Each bar is that input's sub-score; the figure is the points it added to the 100-point composite (weight × sub-score).
- Appreciation +10.0/10.0
- Cash flow +9.6/30.0
- Livability +3.2/5.0
- DSCR +2.7/10.0
- Rent growth +2.5/5.0
- Condition / age +2.5/5.0
- 1% rule +1.8/10.0
- Schools +1.8/10.0
- ARV discount +0.4/15.0
$193,000
🖨 Deal sheet (PDF) 📄 Offer letter ✓ Due diligence
Listing remarks
This one is a show stopper with lots of personality! FULLY updated bathroom with modern hardscapes and one-of-a-kind touches will make your heart throb!! Before you drool over the bathroom you can't miss the Mid Century Modern ashetics in the kitchen. Painted cabinets, Butcher block countertops, modern tile backsplash and super fun lighting! One full bathroom and bedroom on the main floor. The unstairs provides two more large bedrooms and a full bathroom with a walk in storage closet! Fully feneced large backyard with a covered patio and storage shed!
Key facts
- 0.33 acre lot
- Garage
- Built 1975
Property features AI
Exterior
- Parking: Attached garage; 1 garage space; Carport
- Security: No safety shelter
- Utilities: Electricity available; Natural gas available; Public water; Public sewer
- Home design: 2-story; Faces west; Crawlspace foundation
- Construction: Stone and wood-frame construction; Asphalt/fiberglass roof; Built per public records
- Exterior features: Covered patio; Patio; Shed(s); Chain link fencing
Interior
- Kitchen: Dishwasher; Disposal; Microwave; Oven; Range; Stove; Refrigerator
- Flooring: Carpet; Tile; Vinyl
- Bathrooms: 2 full bathrooms
- Heating & cooling: Central heating (gas); Central air conditioning
- Interior features: Ceiling fan(s); Butcher block counters; Aluminum frame windows; Vinyl frame windows; No additional listed exterior interior features
- Laundry & utility: Washer hookup; Electric dryer hookup; Gas water heater
Neighborhood map
What this means for you Summary
Snapshot
- This is a 3-bed/2.0-bath single-family listed at $193k.
Deal economics
- At list price, monthly cash flow is $-131 ($-2k/yr) — negative.
- To cash-flow at today's rent, offer at most $170k (12.0% below list).
- To meet the 1% rule (rent ≥ 1% of price), the offer needs to be $132k (31.7% below list).
- Recommended offer: $132k (31.7% below list) — sets the bar for 1% rule.
Location & tenants
- Location reads 63/100 on livability (#227 in OK) — a middle-class / working-renter tenant base. Strengths: cost of living A+, housing A+, crime B; Watch: amenities F, commute F, employment F.
- Vinita (town): math 24% / reading 20% proficiency, ranked #156 of 270 in OK (top 58%) — low school quality limits family demand, transient renter base, plan for 1-2y turnover.
- Zoned schools: Vinita Es (math 33% / reading 18%, grade F, #345 of 845 statewide, top 41%, 595 students, 0% FRL); Ewing Halsell Ms (math 17% / reading 20%, grade F, #182 of 345 statewide, top 53%, 307 students, 0% FRL); Vinita Hs (math 22% / reading 27%, grade F, #150 of 447 statewide, top 48%, 419 students, 0% FRL) — zoned schools average 0% FRL vs 56% district-wide (56 pts lower); this property's tenant base skews higher-income than the district average.
- Market conditions: 113 active listings in the ZIP; 24 units permitted in Craig County in 2024 (0 in 5+ unit buildings).
Forward outlook
- In year one you build about $21k of equity ($1k loan paydown + $19k appreciation (10.0% local appreciation)).
- Craig County population projected to shrink 7% by 2050 — rents likely to lag national; underwrite the cash flow, not the appreciation.
- By year 2, paydown + projected appreciation supports a ~$33k cash-out refi (75% LTV) — recoverable capital for the next deal without selling this one.
Negotiation context
- It's been on market 18 days — a 2% lower offer ($190k) is reasonable based on typical stale-listing flexibility.
- Current owner paid $155k; 25% above their basis — modest negotiation headroom, anchor on the comps not their cost.
Risks & watch-outs
- Climate carrying-cost: moderate wildfire risk; extreme-heat days projected 7→20/yr by 2055 (HVAC capex compounding) — expect insurance premiums to compound above CPI over the hold.
Questions for the listing agent
- What do current leases actually rent for vs. the listed asking? Can we see a recent rent roll and the last 12 months of T-12 income?
- Built in 1975 — when were the roof, HVAC, electrical panel, plumbing, and water heater last replaced?
- Is there a deadline driving the sale (1031 exchange, divorce, estate, relocation)? That informs how much negotiation room exists.
- Schools are F-rated, which usually means shorter tenancies and higher turnover. Who's the typical renter profile here, and what's been the actual vacancy rate?
- The area grade is low — what's the realistic commute time and amenity access for the typical tenant pool here? Any planned neighborhood developments (good or bad) we should know about?
- What's the average days-on-market for RENTAL listings here right now (not sales)? A rising rental-DOM trend means longer vacancies and softer asking-rent achievability than the comps imply.
- What's the recent tenant-quality profile in this submarket — average credit score on applications, eviction rate, late-payment / NSF rate, and stable-employment percentage? A property-management company in the area should have these aggregated.
- How much new for-sale + rental construction is in the pipeline within 1–3 miles? Heavy new supply typically softens prices + rents 12–24 months out; constrained supply supports both.
Investment metrics
- 1% rule
- 0.68% ✗
- Cap rate
- 5.48%
- Cash-on-cash
- -2.91%
- DSCR
- 0.87
- GRM
- 12.2
CMA / ARV
- ARV (on-the-fly)
- $166,770
- Comps found
- 12
Show comp detail 12 sales within ~0.75 mi
| Address | Dist | Beds/Ba | Sqft | Sold | Price | $/sf | Match |
|---|---|---|---|---|---|---|---|
| 510 N Adair St | 0.12mi | 3/2.0 | 1,510 (-1%) | 6mo | $190,000 | $126 | 87 |
| 422 N Foreman St | 0.27mi | 3/2.0 | 1,488 (-3%) | 2mo | $172,000 | $116 | 81 |
| 429 N Bailey Ln | 0.43mi | 3/2.0 | 1,575 (+3%) | 15mo | $250,000 | $159 | 63 |
| 621 N Foreman St | 0.17mi | 3/2.0 | 1,683 (+10%) | 16mo | $175,000 | $104 | 62 |
| 520 W Clyde Ave | 0.30mi | 3/1.5 | 1,628 (+6%) | 18mo | $71,500 | $44 | 58 |
| 1327 W Clyde | 0.29mi | 2/2.0 (-1) | 1,372 (-10%) | 12mo | $150,000 | $109 | 54 |
| 610 N Gunter St | 0.28mi | 3/1.5 | 1,352 (-12%) | 16mo | $165,000 | $122 | 52 |
| 435 N Brewer St | 0.21mi | 4/2.0 (+1) | 1,692 (+11%) | 22mo | $150,000 | $89 | 50 |
| 320 N Brewer St | 0.37mi | 2/1.0 (-1) | 1,307 (-15%) | 5mo | $27,450 | $21 | 45 |
| 532 N Gunter St | 0.28mi | 3/1.5 | 1,308 (-14%) | 21mo | $80,000 | $61 | 43 |
| 740 N Thompson | 0.59mi | 4/3.0 (+1) | 1,428 (-7%) | 14mo | $193,000 | $135 | 41 |
| 103 S Brown | 0.68mi | 2/2.0 (-1) | 1,326 (-13%) | 8mo | $65,000 | $49 | 34 |
Match score weights: distance 35% · size 25% · config 20% · recency 20%. Top-matched comps best support the ARV.
Projected returns pro-forma
10.0% appreciation · 3.0% rent growth · sell at horizon
- IRR
- 22.2%
- Equity multiple
- 2.79×
- Total profit
- $96,694
- Equity at exit
- $173,870
- IRR
- 19.9%
- Equity multiple
- 6.39×
- Total profit
- $291,149
- Equity at exit
- $374,957
Cash invested: $54,040 (down + closing). Projections, not guarantees.
Landlord ↔ Tenant lean methodology
- Overall (STATE)
- 83 Strongly Landlord-Friendly
- State Oklahoma
- 83 Strongly Landlord-Friendly · R+20
- County
- — inherits STATE
- City
- — inherits STATE
ZIP-level market 74301
- Home prices YoY
- 7.1%
- Active inventory
- 113
- Price-to-rent
- 12.2×
Monthly cashflow live
- Estimated rent
- $1,319 medium interval (Pro) →
- Mortgage (P&I)
- −$1,012
- Tax from tax record
- −$80 /mo · $966/yr
- Insurance
- −$80
- HOA
- −$0
- Vacancy / Maint / Mgmt
- −$277
- Net cashflow
- $-131
Break-even live
Sensitivity live
| Price | -10% $-22 | -5% $-76 | +0% $-131 | +5% $-186 | +10% $-240 |
|---|---|---|---|---|---|
| Rent | -10% $-235 | -5% $-183 | +0% $-131 | +5% $-79 | +10% $-27 |
| Rate | -1.0pp $-34 | -0.5pp $-82 | base $-131 | +0.5pp $-181 | +1.0pp $-232 |
UW: 25.0% down · 7.5% · 30yr · 1.5% tax · 5.0% vac · 8.0% maint · 8.0% mgmt
Financing live
Cash to close
- Down payment
- $48,250
- Closing costs
- $5,790
- Reserves months
- —
- Total cash needed
- —
Loan-product check · same deal, 3 products live
Conventional
25% down · 7.5% · 30yr
- Down + closing
- —
- Monthly P&I
- —
- Monthly cashflow
- —
- DSCR
- —
- Eligible?
- —
Personal DTI + credit; lowest rate.
DSCR
20% down · 8.5% · 30yr
- Down + closing
- —
- Monthly P&I
- —
- Monthly cashflow
- —
- DSCR
- —
- Eligible?
- —
No personal income docs; deal must DSCR.
Hard money
10% down · 12.0% · 12mo
- Down + closing
- —
- Monthly P&I
- —
- Monthly cashflow
- —
- DSCR
- —
- Eligible?
- —
Short-term bridge; refi at stabilization.
Listing history 3 events
-
2026-05-19price $193,000
-
2026-05-07$198,000 Active
-
2023-06-05soldstatus $155,000
ⓘ Source: listings_history table (triggers on properties + properties_extension) + one-shot
backfill from property_details.listing_events for pre-trigger history.
Tax reassessment forecast OK · Resets to sale price
- Current annual tax
- $966 · $80/mo
- Projected year-2 tax
- $1,737 · $145/mo
- Expected delta
- +$771/yr (+$64/mo · 79.8%)
ⓘ Screening estimate from a state-policy table — verify with the county assessor before closing.
Climate risk First Street
- Flood 1/10 Low FEMA zone X (unshaded) · 0% chance over 30 yrs
- Wildfire 5/10 Major
- Heat 6/10 Major 7 d/yr ≥110°F today · 20 d/yr by 30 yrs out
- Wind 2/10 Low 3% chance of damaging wind over 30 yrs
- Air quality 2/10 Low 1 unhealthy d/yr today · 1 by 30 yrs out
Nearby sold comps map
Loading sold comps map…
Walkable amenities ~0.75 mi
Loading nearby amenities…
Taxation est. · year 1
- Rental income
- $15,829
- − Mortgage interest
- −$10,811
- − Property taxes
- −$966
- − Insurance
- −$965
- − Repairs & maintenance
- −$1,266
- − Management
- −$1,266
- − Depreciation
- −$5,615
- Taxable loss
- −$5,060
- Est. tax savings @ 24.0%
- +$1,214
- After-tax cash flow
- $-357/yr
For passive investors: Depreciation is non-cash, so a rental often shows a tax loss while cash-flowing — sheltering income. Rental losses are passive: they offset passive income freely, and up to $25,000/yr can offset ordinary (W-2) income if you actively participate and your MAGI is under $100k (phasing out to $0 by $150k); unused losses carry forward. On sale, claimed depreciation is recaptured at up to 25%, and gains may owe capital-gains tax (a 1031 exchange can defer both). Figures are a year-1 estimate at your 24.0% rate — not tax advice; consult a CPA.
Schools (NCES district)
- District
- Vinita
- NCES district ID
- 4031290
- Math proficiency
- 24% ▼ -10.00%
- Reading proficiency
- 20% ▼ -7.00%
- Median HH income
- $37,171
- Composite
- 18.37/100
- National rank
- #8943
- State rank
- #156 of 270 in OK
Livability — Vinita
- Score
- 63/100
- State rank
- #227
- US rank
- #15843
Category grades
Schools grade is shown separately in the Schools card above.
Census & demographics
- Census place
- Vinita, OK
- Population (ZIP)
- 11,126
Population outlook (Craig County) Hauer SSP2
- Today (2025)
- 14,522 people
- By 2030
- 14,263 · -1.8%
- By 2040
- 13,814 · -4.9%
- By 2050
- 13,457 · -7.3%
- By 2075
- 13,123 · -9.6%
- By 2100
- 12,323 · -15.1%
Race, ethnicity, and origin ACS 2023
- Neighborhood character
- Diverse neighborhood (Simpson 0.64)
- Race & ethnicity
- White 60% Native American 20% Two or more races 12% Black 4% Hispanic / Latino 4% Asian 1%
- Common ancestry
- Slovak 2% Lithuanian 1% Italian 1%
- Foreign-born
- 2% · Canada, Vietnam
- Languages at home
- 96% English-only · Spanish 3% Other Asian/Pacific 1%
Political lean MEDSL · Craig
- 2024 margin
- Solid R (+58.3) · D 20.0% · R 78.3% · Other 1.7%
- 2008→2024 swing
- -28.2pp toward R · 2008: -30.1pp · 2024: -58.3pp
- All cycles
- 2024: R+58.3 2020: R+57.5 2016: R+52.4 2012: R+34.1 2008: R+30.1
Not yet ingested
- Civics
- —
Market trends
- HPI YoY
- ▲ 17.37%
- Current HPI
- 262.4336
- Rent YoY
- —
- Metro
- —
- State GDP YoY
- ▲ 1.55%
- F500 in state
- 6
Industry mix (Fortune 500 HQ in OK)
| Industry | F500 HQs | Revenue |
|---|---|---|
| Energy | 3 | $48B |
|
||
Price history
+24.5% since first listed3 events — show timeline
- 2026-05-19 Price Changed $193,000 MLS Technology, Inc.
- 2026-05-07 Listed $198,000 MLS Technology, Inc.
- 2023-06-05 Sold (Public Records) $155,000 Public Records
Property tax history
+5.4%/yrLatest (2025): $966 · -40.4% YoY. Source: county tax records.
Cash-flow waterfall
monthlySold comps — $/sqft
last 12 mo · ≤1 miLoading sold comps…