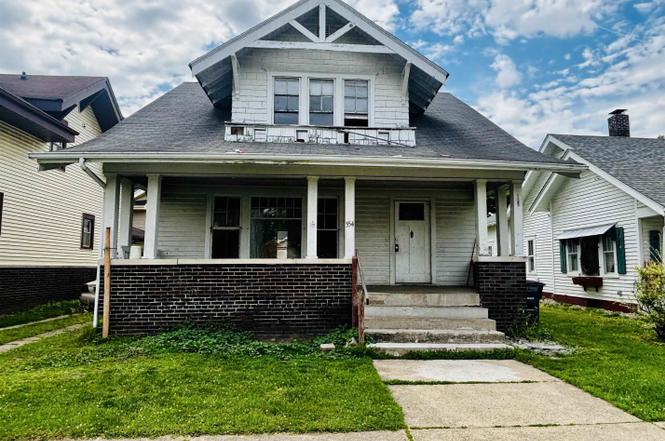
554 S Clay St · Frankfort, IN
Flood risk 1/10 · Minimal
- FEMA flood zone
- X (unshaded)
- Chance of flooding over 30 yrs
- 0.0%
- Est. flood insurance / yr
- $473 – $860
Fire risk 1/10 · Minimal
- Est. fire insurance / yr
- $717 – $1,331
Heat risk 3/10 · Minor
- Hot days now (above 101°F)
- 7 days/yr
- Hot days in 30 yrs
- 18 days/yr
Wind risk 2/10 · Minimal
- Chance of severe wind over 30 yrs
- —
Air-quality risk 3/10 · Minor
- Unhealthy air days now
- 2 days/yr
- Unhealthy air days in 30 yrs
- 3 days/yr
Risk factors via First Street. Map © Google.
Why this score? — see what drove the B+ grade
The composite is a weighted blend of 9 inputs, each scored 0–100. Each bar is that input's sub-score; the figure is the points it added to the 100-point composite (weight × sub-score).
- Cash flow +30.0/30.0
- ARV discount +15.0/15.0
- 1% rule +10.0/10.0
- DSCR +10.0/10.0
- Livability +3.7/5.0
- Rent growth +2.5/5.0
- Condition / age +2.5/5.0
- Schools +2.4/10.0
- Appreciation +0.0/10.0
$125,000
🖨 Deal sheet (PDF) 📄 Offer letter ✓ Due diligence
Listing remarks
Great Investment Opportunity! This 3-bedroom, 1.5-bath home offers 1,842 sq. ft. is ready for your personal touch. Whether you’re looking to create your dream home or add a great rental property to your portfolio, this property is full of possibilities.
Key facts
- 4,792 sq ft lot
- Garage
- Built 1915
Property features AI
Exterior
- Parking: Detached 1-car garage
- Utilities: Public water; Public sewer
- Home design: Single-family site-built home; One story
- Construction: Aluminum siding; Block foundation; Shingle roof; Built as site-built construction
- Exterior features: Covered porch; Porch; Level lot; Lot dimensions approximately 44 x 88
Interior
- Kitchen: Refrigerator; Gas range
- Bedrooms: Total of 5 rooms (bedroom count not specifically listed)
- Flooring: Carpet; Vinyl
- Bathrooms: One full bathroom; One half bathroom; One main-level bathroom
- Heating & cooling: Forced air heating; Central air conditioning
- Interior features: Refrigerator; Gas range; One fireplace (none specified as a specific type); Full unfinished basement
- Laundry & utility: Laundry on main level
Neighborhood map
What this means for you Summary
Snapshot
- This is a 3-bed/1.5-bath single-family listed at $125k.
Deal economics
- At list price, monthly cash flow is $878 ($11k/yr) — positive.
- The deal already cash-flows at list — no discount required.
- Meets the 1% rule at list price ($2k rent vs $125k).
- Cap rate 14.7% vs local median 3.9% in Frankfort — top-decile yield for the area; either an underpriced asset or a hidden risk that comps aren't pricing in. Stress-test before assuming the spread holds.
Location & tenants
- Location reads 73/100 on livability (#107 in IN) — a middle-class / working-renter tenant base. Strengths: crime A+, cost of living A+, housing A+; Watch: amenities F, commute F, employment D-.
- Community Schools Of Frankfort (rural): math 27% / reading 30% proficiency, ranked #251 of 301 in IN (top 83%) — low school quality limits family demand, transient renter base, plan for 1-2y turnover; 68% free/reduced lunch — lower-income household profile, screen leases tightly.
- Zoned schools: Frankfort Middle School (math 19% / reading 27%, grade F, #263 of 330 statewide, top 80%, 706 students, 83% FRL); Frankfort High School (math 8% / reading 42%, grade F, #323 of 369 statewide, top 88%, 895 students, 75% FRL).
- Market conditions: 129 active listings in the ZIP; 1 comparable units currently listed for rent nearby; 59 units permitted in Clinton County in 2024 (0 in 5+ unit buildings).
Forward outlook
- Local home prices are declining (-3.0%/yr); year-one equity from $864 of loan paydown is wiped out by about $4k of value loss. Plan a longer hold.
- Clinton County population projected at -15% by 2050 — secular population decline; favor cash flow + early exit over multi-decade hold.
- At projected returns (-3.0% appreciation + 3.0% rent growth), your $35k cash investment doubles in ~4 years — after that, you're playing with house money.
Negotiation context
- Only 5 days on market — expect competitive offers; lowballing is unlikely to land.
- Current owner paid $58k; list at $125k implies a 117% gain — meaningful room to come down on a strong offer.
Risks & watch-outs
- Watch-outs: built in 1915 — expect roof / HVAC / electrical / plumbing capex.
Questions for the listing agent
- Built in 1915 — when were the roof, HVAC, electrical panel, plumbing, and water heater last replaced?
- Is there a deadline driving the sale (1031 exchange, divorce, estate, relocation)? That informs how much negotiation room exists.
- Schools are F-rated, which usually means shorter tenancies and higher turnover. Who's the typical renter profile here, and what's been the actual vacancy rate?
- What's the average days-on-market for RENTAL listings here right now (not sales)? A rising rental-DOM trend means longer vacancies and softer asking-rent achievability than the comps imply.
- What's the recent tenant-quality profile in this submarket — average credit score on applications, eviction rate, late-payment / NSF rate, and stable-employment percentage? A property-management company in the area should have these aggregated.
- How much new for-sale + rental construction is in the pipeline within 1–3 miles? Heavy new supply typically softens prices + rents 12–24 months out; constrained supply supports both.
Investment metrics
- 1% rule
- 1.84% ✓
- Cap rate
- 14.72%
- Cash-on-cash
- 30.10%
- DSCR
- 2.34
- GRM
- 4.5
CMA / ARV
- ARV (on-the-fly)
- $208,392
- Comps found
- 12
Show comp detail 12 sales within ~0.75 mi
| Address | Dist | Beds/Ba | Sqft | Sold | Price | $/sf | Match |
|---|---|---|---|---|---|---|---|
| 601 S Clay St | 0.04mi | 3/2.0 | 1,894 (+4%) | 3mo | $163,500 | $86 | 87 |
| 1008 Homewood Drive Dr | 0.35mi | 3/2.0 | 1,783 (-2%) | 1mo | $188,000 | $105 | 77 |
| 1058 E South St | 0.40mi | 3/2.0 | 1,739 (-5%) | 4mo | $307,000 | $177 | 68 |
| 855 E Washington St | 0.42mi | 3/1.5 | 1,656 (-9%) | 1mo | $185,000 | $112 | 64 |
| 1004 E South St | 0.37mi | 3/2.0 | 1,634 (-11%) | 1mo | $307,400 | $188 | 62 |
| 59 W White St | 0.62mi | 2/2.0 (-1) | 1,820 (-0%) | 1mo | $199,000 | $109 | 62 |
| 302 Washington Avenue Ave | 0.46mi | 4/2.0 (+1) | 1,923 (+5%) | 2mo | $190,000 | $99 | 62 |
| 608 Fisher St | 0.36mi | 2/2.0 (-1) | 1,670 (-9%) | 1mo | $241,000 | $144 | 61 |
| 708 Glendale Dr | 0.17mi | 4/2.0 (+1) | 1,602 (-12%) | 4mo | $204,000 | $127 | 61 |
| 309 W Morrison St | 0.63mi | 3/1.0 | 1,905 (+4%) | 2mo | $217,000 | $114 | 60 |
| 1002 Short 4th St | 0.66mi | 3/1.0 | 1,747 (-4%) | 2mo | $133,500 | $76 | 58 |
| 751 Woodland Ct | 0.73mi | 3/2.5 | 1,864 (+2%) | 1mo | $238,000 | $128 | 58 |
Match score weights: distance 35% · size 25% · config 20% · recency 20%. Top-matched comps best support the ARV.
Projected returns pro-forma
-3.0% appreciation · 3.0% rent growth · sell at horizon
- IRR
- 24.7%
- Equity multiple
- 2.02×
- Total profit
- $35,729
- Equity at exit
- $18,638
- IRR
- 32.5%
- Equity multiple
- 3.95×
- Total profit
- $103,419
- Equity at exit
- $10,808
Cash invested: $35,000 (down + closing). Projections, not guarantees.
Landlord ↔ Tenant lean methodology
- Overall (STATE)
- 90 Strongly Landlord-Friendly
- State Indiana
- 90 Strongly Landlord-Friendly · R+11
- County
- — inherits STATE
- City
- — inherits STATE
ZIP-level market 46041
- Home prices YoY
- -17.8%
- Active inventory
- 129
- Price-to-rent
- 4.5×
Monthly cashflow live
- Estimated rent
- $2,295 medium interval (Pro) →
- Mortgage (P&I)
- −$656
- Tax from tax record
- −$228 /mo · $2,732/yr
- Insurance
- −$52
- HOA
- −$0
- Vacancy / Maint / Mgmt
- −$482
- Net cashflow
- $878
Break-even live
Sensitivity live
| Price | -10% $949 | -5% $913 | +0% $878 | +5% $842 | +10% $807 |
|---|---|---|---|---|---|
| Rent | -10% $696 | -5% $787 | +0% $878 | +5% $968 | +10% $1,059 |
| Rate | -1.0pp $941 | -0.5pp $910 | base $878 | +0.5pp $845 | +1.0pp $812 |
UW: 25.0% down · 7.5% · 30yr · 1.5% tax · 5.0% vac · 8.0% maint · 8.0% mgmt
Financing live
Cash to close
- Down payment
- $31,250
- Closing costs
- $3,750
- Reserves months
- —
- Total cash needed
- —
Loan-product check · same deal, 3 products live
Conventional
25% down · 7.5% · 30yr
- Down + closing
- —
- Monthly P&I
- —
- Monthly cashflow
- —
- DSCR
- —
- Eligible?
- —
Personal DTI + credit; lowest rate.
DSCR
20% down · 8.5% · 30yr
- Down + closing
- —
- Monthly P&I
- —
- Monthly cashflow
- —
- DSCR
- —
- Eligible?
- —
No personal income docs; deal must DSCR.
Hard money
10% down · 12.0% · 12mo
- Down + closing
- —
- Monthly P&I
- —
- Monthly cashflow
- —
- DSCR
- —
- Eligible?
- —
Short-term bridge; refi at stabilization.
Rent comps 1 comps
| Address | Beds | Baths | Sqft | Rent | $/sqft | DOM | Units | Dist |
|---|---|---|---|---|---|---|---|---|
| 904 E Clinton St Frankfort, IN | 4.0 | 2.0 | 2447 | $2,295 | $0.94 | 13d | 1 | 0.43mi |
Listing history 5 events
-
2026-06-21days on market $125,000 Active 5 DOM
-
2026-06-21days on market $125,000 Active 4 DOM
-
2026-06-18days on market $125,000 Active 2 DOM
-
2026-06-17remarks 253-char remark
-
2026-06-17$125,000 Active 1 DOM
ⓘ Source: listings_history table (triggers on properties + properties_extension) + one-shot
backfill from property_details.listing_events for pre-trigger history.
Tax reassessment forecast IN · Partial reset (capped growth)
- Current annual tax
- $2,732 · $228/mo
- Projected year-2 tax
- $2,732 · $228/mo
- Expected delta
- $0/yr ($0/mo · 0.0%)
ⓘ Screening estimate from a state-policy table — verify with the county assessor before closing.
Climate risk First Street
- Flood 1/10 Low FEMA zone X (unshaded) · 0% chance over 30 yrs
- Wildfire 1/10 Low
- Heat 3/10 Moderate 7 d/yr ≥101°F today · 18 d/yr by 30 yrs out
- Wind 2/10 Low
- Air quality 3/10 Moderate 2 unhealthy d/yr today · 3 by 30 yrs out
Nearby sold comps map
Loading sold comps map…
Walkable amenities ~0.75 mi
Loading nearby amenities…
Taxation est. · year 1
- Rental income
- $27,540
- − Mortgage interest
- −$7,002
- − Property taxes
- −$2,732
- − Insurance
- −$625
- − Repairs & maintenance
- −$2,203
- − Management
- −$2,203
- − Depreciation
- −$3,636
- Taxable income
- $9,138
- Est. tax owed @ 24.0%
- −$2,193
- After-tax cash flow
- $8,340/yr
For passive investors: Depreciation is non-cash, so a rental often shows a tax loss while cash-flowing — sheltering income. Rental losses are passive: they offset passive income freely, and up to $25,000/yr can offset ordinary (W-2) income if you actively participate and your MAGI is under $100k (phasing out to $0 by $150k); unused losses carry forward. On sale, claimed depreciation is recaptured at up to 25%, and gains may owe capital-gains tax (a 1031 exchange can defer both). Figures are a year-1 estimate at your 24.0% rate — not tax advice; consult a CPA.
Schools (NCES district)
- District
- Community Schools Of Frankfort
- NCES district ID
- 1803660
- Math proficiency
- 27% ▼ -3.00%
- Reading proficiency
- 30% ▼ -6.00%
- Median HH income
- $42,144
- Composite
- 24.2/100
- National rank
- #7728
- State rank
- #251 of 301 in IN
Livability — Frankfort
- Score
- 73/100
- State rank
- #107
- US rank
- #5623
Category grades
Schools grade is shown separately in the Schools card above.
Census & demographics
- Census place
- Frankfort, IN
- Population (ZIP)
- 23,359
Population outlook (Clinton County) Hauer SSP2
- Today (2025)
- 31,197 people
- By 2030
- 30,257 · -3.0%
- By 2040
- 28,383 · -9.0%
- By 2050
- 26,644 · -14.6%
- By 2075
- 23,858 · -23.5%
- By 2100
- 22,236 · -28.7%
Race, ethnicity, and origin ACS 2023
- Neighborhood character
- Predominantly White (73%)
- Race & ethnicity
- White 73% Hispanic / Latino 24% Two or more races 11%
- Hispanic origin (detail)
- Mexican 22%
- Common ancestry
- Iranian 1% Italian 1% Slovak 1%
- Foreign-born
- 11% · Canada, Philippines
- Languages at home
- 86% English-only · Spanish 14%
Political lean MEDSL · Clinton
- 2024 margin
- Solid R (+48.0) · D 25.2% · R 73.2% · Other 1.6%
- 2008→2024 swing
- -35.0pp toward R · 2008: -13.0pp · 2024: -48.0pp
- All cycles
- 2024: R+48.0 2020: R+46.1 2016: R+48.0 2012: R+30.7 2008: R+13.0
Not yet ingested
- Civics
- —
Market trends
- HPI YoY
- ▼ -57.02%
- Current HPI
- 263.2258
- Rent YoY
- —
- Metro
- —
- State GDP YoY
- ▲ 2.90%
- F500 in state
- 18
Industry mix (Fortune 500 HQ in IN)
| Industry | F500 HQs | Revenue |
|---|---|---|
| Industrial Machinery | 2 | $37B |
|
||
| Healthcare | 1 | $177B |
|
||
| Pharmaceuticals | 1 | $45B |
|
||
| Metals / Steel | 1 | $18B |
|
||
| Agriculture | 1 | $17B |
|
||
| Packaging | 1 | $12B |
|
||
Price history
+117.4% since first listed2 events — show timeline
- 2026-06-16 Listed $125,000 IRMLS
- 2010-05-14 Sold (Public Records) $57,500 Public Records
Property tax history
+17.0%/yrLatest (2024): $2,732 · +2.5% YoY. Source: county tax records.
Cash-flow waterfall
monthlySold comps — $/sqft
last 12 mo · ≤1 miLoading sold comps…