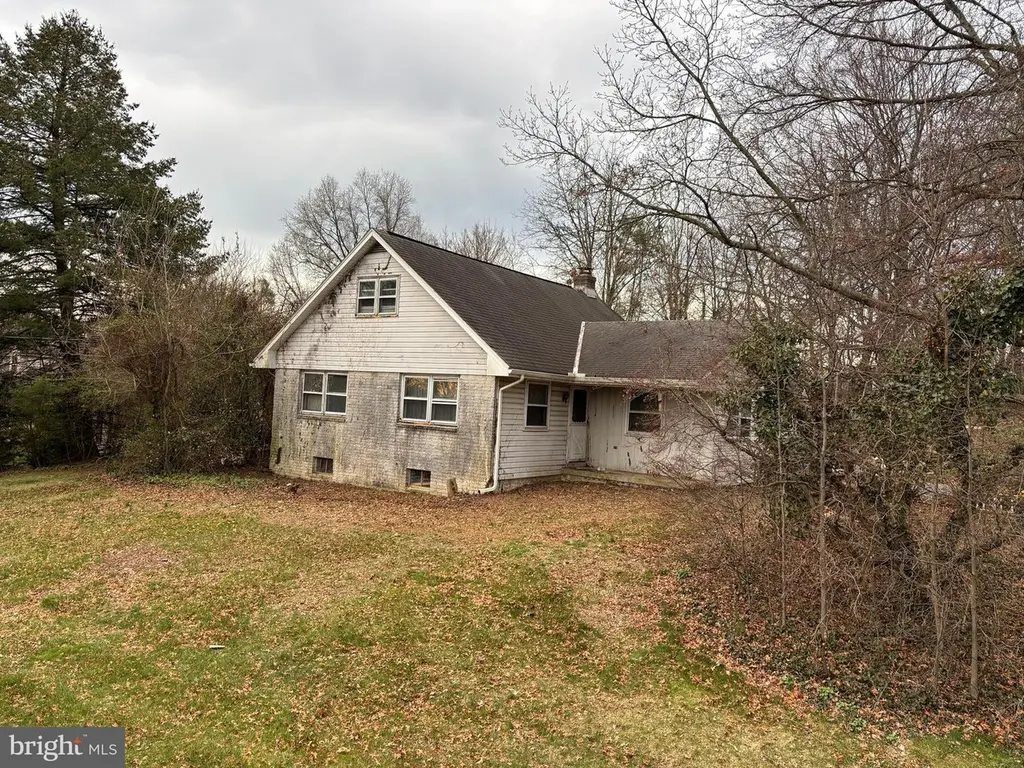
39 Hossler Rd · Rapho, PA
Flood risk 1/10 · Minimal
- FEMA flood zone
- X (unshaded)
- Chance of flooding over 30 yrs
- 0.0%
- Est. flood insurance / yr
- $507 – $1,088
Fire risk 1/10 · Minimal
- Est. fire insurance / yr
- $511 – $949
Heat risk 5/10 · Moderate
- Hot days now (above 102°F)
- 7 days/yr
- Hot days in 30 yrs
- 15 days/yr
Wind risk 4/10 · Minor
- Chance of severe wind over 30 yrs
- 15.0%
Air-quality risk 4/10 · Minor
- Unhealthy air days now
- 3 days/yr
- Unhealthy air days in 30 yrs
- 6 days/yr
Risk factors via First Street. Map © Google.
Why this score? — see what drove the C+ grade
The composite is a weighted blend of 9 inputs, each scored 0–100. Each bar is that input's sub-score; the figure is the points it added to the 100-point composite (weight × sub-score).
- Cash flow +26.3/30.0
- DSCR +8.9/10.0
- 1% rule +7.6/10.0
- ARV discount +7.5/15.0
- Schools +4.0/10.0
- Rent growth +2.5/5.0
- Livability +2.5/5.0
- Condition / age +2.5/5.0
- Appreciation +0.0/10.0
$150,000
🖨 Deal sheet 📄 Offer letter ✓ Due diligence
Listing remarks
This property will be offered at Public Auction on Tuesday, June 2, 2026 @ 6pm. The listing price is the opening bid only and in no way reflects the final sale price. 10% down due at auction, 2% transfer tax to be paid by the purchaser, real estate taxes prorated. Conveniently located just outside of Manheim Borough, this 1½-story, three-bedroom, one-bath home sits on a generous 0.70-acre lot and offers excellent potential for investors, house flippers, or first-time buyers. Inside, the home features a spacious kitchen and dining area, a large living room, three bedrooms, and a full bathroom. Hardwood floors run throughout the living room and all three bedrooms. An open staircase l
Key facts
- Open staircase
- Utility room
- Spacious kitchen
Tags
Property features AI
Finance
- Other: Fee simple ownership; Property condition listed as below average
Exterior
- Parking: Attached carport (1 space); Driveway with 2 spaces; Three total garage and parking spaces
- Utilities: Well water; On-site septic; Electric hot water
- Home design: Detached property; Composite/shingle roof
- Construction: Frame construction with metal siding; Permanent foundation; Year built per assessor
- Exterior features: Detached shed on the property; Not in a federal flood zone; Municipal trash service
Interior
- Bedrooms: Three bedrooms on the main level
- Flooring: Hardwood; Vinyl
- Bathrooms: One full bathroom (main level)
- Heating & cooling: Electric baseboard heating; Electric cooling
- Interior features: Dining area; Wood floors; Unfinished basement
- Laundry & utility: Laundry located in the basement
Neighborhood map
What this means for you Summary
Snapshot
- This is a 3-bed/1.0-bath single-family listed at $150k.
Deal economics
- At list price, monthly cash flow is $389 ($5k/yr) — positive.
- The deal already cash-flows at list — no discount required.
- Meets the 1% rule at list price ($2k rent vs $150k).
- Recommended offer: $146k (3.0% below list) — sets the bar for market timing.
Location & tenants
- Location reads: area grade C — affects rentability + tenant quality, not the cash-flow math above.
- Manheim Central SD (suburban): math 38% / reading 53% proficiency, ranked #242 of 539 in PA (top 45%) — families likely to look elsewhere, expect single-tenant / working-renter base with shorter leases.
- Zoned schools: Manheim Central Ms (math 27% / reading 49%, grade F, #283 of 512 statewide, top 57%, 848 students, 42% FRL); Manheim Central Shs (math 77% / reading 24%, grade D+, #125 of 437 statewide, top 30%, 935 students, 31% FRL).
- Market conditions: 79 active listings in the ZIP; 2 comparable units currently listed for rent nearby; solid renter incomes; 1,093 units permitted in Lancaster County in 2024 (201 in 5+ unit buildings).
Forward outlook
- Local home prices are declining (-3.0%/yr); year-one equity from $1k of loan paydown is wiped out by about $4k of value loss. Plan a longer hold.
- Lancaster County population projected at +5% by 2050 — modest demand growth; plan on rents tracking national, not racing it.
- At projected returns (-3.0% appreciation + 3.0% rent growth), your $42k cash investment doubles in ~10 years — after that, you're playing with house money.
Negotiation context
- It's been on market 45 days — a 3% lower offer ($146k) is reasonable based on typical stale-listing flexibility.
Risks & watch-outs
- Climate carrying-cost: extreme-heat days projected 7→15/yr by 2055 (HVAC capex compounding) — expect insurance premiums to compound above CPI over the hold.
Questions for the listing agent
- It's been on market 45 days. Have you received any prior offers? Is the seller open to a 3% concession, seller financing, or rate buy-down credit?
- Built in 1969 — when were the roof, HVAC, electrical panel, plumbing, and water heater last replaced?
- Is there a deadline driving the sale (1031 exchange, divorce, estate, relocation)? That informs how much negotiation room exists.
- What's the average days-on-market for RENTAL listings here right now (not sales)? A rising rental-DOM trend means longer vacancies and softer asking-rent achievability than the comps imply.
- What's the recent tenant-quality profile in this submarket — average credit score on applications, eviction rate, late-payment / NSF rate, and stable-employment percentage? A property-management company in the area should have these aggregated.
- How much new for-sale + rental construction is in the pipeline within 1–3 miles? Heavy new supply typically softens prices + rents 12–24 months out; constrained supply supports both.
Investment metrics
- 1% rule
- 1.26% ✓
- Cap rate
- 9.40%
- Cash-on-cash
- 11.10%
- DSCR
- 1.49
- GRM
- 6.6
CMA / ARV
- ARV (median comp)
- $305,338
- List price
- $150,000
- Delta
- -50.87%
- Verdict
- UNDERPRICED
- Comps
- 20 within 1.0 mi
Show comp detail 10 sales within ~0.75 mi
| Address | Dist | Beds/Ba | Sqft | Sold | Price | $/sf | Match |
|---|---|---|---|---|---|---|---|
| 674 Lorraine Ave | 0.11mi | 3/2.0 | 1,704 (-0%) | 24mo | $325,000 | $191 | 70 |
| 28 Hossler Rd | 0.03mi | 3/2.0 | 1,854 (+8%) | 19mo | $335,000 | $181 | 65 |
| 15 Crystal Dr | 0.58mi | 4/2.0 (+1) | 1,716 (+0%) | 2mo | $63,000 | $37 | 62 |
| 26 S Snyder St | 0.44mi | 3/2.0 | 1,692 (-1%) | 24mo | $335,000 | $198 | 54 |
| 45 Crescent Dr | 0.24mi | 4/2.0 (+1) | 1,782 (+4%) | 23mo | $370,000 | $208 | 54 |
| 849 Mount Joy Rd | 0.21mi | 3/1.0 | 1,460 (-15%) | 14mo | $164,000 | $112 | 54 |
| 332 W High St | 0.62mi | 4/2.0 (+1) | 1,720 (+0%) | 13mo | $260,000 | $151 | 50 |
| 1011 Mount Joy Rd | 0.58mi | 3/1.0 | 1,476 (-14%) | 11mo | $216,500 | $147 | 41 |
| 228 W Gramby St | 0.69mi | 3/2.0 | 1,826 (+7%) | 24mo | $520,000 | $285 | 33 |
| 27 Crystal Dr | 0.53mi | 3/2.0 | 1,456 (-15%) | 18mo | $101,450 | $70 | 32 |
Match score weights: distance 35% · size 25% · config 20% · recency 20%. Top-matched comps best support the ARV.
Projected returns pro-forma
-3.0% appreciation · 3.0% rent growth · sell at horizon
- IRR
- 0.3%
- Equity multiple
- 1.01×
- Total profit
- $512
- Equity at exit
- $22,365
- IRR
- 10.0%
- Equity multiple
- 1.78×
- Total profit
- $32,606
- Equity at exit
- $12,969
Cash invested: $42,000 (down + closing). Projections, not guarantees.
Landlord ↔ Tenant lean methodology
- Overall (STATE)
- 62 Landlord-Friendly
- State Pennsylvania
- 62 Landlord-Friendly · EVEN
- County
- — inherits STATE
- City
- — inherits STATE
ZIP-level market 17545
- Home prices YoY
- -30.5%
- Active inventory
- 79
- Price-to-rent
- 6.6×
Monthly cashflow live
- Estimated rent
- $1,896 medium interval (Pro) →
- Mortgage (P&I)
- −$787
- Tax from tax record
- −$260 /mo · $3,119/yr
- Insurance
- −$62
- HOA
- −$0
- Vacancy / Maint / Mgmt
- −$398
- Net cashflow
- $389
Break-even live
UW: 25.0% down · 7.5% · 30yr · 1.5% tax · 5.0% vac · 8.0% maint · 8.0% mgmt
Financing live
Cash to close
- Down payment
- $37,500
- Closing costs
- $4,500
- Reserves months
- —
- Total cash needed
- —
Loan-product check · same deal, 3 products live
Conventional
25% down · 7.5% · 30yr
- Down + closing
- —
- Monthly P&I
- —
- Monthly cashflow
- —
- DSCR
- —
- Eligible?
- —
Personal DTI + credit; lowest rate.
DSCR
20% down · 8.5% · 30yr
- Down + closing
- —
- Monthly P&I
- —
- Monthly cashflow
- —
- DSCR
- —
- Eligible?
- —
No personal income docs; deal must DSCR.
Hard money
10% down · 12.0% · 12mo
- Down + closing
- —
- Monthly P&I
- —
- Monthly cashflow
- —
- DSCR
- —
- Eligible?
- —
Short-term bridge; refi at stabilization.
Rent comps 2 comps
| Address | Beds | Baths | Sqft | Rent | $/sqft | DOM | Units | Dist |
|---|---|---|---|---|---|---|---|---|
| 21 W Gramby St Manheim, PA | 3.0 | 1.5 | 1484 | $1,900 | $1.28 | 44d | 1 | 0.99mi |
| 35 W Ferdinand St Manheim, PA | 3.0 | 2.0 | 1530 | $1,600 | $1.05 | 43d | 1 | 1.02mi |
Listing history 17 events
-
2026-06-18days on market $150,000 Active 45 DOM
-
2026-06-17days on market $150,000 Active 44 DOM
-
2026-06-16days on market $150,000 Active 43 DOM
-
2026-06-15days on market $150,000 Active 42 DOM
-
2026-06-14days on market $150,000 Active 40 DOM
-
2026-06-13days on market $150,000 Active 39 DOM
-
2026-06-10days on market $150,000 Active 37 DOM
-
2026-06-09days on market $150,000 Active 36 DOM
-
2026-06-08days on market $150,000 Active 35 DOM
-
2026-06-07days on market $150,000 Active 34 DOM
-
2026-06-05days on market $150,000 Active 31 DOM
-
2026-06-03days on market $150,000 Active 30 DOM
-
2026-06-02days on market $150,000 Active 29 DOM
-
2026-06-01days on market $150,000 Active 28 DOM
-
2026-05-31days on market $150,000 Active 27 DOM
-
2026-05-30days on market $150,000 Active 26 DOM
-
2026-05-04$150,000 Active 1238-char remark
ⓘ Source: listings_history table (triggers on properties + properties_extension) + one-shot
backfill from property_details.listing_events for pre-trigger history.
Tax reassessment forecast PA · Partial reset (capped growth)
- Current annual tax
- $3,119 · $260/mo
- Projected year-2 tax
- $3,119 · $260/mo
- Expected delta
- $0/yr ($0/mo · 0.0%)
ⓘ Screening estimate from a state-policy table — verify with the county assessor before closing.
Climate risk First Street
- Flood 1/10 Low FEMA zone X (unshaded) · 0% chance over 30 yrs
- Wildfire 1/10 Low
- Heat 5/10 Major 7 d/yr ≥102°F today · 15 d/yr by 30 yrs out
- Wind 4/10 Moderate 15% chance of damaging wind over 30 yrs
- Air quality 4/10 Moderate 3 unhealthy d/yr today · 6 by 30 yrs out
Nearby sold comps map
Loading sold comps map…
Walkable amenities ~0.75 mi
Loading nearby amenities…
Taxation est. · year 1
- Rental income
- $22,747
- − Mortgage interest
- −$8,402
- − Property taxes
- −$3,119
- − Insurance
- −$750
- − Repairs & maintenance
- −$1,820
- − Management
- −$1,820
- − Depreciation
- −$4,364
- Taxable income
- $2,473
- Est. tax owed @ 24.0%
- −$594
- After-tax cash flow
- $4,069/yr
For passive investors: Depreciation is non-cash, so a rental often shows a tax loss while cash-flowing — sheltering income. Rental losses are passive: they offset passive income freely, and up to $25,000/yr can offset ordinary (W-2) income if you actively participate and your MAGI is under $100k (phasing out to $0 by $150k); unused losses carry forward. On sale, claimed depreciation is recaptured at up to 25%, and gains may owe capital-gains tax (a 1031 exchange can defer both). Figures are a year-1 estimate at your 24.0% rate — not tax advice; consult a CPA.
Schools (NCES district)
- District
- Manheim Central SD
- NCES district ID
- 4214550
- Math proficiency
- 38% ▼ -11.00%
- Reading proficiency
- 53% ▼ -10.00%
- Median HH income
- $60,723
- Composite
- 40.02/100
- National rank
- #3825
- State rank
- #242 of 539 in PA
Livability — Rapho
No livability data for this city. (Only ~50 U.S. cities are tracked.)
Census & demographics
- County
- Lancaster County · 390,309 people
- Metro
- Lancaster, PA
- Population (ZIP)
- 23,556
- Household income
- $84,704
- Rent vs Own
- Severe rent burden
- 342.0
Population outlook (Lancaster County) Hauer SSP2
- Today (2025)
- 561,011 people
- By 2030
- 570,969 · +1.8%
- By 2040
- 585,929 · +4.4%
- By 2050
- 591,056 · +5.4%
- By 2075
- 594,747 · +6.0%
- By 2100
- 558,850 · -0.4%
Race, ethnicity, and origin ACS 2023
- Neighborhood character
- Predominantly White (93%)
- Race & ethnicity
- White 93% Two or more races 5% Hispanic / Latino 3%
- Common ancestry
- Romanian 4% Lithuanian 1% Slovak 1%
- Foreign-born
- 1% · Canada
- Languages at home
- 96% English-only · German/W. Germanic 3% Spanish 1%
Political lean MEDSL · Lancaster
- 2024 margin
- R (+15.9) · D 41.5% · R 57.5%
- 2008→2024 swing
- -4.1pp toward R · 2008: -11.8pp · 2024: -15.9pp
- All cycles
- 2024: R+15.9 2020: R+15.8 2016: R+19.7 2012: R+19.2 2008: R+11.8
Not yet ingested
- Civics
- —
Market trends
- HPI YoY
- ▼ -115.46%
- Current HPI
- 263.1172
- Rent YoY
- —
- Metro
- Lancaster, PA
- State GDP YoY
- ▲ 1.68%
- F500 in state
- 34
Industry mix (Fortune 500 HQ in PA)
| Industry | F500 HQs | Revenue |
|---|---|---|
| Healthcare | 2 | $309B |
|
||
| Insurance | 2 | $27B |
|
||
| Telecommunications / Media | 1 | $124B |
|
||
| Industrial Distribution | 1 | $22B |
|
||
| Financial Services | 1 | $20B |
|
||
| Chemicals / Materials | 1 | $18B |
|
||
Price history
1 event — show timeline
- 2026-05-04 Listed $150,000 BRIGHT MLS
Property tax history
+1.8%/yrLatest (2026): $3,119 · +3.8% YoY. Source: county tax records.
Cash-flow waterfall
monthlySold comps — $/sqft
last 12 mo · ≤1 miLoading sold comps…