8480 Southern Springs Blvd · Indianapolis city (balance), IN
Flood risk 1/10 · Minimal
- FEMA flood zone
- X (unshaded)
- Chance of flooding over 30 yrs
- 0.0%
- Est. flood insurance / yr
- $507 – $1,088
Fire risk 1/10 · Minimal
- Est. fire insurance / yr
- $717 – $1,331
Heat risk 3/10 · Minor
- Hot days now (above 100°F)
- 7 days/yr
- Hot days in 30 yrs
- 19 days/yr
Wind risk 2/10 · Minimal
- Chance of severe wind over 30 yrs
- 1.0%
Air-quality risk 2/10 · Minimal
- Unhealthy air days now
- 2 days/yr
- Unhealthy air days in 30 yrs
- 2 days/yr
Risk factors via First Street. Map © Google.
Why this score? — see what drove the D grade
The composite is a weighted blend of 9 inputs, each scored 0–100. Each bar is that input's sub-score; the figure is the points it added to the 100-point composite (weight × sub-score).
- Cash flow +12.8/30.0
- ARV discount +8.3/15.0
- Schools +4.0/10.0
- DSCR +3.8/10.0
- Rent growth +3.4/5.0
- 1% rule +3.1/10.0
- Livability +2.5/5.0
- Condition / age +2.5/5.0
- Appreciation +0.0/10.0
$259,900
🖨 Deal sheet 📄 Offer letter ✓ Due diligence
Listing remarks
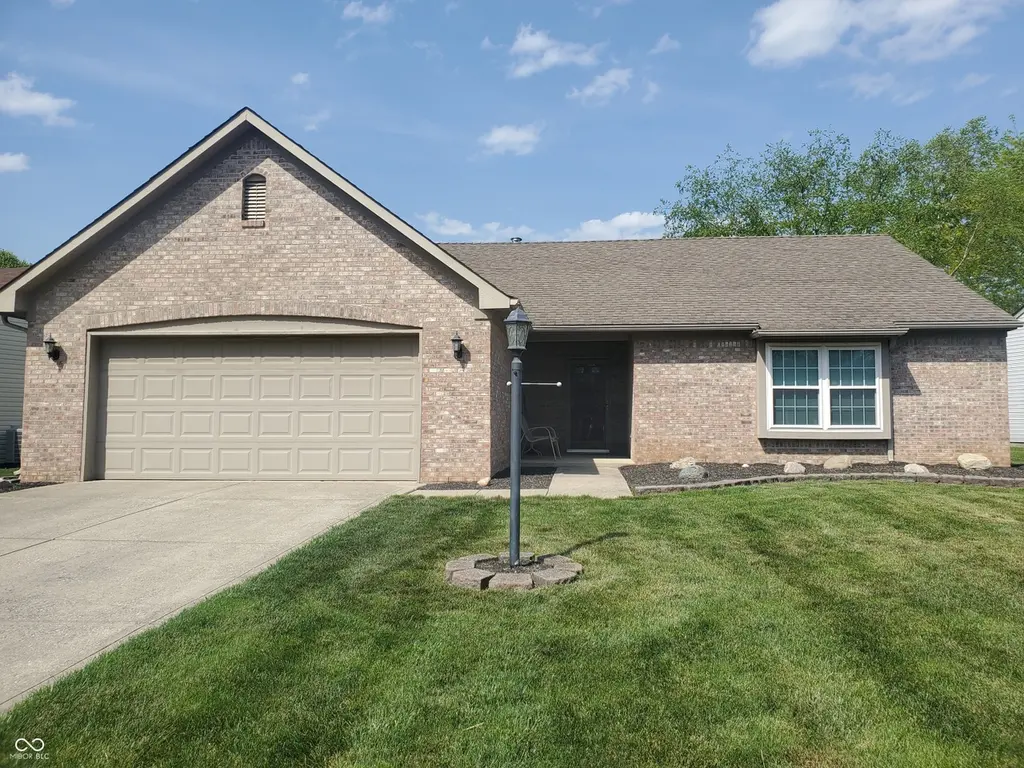
Discover the ease of single-story living at 8480 Southern Springs. A charming 3BD/2BA, 1400sqft ranch, offers ample space & a beautiful water view in your FULLY-FENCED back yard. Relax on your patio or unwind inside the open concept living/kitchen space. With three well-proportioned bedrooms, this home provides ample personal space for relaxation and rejuvenation. A cozy fireplace and walk-in closets are just a couple of nice bonuses this home has to offer. The large family room and kitchen are wonderful for family gatherings. This one-owner home has been thoughtfully maintained and is move-in ready! All appliances included! Convenient location for shopping, schools, and highways.
Key facts
- 7,700 sq ft lot
- 2 garage spots
- Built 1995
Property features AI
Finance
- HOA & community: Homeowners association with an annual fee of $275
Exterior
- Parking: Attached 2-car garage
- Security: Smoke detectors
- Utilities: Public water; Municipal sewer connected; No solid waste service noted
- Home design: Single-family residence; One story; Mandatory fee ownership
- Construction: Vinyl with brick and brick exterior; Slab foundation
- Exterior features: Patio; Full yard fence; Sidewalks; Waterfront on a pond; Has view
Interior
- Kitchen: Dishwasher; Garbage disposal; Microwave (with microhood); Gas oven; Refrigerator; Pantry; Eat-in kitchen
- Bedrooms: Three main-level bedrooms; Primary bedroom with walk-in closet
- Bathrooms: Two full bathrooms; Primary bathroom with full shower stall and suite layout
- Heating & cooling: Heat pump and natural gas heating; Central air conditioning
- Interior features: Cathedral and vaulted ceilings; Eat-in kitchen; Pantry; Walk-in closets; One masonry fireplace in the living room
- Laundry & utility: Main-level laundry room; Washer and dryer included; Gas water heater; Owned water softener
Neighborhood map
What this means for you Summary
Snapshot
- This is a 3-bed/1.0-bath single-family listed at $260k.
Deal economics
- At list price, monthly cash flow is $-26 ($-312/yr) — negative.
- To cash-flow at today's rent, offer at most $255k (1.8% below list).
- To meet the 1% rule (rent ≥ 1% of price), the offer needs to be $210k (19.4% below list).
- Recommended offer: $210k (19.4% below list) — sets the bar for 1% rule.
- Cap rate 6.2% vs local median 4.4% in Indianapolis city (balance) — top-decile yield for the area; either an underpriced asset or a hidden risk that comps aren't pricing in. Stress-test before assuming the spread holds.
Location & tenants
- Location reads: area grade D — affects rentability + tenant quality, not the cash-flow math above.
- Franklin Township Community School Corporation (urban): math 42% / reading 47% proficiency, ranked #87 of 301 in IN (top 29%) — families likely to look elsewhere, expect single-tenant / working-renter base with shorter leases.
- Market conditions: Rents rising (+3.8%/yr); 261 active listings in the ZIP; 13 comparable units currently listed for rent nearby; rentals leasing fast (median 4d on market — plan ~1-2 weeks tenant-placement turnaround); solid renter incomes; 1,906 units permitted in Marion County in 2024 (621 in 5+ unit buildings).
- This rent runs 32% of the median local income ($79k/yr) — at the standard rent-burdened threshold; future hikes will face affordability resistance.
Forward outlook
- Local home prices are declining (-3.0%/yr); year-one equity from $2k of loan paydown is wiped out by about $8k of value loss. Plan a longer hold.
- Marion County population projected at +18% by 2050 — long-run rental-demand tailwind backs the buy-and-hold thesis.
Negotiation context
- Only 7 days on market — expect competitive offers; lowballing is unlikely to land.
Questions for the listing agent
- What do current leases actually rent for vs. the listed asking? Can we see a recent rent roll and the last 12 months of T-12 income?
- What does the HOA fee cover, when was the last increase, and are there any pending special assessments or reserve-fund shortfalls?
- Is there a deadline driving the sale (1031 exchange, divorce, estate, relocation)? That informs how much negotiation room exists.
- The area grade is low — what's the realistic commute time and amenity access for the typical tenant pool here? Any planned neighborhood developments (good or bad) we should know about?
- What's the average days-on-market for RENTAL listings here right now (not sales)? A rising rental-DOM trend means longer vacancies and softer asking-rent achievability than the comps imply.
- What's the recent tenant-quality profile in this submarket — average credit score on applications, eviction rate, late-payment / NSF rate, and stable-employment percentage? A property-management company in the area should have these aggregated.
- How much new for-sale + rental construction is in the pipeline within 1–3 miles? Heavy new supply typically softens prices + rents 12–24 months out; constrained supply supports both.
Investment metrics
- 1% rule
- 0.81% ✗
- Cap rate
- 6.17%
- Cash-on-cash
- -0.43%
- DSCR
- 0.98
- GRM
- 10.3
CMA / ARV
- ARV (on-the-fly)
- $264,600
- Comps found
- 12
Show comp detail 12 sales within ~0.75 mi
| Address | Dist | Beds/Ba | Sqft | Sold | Price | $/sf | Match |
|---|---|---|---|---|---|---|---|
| 8480 Southern Springs Blvd | 0.00mi | 3/2.0 | 1,400 (0%) | 1mo | $250,000 | $179 | 95 |
| 8456 Southern Springs Blvd | 0.04mi | 3/2.0 | 1,400 (0%) | 3mo | $264,500 | $189 | 92 |
| 8438 Southern Springs Dr | 0.12mi | 3/2.0 | 1,400 (0%) | 0mo | $262,500 | $188 | 90 |
| 8449 Southern Springs Blvd | 0.06mi | 3/2.0 | 1,418 (+1%) | 1mo | $278,000 | $196 | 90 |
| 8244 Amarillo Dr | 0.43mi | 3/2.0 | 1,410 (+1%) | 1mo | $280,000 | $199 | 74 |
| 8424 Southern Springs Way | 0.06mi | 3/2.0 | 1,200 (-14%) | 2mo | $257,000 | $214 | 68 |
| 5914 Edelle Dr | 0.64mi | 3/2.0 | 1,392 (-1%) | 2mo | $265,000 | $190 | 64 |
| 8042 Southern Trails Pl | 0.69mi | 3/2.0 | 1,410 (+1%) | 2mo | $290,000 | $206 | 60 |
| 8036 Southern Trails Pl | 0.70mi | 3/2.0 | 1,424 (+2%) | 3mo | $255,000 | $179 | 58 |
| 6032 Rockdell Dr | 0.49mi | 2/2.0 (-1) | 1,492 (+7%) | 1mo | $250,000 | $168 | 57 |
| 8452 Amarillo Dr | 0.44mi | 3/2.5 | 1,572 (+12%) | 2mo | $285,000 | $181 | 52 |
| 8433 Crosser Dr | 0.60mi | 3/2.0 | 1,572 (+12%) | 4mo | $253,000 | $161 | 45 |
Match score weights: distance 35% · size 25% · config 20% · recency 20%. Top-matched comps best support the ARV.
Projected returns pro-forma
-3.0% appreciation · 3.78% rent growth · sell at horizon
- IRR
- -16.2%
- Equity multiple
- 0.42×
- Total profit
- $-42,151
- Equity at exit
- $38,752
- IRR
- -6.7%
- Equity multiple
- 0.56×
- Total profit
- $-32,081
- Equity at exit
- $22,471
Cash invested: $72,772 (down + closing). Projections, not guarantees.
Landlord ↔ Tenant lean methodology
- Overall (STATE)
- 90 Strongly Landlord-Friendly
- State Indiana
- 90 Strongly Landlord-Friendly · R+11
- County
- — inherits STATE
- City
- — inherits STATE
ZIP-level market 46237
- Rents YoY
- 3.8%
- Active inventory
- 261
- Price-to-rent
- 10.3×
Monthly cashflow live
- Estimated rent
- $2,096 high interval (Pro) →
- Mortgage (P&I)
- −$1,363
- Tax from tax record
- −$188 /mo · $2,251/yr
- Insurance
- −$108
- HOA
- −$23
- Vacancy / Maint / Mgmt
- −$440
- Net cashflow
- $-26
Break-even live
UW: 25.0% down · 7.5% · 30yr · 1.5% tax · 5.0% vac · 8.0% maint · 8.0% mgmt
Financing live
Cash to close
- Down payment
- $64,975
- Closing costs
- $7,797
- Reserves months
- —
- Total cash needed
- —
Loan-product check · same deal, 3 products live
Conventional
25% down · 7.5% · 30yr
- Down + closing
- —
- Monthly P&I
- —
- Monthly cashflow
- —
- DSCR
- —
- Eligible?
- —
Personal DTI + credit; lowest rate.
DSCR
20% down · 8.5% · 30yr
- Down + closing
- —
- Monthly P&I
- —
- Monthly cashflow
- —
- DSCR
- —
- Eligible?
- —
No personal income docs; deal must DSCR.
Hard money
10% down · 12.0% · 12mo
- Down + closing
- —
- Monthly P&I
- —
- Monthly cashflow
- —
- DSCR
- —
- Eligible?
- —
Short-term bridge; refi at stabilization.
Rent comps 13 comps
| Address | Beds | Baths | Sqft | Rent | $/sqft | DOM | Units | Dist |
|---|---|---|---|---|---|---|---|---|
| 5945 Arlo Dr Indianapolis, IN | 1.0–3.0 | 1.0–2.0 | 1092 | $2,020 | $1.85 | 1d | 12 | 0.16mi |
| 6404 Amarillo Way Indianapolis, IN | 3.0 | 2.0 | 1494 | $1,845 | $1.23 | 4d | 1 | 0.68mi |
| 7825 Jaclyn Dr Indianapolis, IN | 3.0 | 2.0 | 1244 | $1,875 | $1.51 | 4d | 1 | 0.71mi |
| 8107 Southern Trails Pl Indianapolis, IN | 4.0 | 2.0 | 1746 | $2,000 | $1.15 | 4d | 1 | 0.71mi |
| 7703 Janel Ct Indianapolis, IN | 4.0 | 2.5 | 1824 | $4,950 | $2.71 | 23d | 1 | 0.86mi |
| 7925 Carlington Rd Indianapolis, IN | 2.0 | 2.0 | 1455 | $2,079 | $1.43 | 1d | 17 | 0.92mi |
| 4701 Todd Rd Indianapolis, IN | 2.0 | 1.0–1.5 | 882 | $1,475 | $1.67 | 23d | 5 | 1.07mi |
| 6210 Carrie Cir Indianapolis, IN | 3.0 | 2.0 | 1226 | $1,890 | $1.54 | 4d | 1 | 1.15mi |
| 8120 Bravo Pl Apt 5 Indianapolis, IN | 2.0 | 1.5 | 947 | $1,235 | $1.30 | 23d | 1 | 1.17mi |
| 764 Greenwood Springs Dr Greenwood, IN | 1.0–2.0 | 1.0–2.0 | 663 | $1,912 | $2.88 | 1d | 13 | 1.19mi |
| 8035 Preidt Pl Indianapolis, IN | 2.0 | 1.0 | 947 | $1,235 | $1.30 | 23d | 1 | 1.19mi |
| 4545 Scarlet Oak Way Indianapolis, IN | 1.0–3.0 | 1.0–2.0 | 1101 | $2,061 | $1.87 | 1d | 16 | 1.44mi |
| 7251 Windsor Lakes Dr Indianapolis, IN | 1.0–3.0 | 1.0–2.0 | 1103 | $1,800 | $1.63 | 1d | 36 | 1.46mi |
HOA detail
- Monthly dues
- $23 · $276/yr
- Likely covers
- water
Listing history 2 events
-
2026-04-30status Pending
-
2026-04-22$259,900 Active
ⓘ Source: listings_history table (triggers on properties + properties_extension) + one-shot
backfill from property_details.listing_events for pre-trigger history.
Tax reassessment forecast IN · Partial reset (capped growth)
- Current annual tax
- $2,251 · $188/mo
- Projected year-2 tax
- $2,251 · $188/mo
- Expected delta
- $0/yr ($0/mo · 0.0%)
ⓘ Screening estimate from a state-policy table — verify with the county assessor before closing.
Climate risk First Street
- Flood 1/10 Low FEMA zone X (unshaded) · 0% chance over 30 yrs
- Wildfire 1/10 Low
- Heat 3/10 Moderate 7 d/yr ≥100°F today · 19 d/yr by 30 yrs out
- Wind 2/10 Low 100% chance of damaging wind over 30 yrs
- Air quality 2/10 Low 2 unhealthy d/yr today · 2 by 30 yrs out
Nearby sold comps map
Loading sold comps map…
Walkable amenities ~0.75 mi
Loading nearby amenities…
Taxation est. · year 1
- Rental income
- $25,152
- − Mortgage interest
- −$14,558
- − Property taxes
- −$2,251
- − Insurance
- −$1,300
- − Repairs & maintenance
- −$2,012
- − Management
- −$2,012
- − HOA
- −$276
- − Depreciation
- −$7,561
- Taxable loss
- −$4,818
- Est. tax savings @ 24.0%
- +$1,156
- After-tax cash flow
- $844/yr
For passive investors: Depreciation is non-cash, so a rental often shows a tax loss while cash-flowing — sheltering income. Rental losses are passive: they offset passive income freely, and up to $25,000/yr can offset ordinary (W-2) income if you actively participate and your MAGI is under $100k (phasing out to $0 by $150k); unused losses carry forward. On sale, claimed depreciation is recaptured at up to 25%, and gains may owe capital-gains tax (a 1031 exchange can defer both). Figures are a year-1 estimate at your 24.0% rate — not tax advice; consult a CPA.
Schools (NCES district)
- District
- Franklin Township Community School Corporation
- NCES district ID
- 1803750
- Math proficiency
- 42% ▼ -12.00%
- Reading proficiency
- 47% ▼ -6.00%
- Median HH income
- $67,825
- Composite
- 39.91/100
- National rank
- #3852
- State rank
- #87 of 301 in IN
Livability — Indianapolis city (balance)
No livability data for this city. (Only ~50 U.S. cities are tracked.)
Census & demographics
- Census place
- Indianapolis city (balance), IN
- County
- Marion County · 998,460 people
- City population
- 881,119
- Metro
- Indianapolis-Carmel-Anderson, IN
- Population (ZIP)
- 43,473
- Household income
- $79,078
- Rent vs Own
- Severe rent burden
- 1245.0
Population outlook (Marion County) Hauer SSP2
- Today (2025)
- 1,025,572 people
- By 2030
- 1,065,727 · +3.9%
- By 2040
- 1,141,577 · +11.3%
- By 2050
- 1,208,920 · +17.9%
- By 2075
- 1,367,288 · +33.3%
- By 2100
- 1,438,201 · +40.2%
Race, ethnicity, and origin ACS 2023
- Neighborhood character
- Predominantly White (71%)
- Race & ethnicity
- White 71% Asian 13% Hispanic / Latino 7% Two or more races 6% Black 5%
- Hispanic origin (detail)
- Mexican 6%
- Common ancestry
- Italian 2% Lithuanian 2% Romanian 2%
- Foreign-born
- 12% · Canada, Philippines
- Languages at home
- 84% English-only · Other Asian/Pacific 5% Spanish 5% Other Indo-European 4%
Political lean MEDSL · Marion
- 2024 margin
- Strong D (+27.7) · D 63.0% · R 35.3% · Other 1.7%
- 2008→2024 swing
- -0.7pp no change · 2008: 28.4pp · 2024: 27.7pp
- All cycles
- 2024: D+27.7 2020: D+29.1 2016: D+22.8 2012: D+22.2 2008: D+28.4
Not yet ingested
- Civics
- —
Market trends
- HPI YoY
- ▼ -180.33%
- Current HPI
- 238.9661
- Rent YoY
- ▲ 3.78%
- Metro
- Indianapolis-Carmel-Anderson, IN
- State GDP YoY
- ▲ 2.90%
- F500 in state
- 18
Industry mix (Fortune 500 HQ in IN)
| Industry | F500 HQs | Revenue |
|---|---|---|
| Industrial Machinery | 2 | $37B |
|
||
| Healthcare | 1 | $177B |
|
||
| Pharmaceuticals | 1 | $45B |
|
||
| Metals / Steel | 1 | $18B |
|
||
| Agriculture | 1 | $17B |
|
||
| Packaging | 1 | $12B |
|
||
Price history
2 events — show timeline
- 2026-04-30 Pending — MIBOR as Distributed by MLS Grid
- 2026-04-22 Listed $259,900 MIBOR as Distributed by MLS Grid
Property tax history
+6.0%/yrLatest (2025): $2,251 · -6.1% YoY. Source: county tax records.
Cash-flow waterfall
monthlySold comps — $/sqft
last 12 mo · ≤1 miLoading sold comps…