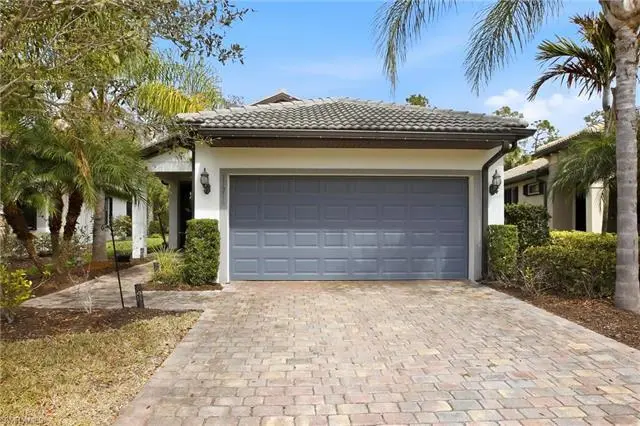
11216 Carlingford Rd · Fort Myers, FL
Flood risk 1/10 · Minimal
- FEMA flood zone
- X (unshaded)
- Chance of flooding over 30 yrs
- 0.0%
- Est. flood insurance / yr
- $507 – $1,088
Fire risk 3/10 · Minor
- Est. fire insurance / yr
- $947 – $1,759
Heat risk 9/10 · Severe
- Hot days now (above 107°F)
- 5 days/yr
- Hot days in 30 yrs
- 22 days/yr
Wind risk 10/10 · Severe
- Chance of severe wind over 30 yrs
- 99.0%
Air-quality risk 2/10 · Minimal
- Unhealthy air days now
- 1 days/yr
- Unhealthy air days in 30 yrs
- 1 days/yr
Risk factors via First Street. Map © Google.
Why this score? — see what drove the B- grade
The composite is a weighted blend of 9 inputs, each scored 0–100. Each bar is that input's sub-score; the figure is the points it added to the 100-point composite (weight × sub-score).
- Cash flow +24.4/30.0
- ARV discount +12.0/15.0
- DSCR +7.9/10.0
- 1% rule +7.6/10.0
- Livability +4.3/5.0
- Schools +4.1/10.0
- Rent growth +2.6/5.0
- Condition / age +2.5/5.0
- Appreciation +0.0/10.0
$369,900
🖨 Deal sheet (PDF) 📄 Offer letter ✓ Due diligence
Listing remarks
Seller is offering $1,000 in concessions with a strong offer! Welcome to this beautifully maintained 2-bedroom, 2-bath single-family home with a den, located in the highly desirable Bridgetown at The Plantation in Fort Myers. This residence features a thoughtfully designed open-concept floor plan ideal for both comfortable everyday living and entertaining. The versatile den offers the perfect flex space for a home office, guest room, or hobby area. The light-filled kitchen opens seamlessly to the living and dining areas, creating a warm and inviting atmosphere. The spacious primary suite includes a walk-in closet and a private en-suite bath, while the secondary bedroom and full bath provide
Key facts
- Versatile den
- Light-filled kitchen
- Walk-in closet
Tags
Property features AI
Finance
- Other: Property is in a community development district; Zoning: MDP-3; Lot is a regular lot with architectural and no-commercial/RV restrictions
- HOA & community: Mandatory HOA (professional management); Quarterly HOA fee; HOA covers cable, internet/WiFi access, manager, exterior pest control, recreation facilities, reserves, street lights and street maintenance; Community amenities include clubhouse, community pool and spa, exercise/fitness center (attended), tennis, pickleball, bocce, BBQ/picnic area and sidewalks; Gated community; Total annual recurring HOA fees listed; Total one-time HOA fees listed
Exterior
- Parking: Attached 2-car garage
- Security: Gated community
- Utilities: Central water; Central sewer; Electric service
- Home design: Residential single-family home; 1 story / ranch; Rear exposure facing south; Located in The Plantation / Bridgetown community
- Construction: Built in 2019; Concrete block construction; Stucco exterior; Tile roof; Casement, single-hung and sliding windows
- Exterior features: Patio; Screened lanai/porch; Preserve view; Reclaimed irrigation; Shutters (manual); Gated community
Interior
- Kitchen: Electric cooktop; Dishwasher; Disposal; Microwave; Refrigerator/Freezer
- Bedrooms: 2 bedrooms (split bedroom floor plan)
- Flooring: Carpet; Tile
- Bathrooms: 2 full bathrooms; Primary bath with dual sinks and shower
- Heating & cooling: Central electric heat; Central electric air conditioning
- Interior features: Smoke detectors; Dining area open to living room; Den / study; Guest bath; Guest room; Home office; Screened lanai/porch
- Laundry & utility: Washer and dryer in residence; Auto garage door
Neighborhood map
What this means for you Summary
Snapshot
- This is a 2-bed/2.0-bath single-family listed at $370k.
Deal economics
- At list price, monthly cash flow is $750 ($9k/yr) — positive.
- The deal already cash-flows at list — no discount required.
- Meets the 1% rule at list price ($5k rent vs $370k).
- Recommended offer: $337k (9.0% below list) — sets the bar for market timing.
- Cap rate 8.7% vs local median 3.0% in Fort Myers — top-decile yield for the area; either an underpriced asset or a hidden risk that comps aren't pricing in. Stress-test before assuming the spread holds.
Location & tenants
- Location reads 86/100 on livability (#14 in FL, #383 nationally) — a professional / high-income tenant draw. Strengths: amenities A+, commute A+, housing A+.
- Lee (suburban): math 47% / reading 50% proficiency, ranked #42 of 73 in FL (top 58%) — families likely to look elsewhere, expect single-tenant / working-renter base with shorter leases.
- Market conditions: Rents flat; 811 active listings in the ZIP; 40 comparable units currently listed for rent nearby; rentals at typical pace (median 25d on market — plan ~3-4 weeks tenant-placement turnaround); high-income renter base; 15,411 units permitted in Lee County in 2024 (4,686 in 5+ unit buildings).
- At $4,649/mo this rent would consume 51% of the median local household income ($110k/yr) (locally 276% of renters already pay >50% of income on rent) — very limited rent-growth headroom before tenants either downsize or default.
Forward outlook
- Local home prices are declining (-3.0%/yr); year-one equity from $3k of loan paydown is wiped out by about $11k of value loss. Plan a longer hold.
- Lee County population projected at +44% by 2050 — long-run rental-demand tailwind backs the buy-and-hold thesis.
Negotiation context
- It's been on market 93 days — a 9% lower offer ($337k) is reasonable based on typical stale-listing flexibility.
- 5 sale attempts since 2y ago; this cycle's ask has dropped $25k (6%) from the opening price — seller is motivated, your offer sets the floor, not the list.
Risks & watch-outs
- Climate carrying-cost: severe wind risk, 99% chance of damaging wind over 30y; extreme-heat days projected 5→22/yr by 2055 (HVAC capex compounding) — expect insurance premiums to compound above CPI over the hold.
Questions for the listing agent
- It's been on market 93 days. Have you received any prior offers? Is the seller open to a 9% concession, seller financing, or rate buy-down credit?
- What does the HOA fee cover, when was the last increase, and are there any pending special assessments or reserve-fund shortfalls?
- Why hasn't it sold? Are there any deal-killer items the seller is aware of (foundation, flood, title, zoning, code violations)?
- Is there a deadline driving the sale (1031 exchange, divorce, estate, relocation)? That informs how much negotiation room exists.
- What's the average days-on-market for RENTAL listings here right now (not sales)? A rising rental-DOM trend means longer vacancies and softer asking-rent achievability than the comps imply.
- What's the recent tenant-quality profile in this submarket — average credit score on applications, eviction rate, late-payment / NSF rate, and stable-employment percentage? A property-management company in the area should have these aggregated.
- How much new for-sale + rental construction is in the pipeline within 1–3 miles? Heavy new supply typically softens prices + rents 12–24 months out; constrained supply supports both.
Investment metrics
- 1% rule
- 1.26% ✓
- Cap rate
- 8.73%
- Cash-on-cash
- 8.69%
- DSCR
- 1.39
- GRM
- 6.6
CMA / ARV
- ARV (on-the-fly)
- $411,271
- Comps found
- 2
Show comp detail 2 sales within ~0.75 mi
| Address | Dist | Beds/Ba | Sqft | Sold | Price | $/sf | Match |
|---|---|---|---|---|---|---|---|
| 11253 Carlingford Rd | 0.09mi | 3/2.0 (+1) | 1,574 (+10%) | 22mo | $452,000 | $287 | 56 |
| 10610 Camarelle Cir | 0.56mi | 2/2.0 | 1,278 (-11%) | 2mo | $316,000 | $247 | 54 |
Match score weights: distance 35% · size 25% · config 20% · recency 20%. Top-matched comps best support the ARV.
Projected returns pro-forma
-3.0% appreciation · 0.37% rent growth · sell at horizon
- IRR
- -6.4%
- Equity multiple
- 0.77×
- Total profit
- $-23,882
- Equity at exit
- $55,153
- IRR
- -0.8%
- Equity multiple
- 0.95×
- Total profit
- $-4,777
- Equity at exit
- $31,982
Cash invested: $103,572 (down + closing). Projections, not guarantees.
Landlord ↔ Tenant lean methodology
- Overall (STATE)
- 87 Strongly Landlord-Friendly
- State Florida
- 87 Strongly Landlord-Friendly · R+3
- County
- — inherits STATE
- City
- — inherits STATE
ZIP-level market 33913
- Home prices YoY
- -10.3%
- Rents YoY
- 0.4%
- Active inventory
- 811
- Price-to-rent
- 6.6×
Monthly cashflow live
- Estimated rent
- $4,649 high interval (Pro) →
- Mortgage (P&I)
- −$1,940
- Tax from tax record
- −$370 /mo · $4,443/yr
- Insurance
- −$154
- HOA
- −$459
- Vacancy / Maint / Mgmt
- −$976
- Net cashflow
- $750
Break-even live
Sensitivity live
| Price | -10% $959 | -5% $854 | +0% $750 | +5% $645 | +10% $540 |
|---|---|---|---|---|---|
| Rent | -10% $382 | -5% $566 | +0% $750 | +5% $933 | +10% $1,117 |
| Rate | -1.0pp $936 | -0.5pp $844 | base $750 | +0.5pp $654 | +1.0pp $556 |
UW: 25.0% down · 7.5% · 30yr · 1.5% tax · 5.0% vac · 8.0% maint · 8.0% mgmt
Financing live
Cash to close
- Down payment
- $92,475
- Closing costs
- $11,097
- Reserves months
- —
- Total cash needed
- —
Loan-product check · same deal, 3 products live
Conventional
25% down · 7.5% · 30yr
- Down + closing
- —
- Monthly P&I
- —
- Monthly cashflow
- —
- DSCR
- —
- Eligible?
- —
Personal DTI + credit; lowest rate.
DSCR
20% down · 8.5% · 30yr
- Down + closing
- —
- Monthly P&I
- —
- Monthly cashflow
- —
- DSCR
- —
- Eligible?
- —
No personal income docs; deal must DSCR.
Hard money
10% down · 12.0% · 12mo
- Down + closing
- —
- Monthly P&I
- —
- Monthly cashflow
- —
- DSCR
- —
- Eligible?
- —
Short-term bridge; refi at stabilization.
Rent comps 40 comps
| Address | Beds | Baths | Sqft | Rent | $/sqft | DOM | Units | Dist |
|---|---|---|---|---|---|---|---|---|
| 10791 Palazzo Way #301 Fort Myers, FL | 2.0 | 2.0 | 1390 | $5,300 | $3.81 | 24d | 1 | 0.02mi |
| 10820 Palazzo Way #203 Fort Myers, FL | 2.0 | 2.0 | 1235 | $5,400 | $4.37 | 24d | 1 | 0.11mi |
| 10751 Palazzo Way #103 Fort Myers, FL | 2.0 | 2.0 | 1235 | $5,000 | $4.05 | 24d | 1 | 0.12mi |
| 10711 Palazzo Way Unit 203 Fort Myers, FL | 2.0 | 2.0 | 1257 | $5,300 | $4.22 | 22d | 1 | 0.17mi |
| 10711 Palazzo Way Fort Myers, FL | 2.0 | 2.0 | 1257 | $3,900 | $3.10 | 16d | 2 | 0.17mi |
| 10700 Palazzo Way #201 Fort Myers, FL | 2.0 | 2.0 | 1390 | $5,000 | $3.60 | 22d | 1 | 0.23mi |
| 11230 Suffield St Fort Myers, FL | 2.0 | 2.0 | 1560 | $8,500 | $5.45 | 24d | 1 | 0.25mi |
| 10529 Casella Way #102 Fort Myers, FL | 3.0 | 2.0 | 1722 | $4,500 | $2.61 | 24d | 1 | 0.31mi |
| 11343 Tiverton Trce Fort Myers, FL | 2.0 | 2.0 | 1685 | $4,000 | $2.37 | 4d | 1 | 0.32mi |
| 10520 Casella Way #101 Fort Myers, FL | 3.0 | 2.0 | 1722 | $7,000 | $4.07 | 24d | 1 | 0.35mi |
| 10602 Camarelle Cir Fort Myers, FL | 2.0 | 2.0 | 1690 | $5,500 | $3.25 | 24d | 1 | 0.56mi |
| 11701 Avingston Ter Fort Myers, FL | 2.0 | 2.0 | 1553 | $5,500 | $3.54 | 15d | 1 | 0.58mi |
| 10535 Carolina Willow Dr Fort Myers, FL | 3.0 | 2.0 | 1290 | $2,300 | $1.78 | 22d | 1 | 0.61mi |
| 10879 Rutherford Rd Fort Myers, FL | 2.0 | 2.0 | 1566 | $3,500 | $2.23 | 24d | 1 | 0.69mi |
| 10730 Cetrella Dr Fort Myers, FL | 3.0 | 2.0 | 1558 | $6,900 | $4.43 | 24d | 1 | 0.70mi |
| 10518 Avila Cir Fort Myers, FL | 2.0 | 2.0 | 1466 | $6,500 | $4.43 | 24d | 1 | 0.71mi |
| 10518 Avila Cir Fort Myers, FL | 2.0 | 2.0 | 1466 | $6,500 | $4.43 | 4d | 1 | 0.71mi |
| 10714 Cetrella Dr Fort Myers, FL | 2.0 | 2.0 | 1227 | $5,500 | $4.48 | 24d | 1 | 0.72mi |
| 10702 Cetrella Dr Fort Myers, FL | 2.0 | 2.0 | 1347 | $5,500 | $4.08 | 24d | 1 | 0.73mi |
| 10700 Cetrella Dr Fort Myers, FL | 2.0 | 2.0 | 1227 | $3,500 | $2.85 | 24d | 1 | 0.74mi |
| 11075 Lancewood St Fort Myers, FL | 3.0 | 2.0 | 1575 | $2,300 | $1.46 | 24d | 1 | 0.81mi |
| 11075 Lancewood St Fort Myers, FL | 3.0 | 2.0 | 1575 | $2,300 | $1.46 | 16d | 1 | 0.81mi |
| 10111 Colonial Country Club Blvd #2308 Fort Myers, FL | 2.0 | 2.0 | 1309 | $2,000 | $1.53 | 12d | 1 | 0.83mi |
| 10280 Crepe Jasmine Ln Unit 1546286P Fort Myers, FL | 3.0 | 2.0 | 1571 | $4,526 | $2.88 | 16d | 1 | 0.83mi |
| 10514 Bella Vista Dr Fort Myers, FL | 3.0 | 2.0 | 1823 | $6,500 | $3.57 | 24d | 1 | 0.86mi |
| 10428 Materita Dr Fort Myers, FL | 2.0 | 2.0 | 1568 | $6,250 | $3.99 | 24d | 1 | 0.87mi |
| 10112 Colonial Country Club Blvd #209 Fort Myers, FL | 2.0 | 2.0 | 1530 | $5,000 | $3.27 | 24d | 1 | 0.88mi |
| 10121 Colonial Country Club Blvd #1802 Fort Myers, FL | 2.0 | 2.0 | 1530 | $4,800 | $3.14 | 4d | 1 | 0.88mi |
| 11033 Mill Creek Way #202 Fort Myers, FL | 2.0 | 2.0 | 1379 | $5,400 | $3.92 | 24d | 1 | 0.90mi |
| 11041 Iron Horse Way Fort Myers, FL | 2.0 | 2.0 | 1692 | $4,000 | $2.36 | 24d | 1 | 0.92mi |
| 10020 Horse Creek Rd Fort Myers, FL | 2.0 | 2.0 | 1692 | $2,500 | $1.48 | 24d | 1 | 0.93mi |
| 10952 Clarendon St Fort Myers, FL | 2.0 | 2.0 | 1582 | $4,000 | $2.53 | 24d | 1 | 0.94mi |
| 11029 Mill Creek Way #405 Fort Myers, FL | 2.0 | 2.0 | 1749 | $2,500 | $1.43 | 24d | 1 | 0.96mi |
| 10128 Colonial Country Club Blvd #602 Fort Myers, FL | 2.0 | 2.0 | 1530 | $4,600 | $3.01 | 24d | 1 | 0.97mi |
| 10130 Colonial Country Club Blvd #707 Fort Myers, FL | 2.0 | 2.0 | 1116 | $4,900 | $4.39 | 24d | 1 | 0.99mi |
| 10908 Clarendon St Fort Myers, FL | 3.0 | 2.0 | 1433 | $8,000 | $5.58 | 15d | 1 | 1.01mi |
| 10908 Clarendon St Fort Myers, FL | 3.0 | 2.0 | 1433 | $8,000 | $5.58 | 24d | 1 | 1.01mi |
| 9918 Horse Creek Rd Fort Myers, FL | 3.0 | 2.0 | 1510 | $2,200 | $1.46 | 24d | 1 | 1.01mi |
| 10900 Glenhurst St Fort Myers, FL | 2.0 | 2.0 | 1355 | $2,200 | $1.62 | 3d | 1 | 1.03mi |
| 12020 Champions Green Way #112 Fort Myers, FL | 2.0 | 2.0 | 1056 | $2,000 | $1.89 | 12d | 1 | 1.04mi |
HOA detail
- Monthly dues
- $459 · $5,508/yr
Listing history 25 events
-
2026-06-17days on market $369,900 Active 93 DOM
-
2026-06-16days on market $369,900 Active 92 DOM
-
2026-06-15days on market $369,900 Active 91 DOM
-
2026-06-13days on market $369,900 Active 89 DOM
-
2026-06-10days on market $369,900 Active 86 DOM
-
2026-06-09days on market $369,900 Active 85 DOM
-
2026-06-07days on market $369,900 Active 83 DOM
-
2026-06-03days on market $369,900 Active 79 DOM
-
2026-06-02days on market $369,900 Active 78 DOM
-
2026-06-01days on market $369,900 Active 77 DOM
-
2026-06-01days on market $369,900 Active 76 DOM
-
2026-05-13price $369,900
-
2026-04-01price $370,000
-
2026-03-16$395,000 Active
-
2025-07-12historical
-
2025-05-19price $448,999
-
2025-03-18$449,999 Active
-
2024-12-04historical $2,995
-
2024-12-03historical
-
2024-11-05price $2,995
-
2024-11-02$3,000
-
2024-07-13historical $3,000
-
2024-06-05$3,000
-
2024-04-02price $469,999
-
2024-03-04$474,999 Active
ⓘ Source: listings_history table (triggers on properties + properties_extension) + one-shot
backfill from property_details.listing_events for pre-trigger history.
Tax reassessment forecast FL · Resets to sale price
- Current annual tax
- $4,443 · $370/mo
- Projected year-2 tax
- $4,443 · $370/mo
- Expected delta
- $0/yr ($0/mo · 0.0%)
ⓘ Screening estimate from a state-policy table — verify with the county assessor before closing.
Climate risk First Street
- Flood 1/10 Low FEMA zone X (unshaded) · 0% chance over 30 yrs
- Wildfire 3/10 Moderate
- Heat 9/10 Extreme 5 d/yr ≥107°F today · 22 d/yr by 30 yrs out
- Wind 10/10 Extreme 99% chance of damaging wind over 30 yrs
- Air quality 2/10 Low 1 unhealthy d/yr today · 1 by 30 yrs out
Nearby sold comps map
Loading sold comps map…
Walkable amenities ~0.75 mi
Loading nearby amenities…
Taxation est. · year 1
- Rental income
- $55,791
- − Mortgage interest
- −$20,720
- − Property taxes
- −$4,443
- − Insurance
- −$1,850
- − Repairs & maintenance
- −$4,463
- − Management
- −$4,463
- − HOA
- −$5,508
- − Depreciation
- −$10,761
- Taxable income
- $3,583
- Est. tax owed @ 24.0%
- −$860
- After-tax cash flow
- $8,137/yr
For passive investors: Depreciation is non-cash, so a rental often shows a tax loss while cash-flowing — sheltering income. Rental losses are passive: they offset passive income freely, and up to $25,000/yr can offset ordinary (W-2) income if you actively participate and your MAGI is under $100k (phasing out to $0 by $150k); unused losses carry forward. On sale, claimed depreciation is recaptured at up to 25%, and gains may owe capital-gains tax (a 1031 exchange can defer both). Figures are a year-1 estimate at your 24.0% rate — not tax advice; consult a CPA.
Schools (NCES district)
- District
- Lee
- NCES district ID
- 1201080
- Math proficiency
- 47% ▼ -11.00%
- Reading proficiency
- 50% ▼ -4.00%
- Median HH income
- $49,518
- Composite
- 41.49/100
- National rank
- #3458
- State rank
- #42 of 73 in FL
Livability — Fort Myers
- Score
- 86/100
- State rank
- #14
- US rank
- #383
Category grades
Schools grade is shown separately in the Schools card above.
Census & demographics
- Census place
- Fort Myers, FL
- County
- Lee County · 788,662 people
- City population
- 278,598
- Metro
- Cape Coral-Fort Myers, FL
- Population (ZIP)
- 31,538
- Household income
- $110,373
- Rent vs Own
- Severe rent burden
- 276.0
Population outlook (Lee County) Hauer SSP2
- Today (2025)
- 871,946 people
- By 2030
- 955,468 · +9.6%
- By 2040
- 1,113,587 · +27.7%
- By 2050
- 1,256,891 · +44.1%
- By 2075
- 1,560,270 · +78.9%
- By 2100
- 1,726,848 · +98.0%
Race, ethnicity, and origin ACS 2023
- Neighborhood character
- Predominantly White (74%)
- Race & ethnicity
- White 74% Hispanic / Latino 13% Two or more races 11% Black 5% Asian 2%
- Hispanic origin (detail)
- Mexican 3% Puerto Rican 3% Cuban 2%
- Common ancestry
- Romanian 5% Lithuanian 3% Slovak 2%
- Foreign-born
- 14% · Canada, Vietnam, China
- Languages at home
- 84% English-only · Spanish 10% Other Indo-European 2% French/Haitian/Cajun 2%
Political lean MEDSL · Lee
- 2024 margin
- Strong R (+28.4) · D 35.5% · R 63.9%
- 2008→2024 swing
- -18.0pp toward R · 2008: -10.4pp · 2024: -28.4pp
- All cycles
- 2024: R+28.4 2020: R+19.2 2016: R+20.4 2012: R+16.6 2008: R+10.4
Not yet ingested
- Civics
- —
Market trends
- HPI YoY
- ▼ -25.45%
- Current HPI
- 221.7115
- Rent YoY
- ▲ 0.37%
- Metro
- Cape Coral-Fort Myers, FL
- State GDP YoY
- ▲ 3.28%
- F500 in state
- 36
Industry mix (Fortune 500 HQ in FL)
| Industry | F500 HQs | Revenue |
|---|---|---|
| Industrial Technology | 2 | $29B |
|
||
| Insurance | 2 | $17B |
|
||
| Retail | 1 | $60B |
|
||
| Technology Distribution | 1 | $58B |
|
||
| Homebuilding | 1 | $35B |
|
||
| Technology Manufacturing | 1 | $35B |
|
||
Price history
-22.1% since first listed14 events — show timeline
- 2026-05-13 Price Changed $369,900 NAPLESMLS
- 2026-04-01 Price Changed $370,000 NAPLESMLS
- 2026-03-16 Listed $395,000 NAPLESMLS
- 2025-07-12 Listing Removed — NAPLESMLS
- 2025-05-19 Price Changed $448,999 NAPLESMLS
- 2025-03-18 Listed $449,999 NAPLESMLS
- 2024-12-04 Rental Removed $2,995 NAPLESMLS
- 2024-12-03 Listing Removed — NAPLESMLS
- 2024-11-05 Price Changed $2,995 NAPLESMLS
- 2024-11-02 Listed for Rent $3,000 NAPLESMLS
- 2024-07-13 Rental Removed $3,000 NAPLESMLS
- 2024-06-05 Listed for Rent $3,000 NAPLESMLS
- 2024-04-02 Price Changed $469,999 NAPLESMLS
- 2024-03-04 Listed $474,999 NAPLESMLS
Property tax history
+26.7%/yrLatest (2025): $4,443 · +2.3% YoY. Source: county tax records.
Cash-flow waterfall
monthlySold comps — $/sqft
last 12 mo · ≤1 miLoading sold comps…