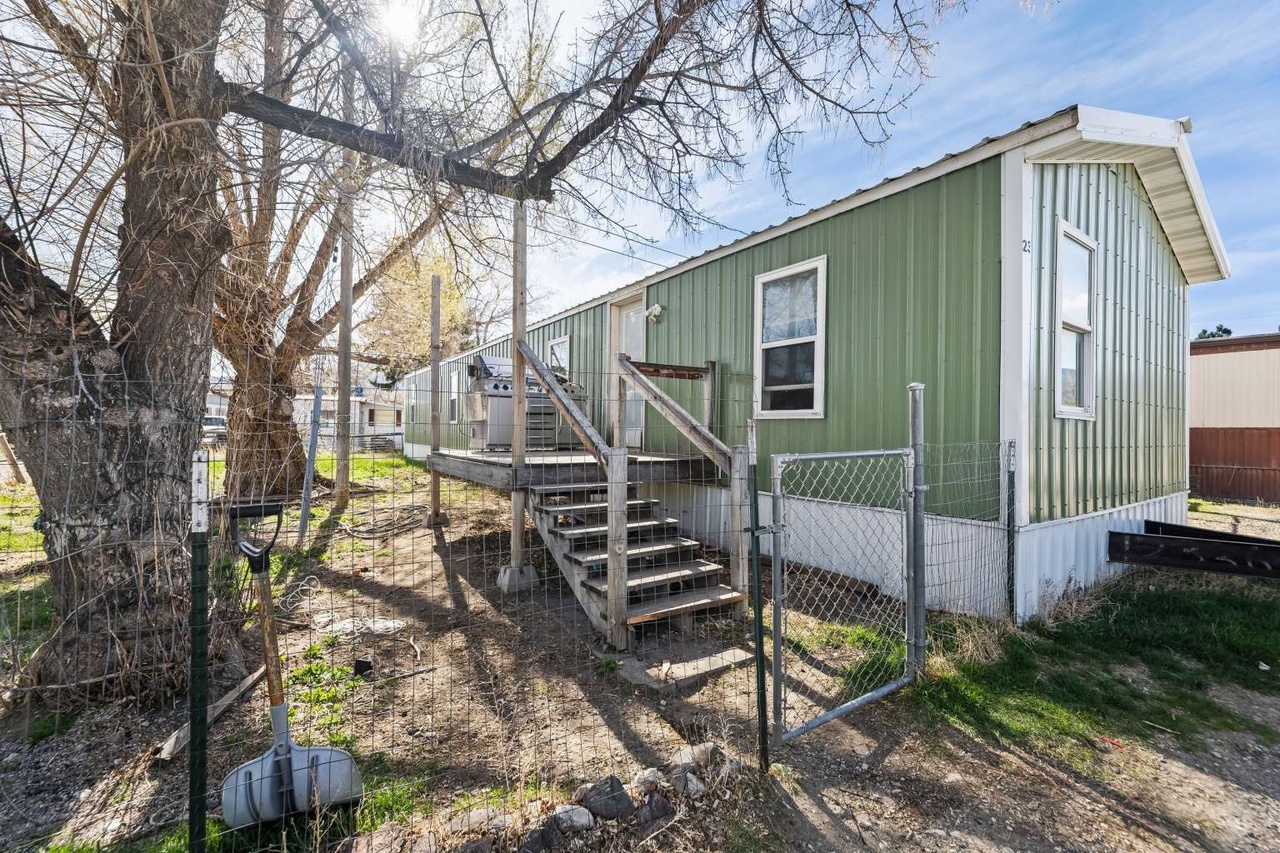
1 View Vista Dr #23 · Livingston, MT
Flood risk 5/10 · Moderate
- FEMA flood zone
- X (shaded)
- Chance of flooding over 30 yrs
- 0.45%
- Est. flood insurance / yr
- $507 – $1,088
Fire risk 6/10 · Moderate
- Est. fire insurance / yr
- $918 – $1,706
Heat risk 2/10 · Minimal
- Hot days now (above 89°F)
- 7 days/yr
- Hot days in 30 yrs
- 15 days/yr
Wind risk 1/10 · Minimal
- Chance of severe wind over 30 yrs
- —
Air-quality risk 4/10 · Minor
- Unhealthy air days now
- 5 days/yr
- Unhealthy air days in 30 yrs
- 7 days/yr
Risk factors via First Street. Map © Google.
Why this score? — see what drove the B grade
The composite is a weighted blend of 9 inputs, each scored 0–100. Each bar is that input's sub-score; the figure is the points it added to the 100-point composite (weight × sub-score).
- Cash flow +30.0/30.0
- 1% rule +10.0/10.0
- DSCR +10.0/10.0
- ARV discount +7.5/15.0
- Schools +4.0/10.0
- Livability +3.9/5.0
- Rent growth +3.7/5.0
- Condition / age +2.5/5.0
- Appreciation +0.0/10.0
$44,000
🖨 Deal sheet 📄 Offer letter ✓ Due diligence
Key facts
- New metal roof
- New metal siding
- Quiet lot
Tags
Property features AI
Finance
- Other: Located in View Vista Community
- Financial info: Annual property tax approximately $200
- HOA & community: Homeowners association with monthly fee of $400; HOA fee includes sewer, trash, and water; No association amenities listed
Exterior
- Home design: Manufactured home (single wide); One story
- Construction: Foundation: See remarks
- Exterior features: Has view
Interior
- Kitchen: Range; Refrigerator
- Bathrooms: 1 full bathroom
- Interior features: Range; Refrigerator; No basement
- Laundry & utility: Washer hookup
Neighborhood map
What this means for you Summary
Snapshot
- This is a 2-bed/1.0-bath manufactured listed at $44k.
Deal economics
- At list price, monthly cash flow is $536 ($6k/yr) — positive.
- The deal already cash-flows at list — no discount required.
- Meets the 1% rule at list price ($2k rent vs $44k).
- Recommended offer: $43k (3.0% below list) — sets the bar for market timing.
- Cap rate 20.9% vs local median 2.9% in Livingston — top-decile yield for the area; either an underpriced asset or a hidden risk that comps aren't pricing in. Stress-test before assuming the spread holds.
Location & tenants
- Location reads 77/100 on livability (#23 in MT, #2,898 nationally) — a middle-class / working-renter tenant base. Strengths: amenities A+, cost of living A+, health & safety A+; Watch: employment C-, crime F, commute F.
- Park H S (town): math 35% / reading 55% proficiency, ranked #113 of 339 in MT (top 33%) — families likely to look elsewhere, expect single-tenant / working-renter base with shorter leases.
- Market conditions: Rents rising fast (+4.9%/yr); 139 active listings in the ZIP; 7 comparable units currently listed for rent nearby; rentals at typical pace (median 21d on market — plan ~3-4 weeks tenant-placement turnaround); 39 units permitted in Park County in 2024 (0 in 5+ unit buildings).
Forward outlook
- Local home prices are declining (-3.0%/yr); year-one equity from $304 of loan paydown is wiped out by about $1k of value loss. Plan a longer hold.
- Park County population projected at +10% by 2050 — modest demand growth; plan on rents tracking national, not racing it.
- At projected returns (-3.0% appreciation + 4.9% rent growth), your $12k cash investment doubles in ~3 years — after that, you're playing with house money.
Negotiation context
- It's been on market 33 days — a 3% lower offer ($43k) is reasonable based on typical stale-listing flexibility.
Risks & watch-outs
- Watch-outs: HOA is 25% of rent.
- Climate carrying-cost: moderate flood risk; major wildfire risk — expect insurance premiums to compound above CPI over the hold.
Questions for the listing agent
- It's been on market 33 days. Have you received any prior offers? Is the seller open to a 3% concession, seller financing, or rate buy-down credit?
- What does the HOA fee cover, when was the last increase, and are there any pending special assessments or reserve-fund shortfalls?
- Is there a deadline driving the sale (1031 exchange, divorce, estate, relocation)? That informs how much negotiation room exists.
- Crime grade is F in this area — have there been break-ins, vandalism, or insurance claims at this property in the last 3 years? What carrier currently insures it and at what premium?
- What's the average days-on-market for RENTAL listings here right now (not sales)? A rising rental-DOM trend means longer vacancies and softer asking-rent achievability than the comps imply.
- What's the recent tenant-quality profile in this submarket — average credit score on applications, eviction rate, late-payment / NSF rate, and stable-employment percentage? A property-management company in the area should have these aggregated.
- How much new for-sale + rental construction is in the pipeline within 1–3 miles? Heavy new supply typically softens prices + rents 12–24 months out; constrained supply supports both.
Investment metrics
- 1% rule
- 3.57% ✓
- Cap rate
- 20.92%
- Cash-on-cash
- 52.25%
- DSCR
- 3.32
- GRM
- 2.3
CMA / ARV
No comps found within radius.
Projected returns pro-forma
-3.0% appreciation · 4.91% rent growth · sell at horizon
- IRR
- 53.6%
- Equity multiple
- 3.47×
- Total profit
- $30,377
- Equity at exit
- $6,561
- IRR
- 59.9%
- Equity multiple
- 7.87×
- Total profit
- $84,657
- Equity at exit
- $3,804
Cash invested: $12,320 (down + closing). Projections, not guarantees.
Landlord ↔ Tenant lean methodology
- Overall (STATE)
- 82 Strongly Landlord-Friendly
- State Montana
- 82 Strongly Landlord-Friendly · R+11
- County
- — inherits STATE
- City
- — inherits STATE
ZIP-level market 59047
- Rents YoY
- 4.9%
- Active inventory
- 139
- Price-to-rent
- 2.3×
Monthly cashflow live
- Estimated rent
- $1,570 high interval (Pro) →
- Mortgage (P&I)
- −$231
- Tax est. 1.5%
- −$55 /mo · $660/yr
- Insurance
- −$18
- HOA
- −$400
- Vacancy / Maint / Mgmt
- −$330
- Net cashflow
- $536
Break-even live
UW: 25.0% down · 7.5% · 30yr · 1.5% tax · 5.0% vac · 8.0% maint · 8.0% mgmt
Financing live
Cash to close
- Down payment
- $11,000
- Closing costs
- $1,320
- Reserves months
- —
- Total cash needed
- —
Loan-product check · same deal, 3 products live
Conventional
25% down · 7.5% · 30yr
- Down + closing
- —
- Monthly P&I
- —
- Monthly cashflow
- —
- DSCR
- —
- Eligible?
- —
Personal DTI + credit; lowest rate.
DSCR
20% down · 8.5% · 30yr
- Down + closing
- —
- Monthly P&I
- —
- Monthly cashflow
- —
- DSCR
- —
- Eligible?
- —
No personal income docs; deal must DSCR.
Hard money
10% down · 12.0% · 12mo
- Down + closing
- —
- Monthly P&I
- —
- Monthly cashflow
- —
- DSCR
- —
- Eligible?
- —
Short-term bridge; refi at stabilization.
Rent comps 7 comps
| Address | Beds | Baths | Sqft | Rent | $/sqft | DOM | Units | Dist |
|---|---|---|---|---|---|---|---|---|
| 308 E Callender St Livingston, MT | 1.0 | 1.0 | 600 | $1,500 | $2.50 | 21d | 1 | 0.36mi |
| 219 W Callender St Livingston, MT | 2.0 | 1.0 | 682 | $1,300 | $1.91 | 14d | 4 | 0.40mi |
| 216 S H St Unit A Livingston, MT | 1.0 | 1.0 | 700 | $1,500 | $2.14 | 14d | 1 | 0.45mi |
| 105 N Yellowstone St #3 Livingston, MT | 2.0 | 1.0 | 852 | $1,750 | $2.05 | 21d | 1 | 0.49mi |
| 616 N 5th St Livingston, MT | 2.0 | 1.0 | 1000 | $1,475 | $1.48 | 21d | 1 | 0.90mi |
| 611 N N St Livingston, MT | 2.0 | 1.0 | 1100 | $1,650 | $1.50 | 21d | 1 | 1.14mi |
| 1101 Sweetgrass Ln Unit B Livingston, MT | 2.0 | 1.5 | 1000 | $2,000 | $2.00 | 21d | 1 | 1.42mi |
HOA detail
- Monthly dues
- $400 · $4,800/yr
Listing history 2 events
-
2026-05-07price $44,000
-
2026-04-24$45,000 Active
ⓘ Source: listings_history table (triggers on properties + properties_extension) + one-shot
backfill from property_details.listing_events for pre-trigger history.
Climate risk First Street
- Flood 5/10 Major FEMA zone X (shaded) · 45% chance over 30 yrs
- Wildfire 6/10 Major
- Heat 2/10 Low 7 d/yr ≥89°F today · 15 d/yr by 30 yrs out
- Wind 1/10 Low
- Air quality 4/10 Moderate 5 unhealthy d/yr today · 7 by 30 yrs out
Nearby sold comps map
Loading sold comps map…
Walkable amenities ~0.75 mi
Loading nearby amenities…
Taxation est. · year 1
- Rental income
- $18,842
- − Mortgage interest
- −$2,465
- − Property taxes
- −$660
- − Insurance
- −$220
- − Repairs & maintenance
- −$1,507
- − Management
- −$1,507
- − HOA
- −$4,800
- − Depreciation
- −$1,280
- Taxable income
- $6,403
- Est. tax owed @ 24.0%
- −$1,537
- After-tax cash flow
- $4,900/yr
For passive investors: Depreciation is non-cash, so a rental often shows a tax loss while cash-flowing — sheltering income. Rental losses are passive: they offset passive income freely, and up to $25,000/yr can offset ordinary (W-2) income if you actively participate and your MAGI is under $100k (phasing out to $0 by $150k); unused losses carry forward. On sale, claimed depreciation is recaptured at up to 25%, and gains may owe capital-gains tax (a 1031 exchange can defer both). Figures are a year-1 estimate at your 24.0% rate — not tax advice; consult a CPA.
Schools (NCES district)
- District
- Park H S
- NCES district ID
- 3020100
- Math proficiency
- 35% ▼ -5.00%
- Reading proficiency
- 55% ▼ -5.00%
- Median HH income
- $41,341
- Composite
- 39.99/100
- National rank
- #7893
- State rank
- #113 of 339 in MT
Livability — Livingston
- Score
- 77/100
- State rank
- #23
- US rank
- #2898
Category grades
Schools grade is shown separately in the Schools card above.
Census & demographics
- County
- Park County · 14,092 people
- City population
- 14,092
- Metro
- nan
- Population (ZIP)
- 14,092
- Household income
- $71,620
- Rent vs Own
- Severe rent burden
- 372.0
Population outlook (Park County) Hauer SSP2
- Today (2025)
- 17,186 people
- By 2030
- 17,667 · +2.8%
- By 2040
- 18,365 · +6.9%
- By 2050
- 18,927 · +10.1%
- By 2075
- 21,263 · +23.7%
- By 2100
- 23,093 · +34.4%
Race, ethnicity, and origin ACS 2023
- Neighborhood character
- Predominantly White (92%)
- Race & ethnicity
- White 92% Two or more races 5% Hispanic / Latino 3% Native American 2%
- Common ancestry
- Portuguese 9% Slovak 5% Italian 3%
- Foreign-born
- 2% · Canada
- Languages at home
- 97% English-only · Spanish 2% Other Indo-European 1%
Political lean MEDSL · Park
- 2024 margin
- Lean R (+7.7) · D 44.6% · R 52.3% · Other 3.1%
- 2008→2024 swing
- -5.4pp toward R · 2008: -2.3pp · 2024: -7.7pp
- All cycles
- 2024: R+7.7 2020: R+6.4 2016: R+14.9 2012: R+10.5 2008: R+2.3
Not yet ingested
- Civics
- —
Market trends
- HPI YoY
- ▼ -202.16%
- Current HPI
- 274.6444
- Rent YoY
- ▲ 4.91%
- Metro
- nan
- State GDP YoY
- ▲ 3.41%
- F500 in state
- 2
Industry mix (Fortune 500 HQ in MT)
| Industry | F500 HQs | Revenue |
|---|---|---|
| Technology / Analytics | 1 | $2B |
|
||
Price history
-2.2% since first listed2 events — show timeline
- 2026-05-07 Price Changed $44,000 MRMLS
- 2026-04-24 Listed $45,000 MRMLS
Cash-flow waterfall
monthlySold comps — $/sqft
last 12 mo · ≤1 miLoading sold comps…