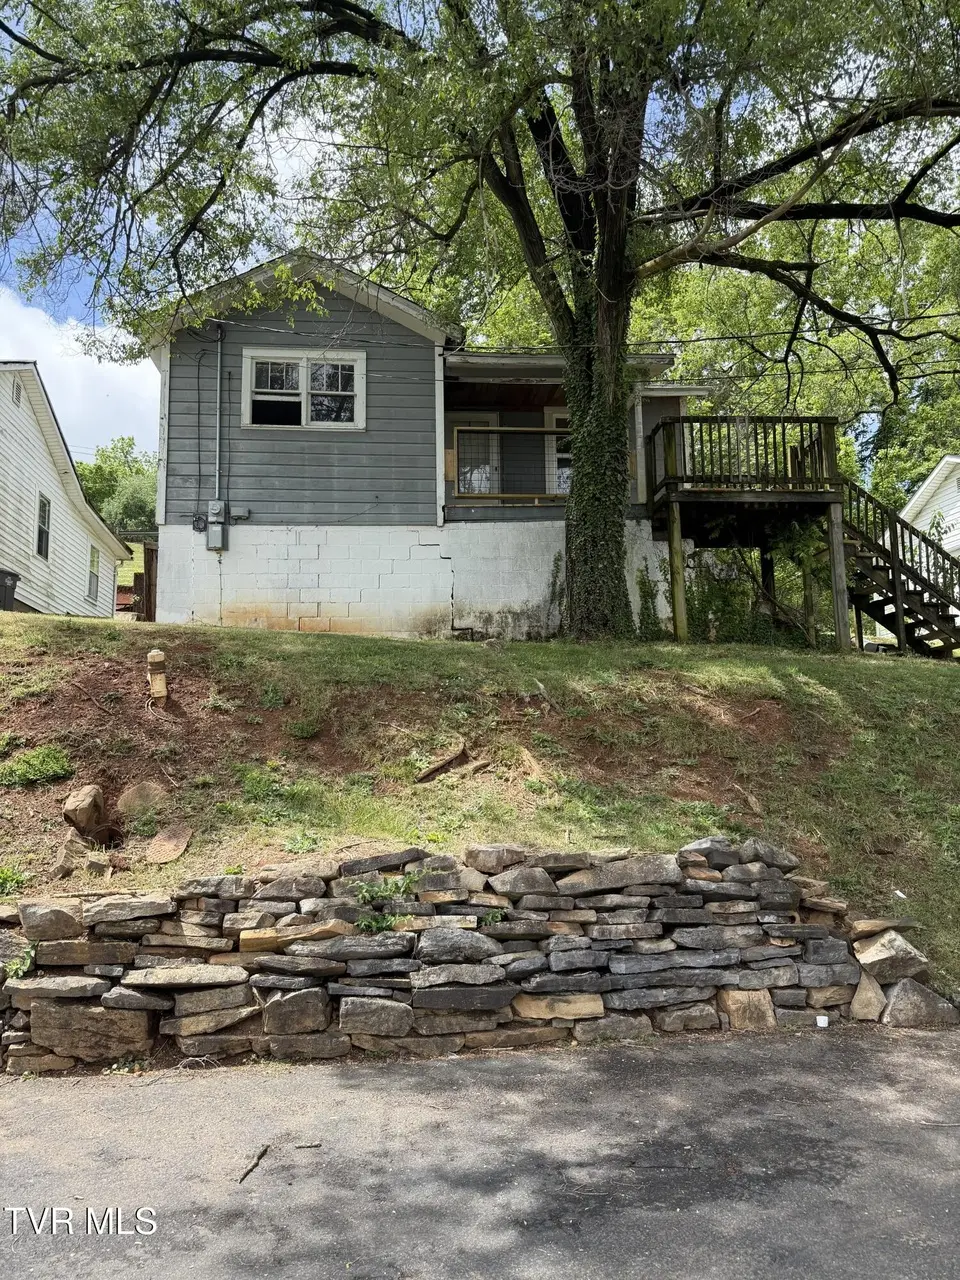
1044 Fairway Ave · Kingsport, TN
Flood risk 1/10 · Minimal
- FEMA flood zone
- X (unshaded)
- Chance of flooding over 30 yrs
- 0.0%
- Est. flood insurance / yr
- $507 – $1,088
Fire risk 2/10 · Minimal
- Est. fire insurance / yr
- $949 – $1,763
Heat risk 4/10 · Minor
- Hot days now (above 100°F)
- 6 days/yr
- Hot days in 30 yrs
- 15 days/yr
Wind risk 2/10 · Minimal
- Chance of severe wind over 30 yrs
- —
Air-quality risk 1/10 · Minimal
- Unhealthy air days now
- 0 days/yr
- Unhealthy air days in 30 yrs
- 0 days/yr
Risk factors via First Street. Map © Google.
Why this score? — see what drove the B grade
The composite is a weighted blend of 9 inputs, each scored 0–100. Each bar is that input's sub-score; the figure is the points it added to the 100-point composite (weight × sub-score).
- Cash flow +30.0/30.0
- 1% rule +10.0/10.0
- DSCR +10.0/10.0
- ARV discount +7.5/15.0
- Livability +3.6/5.0
- Schools +3.0/10.0
- Rent growth +2.5/5.0
- Condition / age +2.5/5.0
- Appreciation +1.3/10.0
$39,900
🖨 Deal sheet 📄 Offer letter ✓ Due diligence
Listing remarks
2 Bedroom, 1 Bath Fixer-Upper - Needs Repairs This 2-bedroom, 1-bath home is being sold as-is and is a solid project ready for renovation. Bedrooms feature wood-paneled walls, large windows flooding the rooms with natural light, perfect blank canvas for updates. Ideal for handy buyers or investors looking to create equity. Bring your tools and vision!
Key facts
- 9,147 sq ft lot
- Built 1938
- Listed 51 days
Property features AI
Exterior
- Utilities: Public water; Public sewer
- Home design: Single-family house; One story
- Construction: Vinyl siding; Shingle roof
- Exterior features: Front porch; Sloped lot; Subdivision: South Lynn Garden
Interior
- Kitchen: Eat-in kitchen
- Flooring: Vinyl
- Bathrooms: 1 full bathroom
- Heating & cooling: Has heating (see remarks)
- Interior features: Eat-in kitchen; Total of 5 rooms
- Laundry & utility: Washer hookup; Electric dryer hookup
Neighborhood map
What this means for you Summary
Snapshot
- This is a 2-bed/1.0-bath single-family listed at $40k.
Deal economics
- At list price, monthly cash flow is $642 ($8k/yr) — positive.
- The deal already cash-flows at list — no discount required.
- Meets the 1% rule at list price ($1k rent vs $40k).
- Recommended offer: $39k (3.0% below list) — sets the bar for market timing.
- Cap rate 25.6% vs local median 3.8% in Kingsport — top-decile yield for the area; either an underpriced asset or a hidden risk that comps aren't pricing in. Stress-test before assuming the spread holds.
Location & tenants
- Location reads 71/100 on livability (#39 in TN) — a middle-class / working-renter tenant base. Strengths: cost of living A+, health & safety A+, housing A; Watch: amenities C-, crime F, commute F.
- Kingsport (urban): math 35% / reading 38% proficiency, ranked #26 of 139 in TN (top 19%) — families likely to look elsewhere, expect single-tenant / working-renter base with shorter leases.
- Zoned schools: John F. Kennedy Elementary School (math 22% / reading 27%, grade F, #546 of 952 statewide, top 61%, 266 students, 0% FRL); Ross N. Robinson Middle School (math 42% / reading 40%, grade F, #37 of 333 statewide, top 12%, 955 students, 0% FRL); Dobyns - Bennett High School (math 23% / reading 56%, grade F, #28 of 332 statewide, top 9%, 2,514 students, 0% FRL) — zoned schools average 0% FRL vs 47% district-wide (47 pts lower); this property's tenant base skews higher-income than the district average.
- Market conditions: 30 active listings in the ZIP; 5 comparable units currently listed for rent nearby; rentals leasing fast (median 13d on market — plan ~1-2 weeks tenant-placement turnaround); 453 units permitted in Sullivan County in 2024 (6 in 5+ unit buildings).
Forward outlook
- Local home prices are declining (-3.0%/yr); year-one equity from $276 of loan paydown is wiped out by about $1k of value loss. Plan a longer hold.
- Sullivan County population projected to shrink 5% by 2050 — rents likely to lag national; underwrite the cash flow, not the appreciation.
- At projected returns (-3.0% appreciation + 3.0% rent growth), your $11k cash investment doubles in ~2 years — after that, you're playing with house money.
Negotiation context
- It's been on market 52 days — a 3% lower offer ($39k) is reasonable based on typical stale-listing flexibility.
- Current owner paid $16k; list at $40k implies a 149% gain — meaningful room to come down on a strong offer.
Risks & watch-outs
- Watch-outs: built in 1938 — expect roof / HVAC / electrical / plumbing capex.
Questions for the listing agent
- It's been on market 52 days. Have you received any prior offers? Is the seller open to a 3% concession, seller financing, or rate buy-down credit?
- Built in 1938 — when were the roof, HVAC, electrical panel, plumbing, and water heater last replaced?
- Is there a deadline driving the sale (1031 exchange, divorce, estate, relocation)? That informs how much negotiation room exists.
- Schools are D-rated, which usually means shorter tenancies and higher turnover. Who's the typical renter profile here, and what's been the actual vacancy rate?
- Crime grade is F in this area — have there been break-ins, vandalism, or insurance claims at this property in the last 3 years? What carrier currently insures it and at what premium?
- What's the average days-on-market for RENTAL listings here right now (not sales)? A rising rental-DOM trend means longer vacancies and softer asking-rent achievability than the comps imply.
- What's the recent tenant-quality profile in this submarket — average credit score on applications, eviction rate, late-payment / NSF rate, and stable-employment percentage? A property-management company in the area should have these aggregated.
- How much new for-sale + rental construction is in the pipeline within 1–3 miles? Heavy new supply typically softens prices + rents 12–24 months out; constrained supply supports both.
Investment metrics
- 1% rule
- 2.88% ✓
- Cap rate
- 25.60%
- Cash-on-cash
- 68.95%
- DSCR
- 4.07
- GRM
- 2.9
CMA / ARV
- ARV (on-the-fly)
- $89,646
- Comps found
- 6
Show comp detail 6 sales within ~0.75 mi
| Address | Dist | Beds/Ba | Sqft | Sold | Price | $/sf | Match |
|---|---|---|---|---|---|---|---|
| 325 Virgil Ave | 0.25mi | 2/1.0 | 624 (-7%) | 4mo | $110,000 | $176 | 74 |
| 1105 Tranbarger Dr | 0.36mi | 2/1.0 | 696 (+4%) | 7mo | $80,000 | $115 | 71 |
| 133 Mullins St | 0.31mi | 2/1.0 | 728 (+9%) | 16mo | $95,000 | $130 | 58 |
| 1508 Highpoint Ave | 0.73mi | 2/1.0 | 672 (+0%) | 12mo | $90,000 | $134 | 55 |
| 121 Mull St | 0.29mi | 2/1.0 | 768 (+15%) | 11mo | $50,000 | $65 | 53 |
| 429 Wilma St | 0.57mi | 2/1.0 | 768 (+15%) | 8mo | $150,000 | $195 | 42 |
Match score weights: distance 35% · size 25% · config 20% · recency 20%. Top-matched comps best support the ARV.
Projected returns pro-forma
-3.0% appreciation · 3.0% rent growth · sell at horizon
- IRR
- 68.4%
- Equity multiple
- 4.08×
- Total profit
- $34,429
- Equity at exit
- $5,949
- IRR
- 72.5%
- Equity multiple
- 8.40×
- Total profit
- $82,669
- Equity at exit
- $3,450
Cash invested: $11,172 (down + closing). Projections, not guarantees.
Landlord ↔ Tenant lean methodology
- Overall (STATE)
- 87 Strongly Landlord-Friendly
- State Tennessee
- 87 Strongly Landlord-Friendly · R+13
- County
- — inherits STATE
- City
- — inherits STATE
ZIP-level market 37665
- Home prices YoY
- -2.6%
- Active inventory
- 30
- Price-to-rent
- 2.9×
Monthly cashflow live
- Estimated rent
- $1,149 high interval (Pro) →
- Mortgage (P&I)
- −$209
- Tax from tax record
- −$40 /mo · $477/yr
- Insurance
- −$17
- HOA
- −$0
- Vacancy / Maint / Mgmt
- −$241
- Net cashflow
- $642
Break-even live
UW: 25.0% down · 7.5% · 30yr · 1.5% tax · 5.0% vac · 8.0% maint · 8.0% mgmt
Financing live
Cash to close
- Down payment
- $9,975
- Closing costs
- $1,197
- Reserves months
- —
- Total cash needed
- —
Loan-product check · same deal, 3 products live
Conventional
25% down · 7.5% · 30yr
- Down + closing
- —
- Monthly P&I
- —
- Monthly cashflow
- —
- DSCR
- —
- Eligible?
- —
Personal DTI + credit; lowest rate.
DSCR
20% down · 8.5% · 30yr
- Down + closing
- —
- Monthly P&I
- —
- Monthly cashflow
- —
- DSCR
- —
- Eligible?
- —
No personal income docs; deal must DSCR.
Hard money
10% down · 12.0% · 12mo
- Down + closing
- —
- Monthly P&I
- —
- Monthly cashflow
- —
- DSCR
- —
- Eligible?
- —
Short-term bridge; refi at stabilization.
Rent comps 5 comps
| Address | Beds | Baths | Sqft | Rent | $/sqft | DOM | Units | Dist |
|---|---|---|---|---|---|---|---|---|
| 1528 Lynn Garden Dr Unit 5 Kingsport, TN | 1.0 | 1.0 | 650 | $750 | $1.15 | 43d | 1 | 0.48mi |
| 1208 Riverside Ave Kingsport, TN | 2.0 | 1.0 | 690 | $1,500 | $2.17 | 20d | 1 | 0.85mi |
| 1200 Riverside Ave Kingsport, TN | 2.0 | 1.0 | 624 | $1,200 | $1.92 | 13d | 1 | 0.86mi |
| 124 Bloomingdale Pike Kingsport, TN | 1.0–2.0 | 1.0–1.5 | 878 | $1,300 | $1.48 | 13d | 1 | 1.10mi |
| 455 W Sullivan St Kingsport, TN | 1.0–3.0 | 1.0–2.0 | 988 | $1,647 | $1.67 | 13d | 16 | 1.42mi |
Listing history 20 events
-
2026-06-19days on market $39,900 Active 52 DOM
-
2026-06-18days on market $39,900 Active 51 DOM
-
2026-06-17days on market $39,900 Active 50 DOM
-
2026-06-16days on market $39,900 Active 49 DOM
-
2026-06-15days on market $39,900 Active 48 DOM
-
2026-06-14days on market $39,900 Active 46 DOM
-
2026-06-13days on market $39,900 Active 45 DOM
-
2026-06-10days on market $39,900 Active 43 DOM
-
2026-06-09days on market $39,900 Active 42 DOM
-
2026-06-08days on market $39,900 Active 41 DOM
-
2026-06-07days on market $39,900 Active 40 DOM
-
2026-06-05days on market $39,900 Active 37 DOM
-
2026-06-03days on market $39,900 Active 36 DOM
-
2026-06-02days on market $39,900 Active 35 DOM
-
2026-06-01days on market $39,900 Active 34 DOM
-
2026-05-31days on market $39,900 Active 33 DOM
-
2026-05-30days on market $39,900 Active 32 DOM
-
2026-04-28$39,900 Active
-
1993-09-01soldstatus $16,000
-
1990-02-15soldstatus $10,000
ⓘ Source: listings_history table (triggers on properties + properties_extension) + one-shot
backfill from property_details.listing_events for pre-trigger history.
Tax reassessment forecast TN · Resets to sale price
- Current annual tax
- $477 · $40/mo
- Projected year-2 tax
- $477 · $40/mo
- Expected delta
- $0/yr ($0/mo · 0.0%)
ⓘ Screening estimate from a state-policy table — verify with the county assessor before closing.
Climate risk First Street
- Flood 1/10 Low FEMA zone X (unshaded) · 0% chance over 30 yrs
- Wildfire 2/10 Low
- Heat 4/10 Moderate 6 d/yr ≥100°F today · 15 d/yr by 30 yrs out
- Wind 2/10 Low
- Air quality 1/10 Low 0 unhealthy d/yr today · 0 by 30 yrs out
Nearby sold comps map
Loading sold comps map…
Walkable amenities ~0.75 mi
Loading nearby amenities…
Taxation est. · year 1
- Rental income
- $13,785
- − Mortgage interest
- −$2,235
- − Property taxes
- −$477
- − Insurance
- −$200
- − Repairs & maintenance
- −$1,103
- − Management
- −$1,103
- − Depreciation
- −$1,161
- Taxable income
- $7,507
- Est. tax owed @ 24.0%
- −$1,802
- After-tax cash flow
- $5,901/yr
For passive investors: Depreciation is non-cash, so a rental often shows a tax loss while cash-flowing — sheltering income. Rental losses are passive: they offset passive income freely, and up to $25,000/yr can offset ordinary (W-2) income if you actively participate and your MAGI is under $100k (phasing out to $0 by $150k); unused losses carry forward. On sale, claimed depreciation is recaptured at up to 25%, and gains may owe capital-gains tax (a 1031 exchange can defer both). Figures are a year-1 estimate at your 24.0% rate — not tax advice; consult a CPA.
Schools (NCES district)
- District
- Kingsport
- NCES district ID
- 4702190
- Math proficiency
- 35% ▼ -12.00%
- Reading proficiency
- 38% ▼ -5.00%
- Median HH income
- $38,017
- Composite
- 30.44/100
- National rank
- #6233
- State rank
- #26 of 139 in TN
Livability — Kingsport
- Score
- 71/100
- State rank
- #39
- US rank
- #6587
Category grades
Schools grade is shown separately in the Schools card above.
Census & demographics
- Census place
- Kingsport, TN
- City population
- 83,493
- Population (ZIP)
- 5,156
Population outlook (Sullivan County) Hauer SSP2
- Today (2025)
- 157,030 people
- By 2030
- 156,415 · -0.4%
- By 2040
- 153,778 · -2.1%
- By 2050
- 149,018 · -5.1%
- By 2075
- 138,068 · -12.1%
- By 2100
- 119,927 · -23.6%
Race, ethnicity, and origin ACS 2023
- Neighborhood character
- Predominantly White (94%)
- Race & ethnicity
- White 94% Hispanic / Latino 4% Two or more races 3%
- Common ancestry
- Italian 6% Serbian 3% Slovak 1%
- Foreign-born
- 1% · Canada
- Languages at home
- 93% English-only · Spanish 7%
Political lean MEDSL · Sullivan
- 2024 margin
- Solid R (+55.0) · D 22.0% · R 77.0% · Other 1.0%
- 2008→2024 swing
- -13.6pp toward R · 2008: -41.3pp · 2024: -55.0pp
- All cycles
- 2024: R+55.0 2020: R+51.9 2016: R+56.2 2012: R+47.2 2008: R+41.3
Not yet ingested
- Civics
- —
Market trends
- HPI YoY
- ▼ -7.36%
- Current HPI
- 275.7692
- Rent YoY
- —
- Metro
- —
- State GDP YoY
- ▲ 2.78%
- F500 in state
- 22
Industry mix (Fortune 500 HQ in TN)
| Industry | F500 HQs | Revenue |
|---|---|---|
| Healthcare | 3 | $91B |
|
||
| Retail | 3 | $72B |
|
||
| Transportation / Logistics | 1 | $88B |
|
||
| Paper / Packaging | 1 | $19B |
|
||
| Insurance | 1 | $13B |
|
||
| Energy | 1 | $12B |
|
||
Price history
+299.0% since first listed3 events — show timeline
- 2026-04-28 Listed $39,900 TVRMLS
- 1993-09-01 Sold (Public Records) $16,000 Public Records
- 1990-02-15 Sold (Public Records) $10,000 Public Records
Property tax history
+5.1%/yrLatest (2025): $477 · +7.3% YoY. Source: county tax records.
Cash-flow waterfall
monthlySold comps — $/sqft
last 12 mo · ≤1 miLoading sold comps…