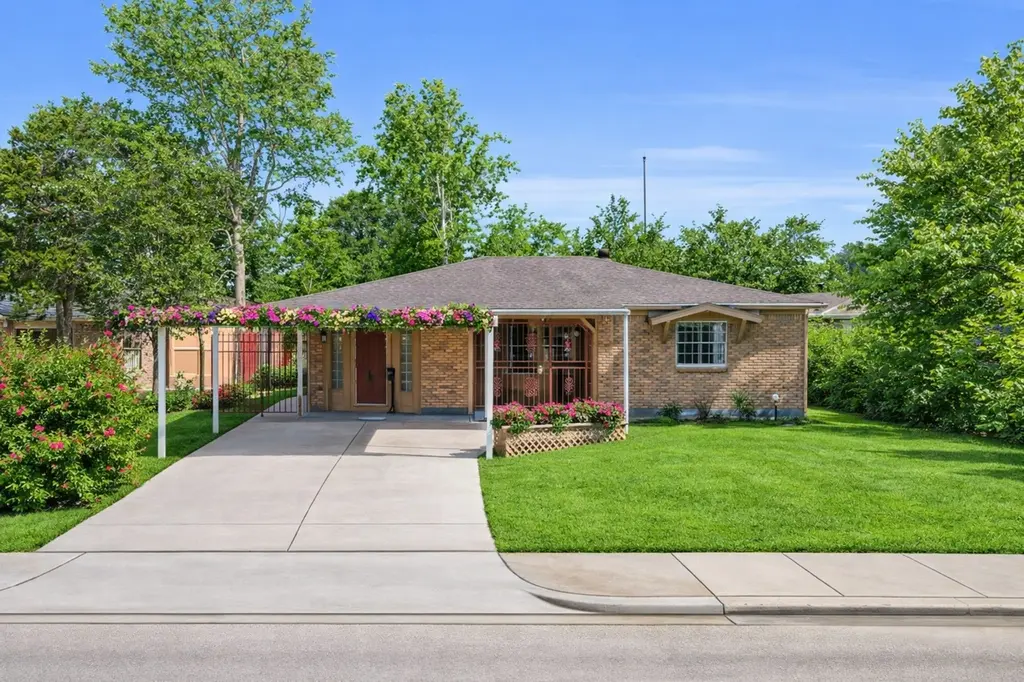
3922 Simsbrook Dr · Houston, TX
Flood risk 6/10 · Moderate
- FEMA flood zone
- X (unshaded)
- Chance of flooding over 30 yrs
- 0.67%
- Est. flood insurance / yr
- $507 – $1,088
Fire risk 1/10 · Minimal
- Est. fire insurance / yr
- $1,222 – $2,270
Heat risk 9/10 · Severe
- Hot days now (above 110°F)
- 7 days/yr
- Hot days in 30 yrs
- 24 days/yr
Wind risk 9/10 · Severe
- Chance of severe wind over 30 yrs
- 99.0%
Air-quality risk 2/10 · Minimal
- Unhealthy air days now
- 2 days/yr
- Unhealthy air days in 30 yrs
- 2 days/yr
Risk factors via First Street. Map © Google.
Why this score? — see what drove the D grade
The composite is a weighted blend of 9 inputs, each scored 0–100. Each bar is that input's sub-score; the figure is the points it added to the 100-point composite (weight × sub-score).
- Cash flow +13.3/30.0
- ARV discount +9.0/15.0
- DSCR +4.0/10.0
- 1% rule +3.7/10.0
- Livability +3.7/5.0
- Schools +2.7/10.0
- Condition / age +2.5/5.0
- Rent growth +1.9/5.0
- Appreciation +0.0/10.0
$199,000
🖨 Deal sheet 📄 Offer letter ✓ Due diligence
Listing remarks MLS
Great house to call HOME!! Come see this charming 3-4 bedroom home boasting new interior paint throughout, new light fixtures and celling fans! There is a 2 vehicle Car Port in the front of the home and a well built, detached Storage Shed in the back yard! Have Kids? This cozy abode is across the street from Montgomery Elementary School, only 2 miles to Lawson Middle School and about 8 blocks to Madison High School! Can't beat the location! The Galleria is 20 minutes away, Reliant Stadium 15 minutes away and Downtown Houston 25 minutes. All this home needs is you and your family. Come see it before its gone!
Key facts
- New light fixtures
- New interior paint
- 5,775 sq ft lot
Tags
Neighborhood map
What this means for you Summary
Snapshot
- This is a 3-bed/1.0-bath single-family listed at $199k.
Deal economics
- At list price, monthly cash flow is $0 ($0/yr) — positive.
- The deal already cash-flows at list — no discount required.
- To meet the 1% rule (rent ≥ 1% of price), the offer needs to be $172k (13.5% below list).
- Recommended offer: $172k (13.5% below list) — sets the bar for 1% rule.
- Cap rate 6.3% vs local median 3.2% in Houston — top-decile yield for the area; either an underpriced asset or a hidden risk that comps aren't pricing in. Stress-test before assuming the spread holds.
Location & tenants
- Location reads 74/100 on livability (#184 in TX, #4,771 nationally) — a middle-class / working-renter tenant base. Strengths: amenities A+, cost of living A+, housing A+; Watch: schools D, crime F.
- Houston ISD (urban): math 27% / reading 35% proficiency, ranked #593 of 826 in TX (top 72%) — families likely to look elsewhere, expect single-tenant / working-renter base with shorter leases; 71% free/reduced lunch — lower-income household profile, screen leases tightly.
- Market conditions: Rents soft (-2.4%/yr); 135 active listings in the ZIP; 11 comparable units currently listed for rent nearby; rentals at typical pace (median 22d on market — plan ~3-4 weeks tenant-placement turnaround); 29,883 units permitted in Harris County in 2024 (8,621 in 5+ unit buildings).
- This rent runs 35% of the median local income ($60k/yr) — at the standard rent-burdened threshold; future hikes will face affordability resistance.
Forward outlook
- Local home prices are declining (-3.0%/yr); year-one equity from $1k of loan paydown is wiped out by about $6k of value loss. Plan a longer hold.
- Harris County population projected at +47% by 2050 — long-run rental-demand tailwind backs the buy-and-hold thesis.
Negotiation context
- It's been on market 36 days — a 3% lower offer ($193k) is reasonable based on typical stale-listing flexibility.
Risks & watch-outs
- Climate carrying-cost: major flood risk; severe wind risk, 99% chance of damaging wind over 30y; extreme-heat days projected 7→24/yr by 2055 (HVAC capex compounding) — expect insurance premiums to compound above CPI over the hold.
Questions for the listing agent
- It's been on market 36 days. Have you received any prior offers? Is the seller open to a 13% concession, seller financing, or rate buy-down credit?
- Built in 1968 — when were the roof, HVAC, electrical panel, plumbing, and water heater last replaced?
- Is there a deadline driving the sale (1031 exchange, divorce, estate, relocation)? That informs how much negotiation room exists.
- Schools are D-rated, which usually means shorter tenancies and higher turnover. Who's the typical renter profile here, and what's been the actual vacancy rate?
- Crime grade is F in this area — have there been break-ins, vandalism, or insurance claims at this property in the last 3 years? What carrier currently insures it and at what premium?
- The area grade is low — what's the realistic commute time and amenity access for the typical tenant pool here? Any planned neighborhood developments (good or bad) we should know about?
- What's the average days-on-market for RENTAL listings here right now (not sales)? A rising rental-DOM trend means longer vacancies and softer asking-rent achievability than the comps imply.
- What's the recent tenant-quality profile in this submarket — average credit score on applications, eviction rate, late-payment / NSF rate, and stable-employment percentage? A property-management company in the area should have these aggregated.
- How much new for-sale + rental construction is in the pipeline within 1–3 miles? Heavy new supply typically softens prices + rents 12–24 months out; constrained supply supports both.
Investment metrics
- 1% rule
- 0.87% ✗
- Cap rate
- 6.29%
- Cash-on-cash
- 0.00%
- DSCR
- 1.00
- GRM
- 9.6
CMA / ARV
- ARV (median comp)
- $205,865
- List price
- $199,000
- Delta
- -3.33%
- Verdict
- FAIR
- Comps
- 20 within 1.0 mi
Show comp detail 12 sales within ~0.75 mi
| Address | Dist | Beds/Ba | Sqft | Sold | Price | $/sf | Match |
|---|---|---|---|---|---|---|---|
| 3922 Simsbrook Dr | 0.00mi | 3/1.5 | 1,220 (0%) | 0mo | $199,000 | $163 | 98 |
| 4002 Cloverbrook Dr | 0.06mi | 3/1.5 | 1,165 (-4%) | 1mo | $140,000 | $120 | 87 |
| 3906 Simsbrook Dr | 0.04mi | 3/2.0 | 1,227 (+1%) | 10mo | $230,000 | $187 | 84 |
| 3831 Cloverbrook Dr | 0.08mi | 3/1.5 | 1,262 (+3%) | 8mo | $125,000 | $99 | 82 |
| 3730 Heatherbrook Dr | 0.21mi | 4/1.5 (+1) | 1,278 (+5%) | 3mo | $205,000 | $160 | 73 |
| 3919 Darlinghurst Dr | 0.18mi | 3/1.5 | 1,368 (+12%) | 8mo | $210,000 | $154 | 63 |
| 3814 Prudence Dr | 0.30mi | 3/2.0 | 1,301 (+7%) | 12mo | $229,000 | $176 | 61 |
| 4214 Beran Dr | 0.74mi | 3/1.0 | 1,146 (-6%) | 2mo | $129,000 | $113 | 54 |
| 14410 Hiram Clarke Rd | 0.67mi | 3/1.0 | 1,103 (-10%) | 1mo | $79,000 | $72 | 52 |
| 4318 Boynton Dr | 0.67mi | 3/1.5 | 1,296 (+6%) | 12mo | $139,900 | $108 | 46 |
| 14411 Fleetwell Dr | 0.41mi | 3/2.0 | 1,049 (-14%) | 12mo | $197,500 | $188 | 43 |
| 3506 Prudence Dr | 0.54mi | 3/2.0 | 1,052 (-14%) | 8mo | $149,999 | $143 | 41 |
Match score weights: distance 35% · size 25% · config 20% · recency 20%. Top-matched comps best support the ARV.
Projected returns pro-forma
-3.0% appreciation · 0.0% rent growth · sell at horizon
- IRR
- -19.7%
- Equity multiple
- 0.33×
- Total profit
- $-37,273
- Equity at exit
- $29,672
- IRR
- -20.5%
- Equity multiple
- 0.07×
- Total profit
- $-51,885
- Equity at exit
- $17,206
Cash invested: $55,720 (down + closing). Projections, not guarantees.
Landlord ↔ Tenant lean methodology
- Overall (STATE)
- 87 Strongly Landlord-Friendly
- State Texas
- 87 Strongly Landlord-Friendly · R+5
- County
- — inherits STATE
- City
- — inherits STATE
ZIP-level market 77045
- Home prices YoY
- -7.4%
- Rents YoY
- -2.4%
- Active inventory
- 135
- Price-to-rent
- 9.6×
Monthly cashflow live
- Estimated rent
- $1,722 high interval (Pro) →
- Mortgage (P&I)
- −$1,044
- Tax from tax record
- −$234 /mo · $2,803/yr
- Insurance
- −$83
- HOA
- −$0
- Vacancy / Maint / Mgmt
- −$362
- Net cashflow
- $0
Break-even live
UW: 25.0% down · 7.5% · 30yr · 1.5% tax · 5.0% vac · 8.0% maint · 8.0% mgmt
Financing live
Cash to close
- Down payment
- $49,750
- Closing costs
- $5,970
- Reserves months
- —
- Total cash needed
- —
Loan-product check · same deal, 3 products live
Conventional
25% down · 7.5% · 30yr
- Down + closing
- —
- Monthly P&I
- —
- Monthly cashflow
- —
- DSCR
- —
- Eligible?
- —
Personal DTI + credit; lowest rate.
DSCR
20% down · 8.5% · 30yr
- Down + closing
- —
- Monthly P&I
- —
- Monthly cashflow
- —
- DSCR
- —
- Eligible?
- —
No personal income docs; deal must DSCR.
Hard money
10% down · 12.0% · 12mo
- Down + closing
- —
- Monthly P&I
- —
- Monthly cashflow
- —
- DSCR
- —
- Eligible?
- —
Short-term bridge; refi at stabilization.
Rent comps 11 comps
| Address | Beds | Baths | Sqft | Rent | $/sqft | DOM | Units | Dist |
|---|---|---|---|---|---|---|---|---|
| 3239 Kelling St Houston, TX | 4.0 | 2.0 | 1311 | $1,589 | $1.21 | 15d | 1 | 0.85mi |
| 3215 Boynton Dr Houston, TX | 4.0 | 2.0 | 1311 | $1,599 | $1.22 | 24d | 1 | 0.85mi |
| 14435 Acuna Ln Houston, TX | 3.0 | 2.0 | 1496 | $1,805 | $1.21 | 43d | 1 | 0.88mi |
| 3234 Kelling St Houston, TX | 4.0 | 2.0 | 1311 | $1,599 | $1.22 | 24d | 1 | 0.88mi |
| 3150 Kelling St Houston, TX | 4.0 | 2.0 | 1311 | $1,619 | $1.23 | 7d | 1 | 0.94mi |
| 3135 Kelling St Houston, TX | 4.0 | 2.0 | 1311 | $1,599 | $1.22 | 21d | 1 | 0.94mi |
| 3119 Kelling St Houston, TX | 4.0 | 2.0 | 1311 | $1,599 | $1.22 | 43d | 1 | 0.97mi |
| 15025 Alkay St Houston, TX | 3.0 | 2.0 | 1162 | $2,050 | $1.76 | 21d | 1 | 0.98mi |
| 3103 Kelling St Houston, TX | 4.0 | 2.0 | 1311 | $1,619 | $1.23 | 7d | 1 | 0.99mi |
| 12806 Buffalo Speedway Houston, TX | 1.0–2.0 | 1.0–2.0 | 916 | $1,636 | $1.79 | 1d | 18 | 1.31mi |
| 14002 Santa Teresa Rd Houston, TX | 4.0 | 1.5 | 864 | $1,197 | $1.39 | 43d | 1 | 1.47mi |
Listing history 4 events
-
2026-05-18status Pending 617-char remark
Show marketing remark (617 chars)
Great house to call HOME!! Come see this charming 3-4 bedroom home boasting new interior paint throughout, new light fixtures and celling fans! There is a 2 vehicle Car Port in the front of the home and a well built, detached Storage Shed in the back yard! Have Kids? This cozy abode is across the street from Montgomery Elementary School, only 2 miles to Lawson Middle School and about 8 blocks to Madison High School! Can't beat the location! The Galleria is 20 minutes away, Reliant Stadium 15 minutes away and Downtown Houston 25 minutes. All this home needs is you and your family. Come see it before its gone!
-
2026-05-05price $199,000 617-char remark
Show marketing remark (617 chars)
Great house to call HOME!! Come see this charming 3-4 bedroom home boasting new interior paint throughout, new light fixtures and celling fans! There is a 2 vehicle Car Port in the front of the home and a well built, detached Storage Shed in the back yard! Have Kids? This cozy abode is across the street from Montgomery Elementary School, only 2 miles to Lawson Middle School and about 8 blocks to Madison High School! Can't beat the location! The Galleria is 20 minutes away, Reliant Stadium 15 minutes away and Downtown Houston 25 minutes. All this home needs is you and your family. Come see it before its gone!
-
2026-04-10$225,000 Active 617-char remark
Show marketing remark (617 chars)
Great house to call HOME!! Come see this charming 3-4 bedroom home boasting new interior paint throughout, new light fixtures and celling fans! There is a 2 vehicle Car Port in the front of the home and a well built, detached Storage Shed in the back yard! Have Kids? This cozy abode is across the street from Montgomery Elementary School, only 2 miles to Lawson Middle School and about 8 blocks to Madison High School! Can't beat the location! The Galleria is 20 minutes away, Reliant Stadium 15 minutes away and Downtown Houston 25 minutes. All this home needs is you and your family. Come see it before its gone!
-
1988-01-02soldstatus
ⓘ Source: listings_history table (triggers on properties + properties_extension) + one-shot
backfill from property_details.listing_events for pre-trigger history.
Tax reassessment forecast TX · Resets to sale price
- Current annual tax
- $2,803 · $234/mo
- Projected year-2 tax
- $3,642 · $303/mo
- Expected delta
- +$839/yr (+$70/mo · 29.9%)
ⓘ Screening estimate from a state-policy table — verify with the county assessor before closing.
Climate risk First Street
- Flood 6/10 Major FEMA zone X (unshaded) · 67% chance over 30 yrs
- Wildfire 1/10 Low
- Heat 9/10 Extreme 7 d/yr ≥110°F today · 24 d/yr by 30 yrs out
- Wind 9/10 Extreme 99% chance of damaging wind over 30 yrs
- Air quality 2/10 Low 2 unhealthy d/yr today · 2 by 30 yrs out
Nearby sold comps map
Loading sold comps map…
Walkable amenities ~0.75 mi
Loading nearby amenities…
Taxation est. · year 1
- Rental income
- $20,659
- − Mortgage interest
- −$11,147
- − Property taxes
- −$2,803
- − Insurance
- −$995
- − Repairs & maintenance
- −$1,653
- − Management
- −$1,653
- − Depreciation
- −$5,789
- Taxable loss
- −$3,380
- Est. tax savings @ 24.0%
- +$811
- After-tax cash flow
- $812/yr
For passive investors: Depreciation is non-cash, so a rental often shows a tax loss while cash-flowing — sheltering income. Rental losses are passive: they offset passive income freely, and up to $25,000/yr can offset ordinary (W-2) income if you actively participate and your MAGI is under $100k (phasing out to $0 by $150k); unused losses carry forward. On sale, claimed depreciation is recaptured at up to 25%, and gains may owe capital-gains tax (a 1031 exchange can defer both). Figures are a year-1 estimate at your 24.0% rate — not tax advice; consult a CPA.
Schools (NCES district)
- District
- Houston ISD
- NCES district ID
- 4823640
- Math proficiency
- 27% ▼ -18.00%
- Reading proficiency
- 35% ▼ -6.00%
- Median HH income
- $46,054
- Composite
- 26.63/100
- National rank
- #7173
- State rank
- #593 of 826 in TX
Livability — Houston
- Score
- 74/100
- State rank
- #184
- US rank
- #4771
Category grades
Schools grade is shown separately in the Schools card above.
Census & demographics
- Census place
- Houston, TX
- County
- Harris County · 4,702,590 people
- City population
- 3,226,434
- Metro
- Houston-The Woodlands-Sugar Land, TX
- Population (ZIP)
- 33,563
- Household income
- $59,688
- Rent vs Own
- Severe rent burden
- 803.0
Population outlook (Harris County) Hauer SSP2
- Today (2025)
- 5,571,493 people
- By 2030
- 6,089,821 · +9.3%
- By 2040
- 7,142,806 · +28.2%
- By 2050
- 8,185,864 · +46.9%
- By 2075
- 10,574,329 · +89.8%
- By 2100
- 12,109,958 · +117.4%
Race, ethnicity, and origin ACS 2023
- Neighborhood character
- Diverse neighborhood (Simpson 0.56)
- Race & ethnicity
- Hispanic / Latino 54% Black 37% Two or more races 25% White 4% Asian 2% Native American 1%
- Hispanic origin (detail)
- Mexican 37%
- Common ancestry
- Ukrainian 1% Lithuanian 1%
- Foreign-born
- 23% · Canada, Jamaica, China
- Languages at home
- 47% English-only · Spanish 49% Arabic 2% Tagalog/Filipino 1%
Political lean MEDSL · Harris
- 2024 margin
- Lean D (+5.5) · D 52.0% · R 46.4% · Other 1.6%
- 2008→2024 swing
- +3.9pp toward D · 2008: 1.6pp · 2024: 5.5pp
- All cycles
- 2024: D+5.5 2020: D+13.3 2016: D+12.4 2012: D+0.1 2008: D+1.6
Not yet ingested
- Civics
- —
Market trends
- HPI YoY
- ▼ -22.49%
- Current HPI
- 282.5426
- Rent YoY
- ▼ -2.35%
- Metro
- Houston-The Woodlands-Sugar Land, TX
- State GDP YoY
- ▲ 3.95%
- F500 in state
- 110
Industry mix (Fortune 500 HQ in TX)
| Industry | F500 HQs | Revenue |
|---|---|---|
| Energy | 16 | $1,198B |
|
||
| Technology | 5 | $198B |
|
||
| Engineering / Construction | 4 | $72B |
|
||
| Energy Services | 3 | $60B |
|
||
| Utilities | 3 | $41B |
|
||
| Healthcare | 2 | $330B |
|
||
Price history
-11.6% since first listed4 events — show timeline
- 2026-05-18 Pending — HARMLS
- 2026-05-05 Price Changed $199,000 HARMLS
- 2026-04-10 Listed $225,000 HARMLS
- 1988-01-02 Sold (Public Records) — Public Records
Property tax history
+4.0%/yrLatest (2025): $2,803 · +11.6% YoY. Source: county tax records.
Cash-flow waterfall
monthlySold comps — $/sqft
last 12 mo · ≤1 miLoading sold comps…