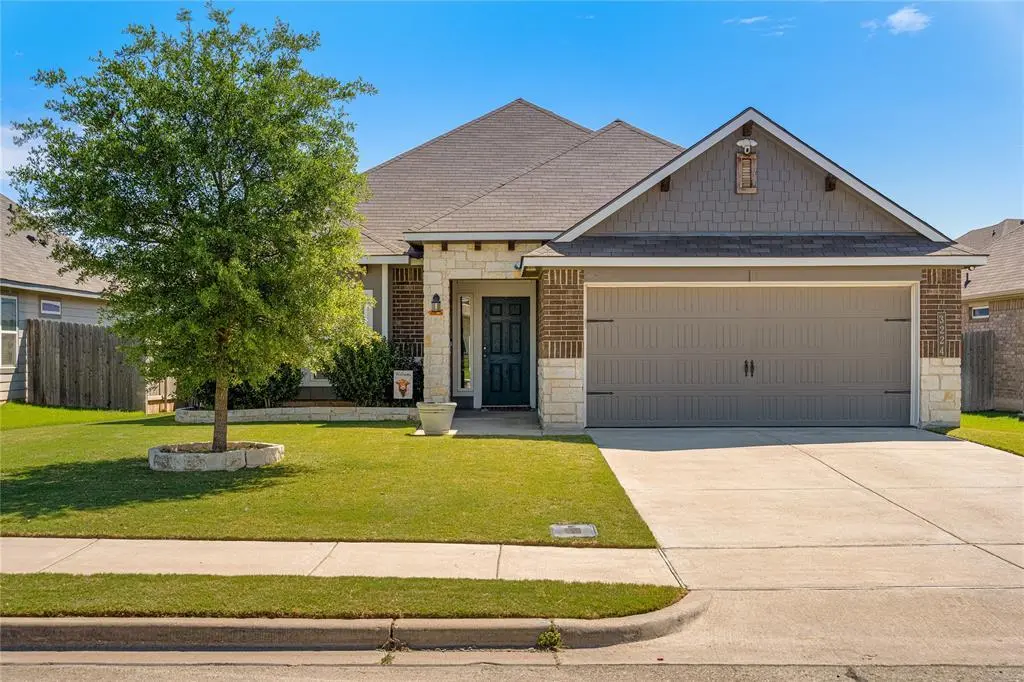
3224 Risinger Rd · Waco, TX
Flood risk 1/10 · Minimal
- FEMA flood zone
- X (unshaded)
- Chance of flooding over 30 yrs
- 0.0%
- Est. flood insurance / yr
- $507 – $1,088
Fire risk 3/10 · Minor
- Est. fire insurance / yr
- $1,222 – $2,270
Heat risk 7/10 · Major
- Hot days now (above 108°F)
- 7 days/yr
- Hot days in 30 yrs
- 24 days/yr
Wind risk 6/10 · Moderate
- Chance of severe wind over 30 yrs
- 66.0%
Air-quality risk 2/10 · Minimal
- Unhealthy air days now
- 0 days/yr
- Unhealthy air days in 30 yrs
- 1 days/yr
Risk factors via First Street. Map © Google.
Why this score? — see what drove the D grade
The composite is a weighted blend of 9 inputs, each scored 0–100. Each bar is that input's sub-score; the figure is the points it added to the 100-point composite (weight × sub-score).
- Cash flow +10.3/30.0
- ARV discount +7.5/15.0
- Schools +5.2/10.0
- Condition / age +4.0/5.0
- 1% rule +3.9/10.0
- Livability +3.7/5.0
- DSCR +2.9/10.0
- Rent growth +2.5/5.0
- Appreciation +0.0/10.0
$290,000
🖨 Deal sheet 📄 Offer letter ✓ Due diligence
Listing remarks
Welcome to this beautifully maintained 2020-built home nestled in the quiet Park Meadows neighborhood of Lorena! The open-concept design flows seamlessly from the kitchen into the living area. Cozy up by the fireplace on cool evenings or gather in the separate dining area for family meals. Both bathrooms feature stylish tile flooring, and the updated laundry room adds everyday convenience. A bonus hallway closet gives you the extra storage you didn't know you needed! Step outside and enjoy peaceful neighborhood living with a nearby park featuring a dedicated walking path, designed so you can exercise safely away from traffic. Minutes from top-rated Midway ISD schools, major retailers, and a
Key facts
- Open-concept design
- Tile flooring
- Updated laundry room
Tags
Property features AI
Finance
- Other: Subdivision: Park Meadows Add; Directions: From I-35, take Exit 330 toward Lorena. Head east, turn into Park Meadows subdivision. Follow to Risinger Road. Home will be on your right.
- HOA & community: Mandatory association; Annual HOA fee of $185 (includes water and sewer); HOA managed by Park Meadows Residential INC
Exterior
- Parking: Attached 2-car garage; 2 covered driveway spaces
- Utilities: City water; City sewer
- Home design: Single family residence; One story; Property attached: Yes
- Construction: Built in 2020; Brick construction; Composition roof
- Exterior features: Covered patio/porch
Interior
- Kitchen: Dishwasher; Electric oven
- Bedrooms: 3 bedrooms (primary bedroom on main level)
- Flooring: Luxury vinyl plank flooring
- Bathrooms: 2 full bathrooms
- Heating & cooling: One living area
- Interior features: Open floorplan; Kitchen island; Pantry; Granite counters; Window coverings
Neighborhood map
What this means for you Summary
Snapshot
- This is a 3-bed/2.0-bath single-family listed at $290k. Condition is rated good.
Deal economics
- At list price, monthly cash flow is $-160 ($-2k/yr) — negative.
- To cash-flow at today's rent, offer at most $262k (9.7% below list).
- To meet the 1% rule (rent ≥ 1% of price), the offer needs to be $257k (11.4% below list).
- Recommended offer: $257k (11.4% below list) — sets the bar for 1% rule.
- Cap rate 5.6% vs local median 3.9% in Waco — top-decile yield for the area; either an underpriced asset or a hidden risk that comps aren't pricing in. Stress-test before assuming the spread holds.
Location & tenants
- Location reads 74/100 on livability (#166 in TX, #4,378 nationally) — a middle-class / working-renter tenant base. Strengths: cost of living A+, housing A+, health & safety A+; Watch: crime D, commute F, employment D-.
- Midway ISD (other): math 61% / reading 58% proficiency, ranked #56 of 826 in TX (top 7%) — acceptable for families but not a draw, mixed tenant base, ~2y average lease.
- Zoned schools: Castleman Creek El (math 48% / reading 47%, grade D, #989 of 4,322 statewide, top 23%, 585 students, 51% FRL) — zoned schools average 51% FRL vs 28% district-wide (23 pts higher); higher-poverty schools than district average — tighter screening recommended.
- Zoned-school proficiency averages 48% at this address vs 60% district-wide (-12 pts) — the specific schools serving this property underperform the Midway ISD average; the district grade overstates school quality for this exact location.
- Market conditions: 265 active listings in the ZIP; 8 comparable units currently listed for rent nearby; rentals lingering (median 44d on market — plan ~5-8 weeks vacancy on turnover, expect pricing pressure); 75% of comp listings sitting > 30 days — soft ceiling on asking rent; solid renter incomes; 1,014 units permitted in McLennan County in 2024 (200 in 5+ unit buildings).
- This rent runs 31% of the median local income ($100k/yr) — at the standard rent-burdened threshold; future hikes will face affordability resistance.
Forward outlook
- Local home prices are declining (-3.0%/yr); year-one equity from $2k of loan paydown is wiped out by about $9k of value loss. Plan a longer hold.
- McLennan County population projected at +17% by 2050 — long-run rental-demand tailwind backs the buy-and-hold thesis.
Negotiation context
- It's been on market 71 days — a 6% lower offer ($273k) is reasonable based on typical stale-listing flexibility.
- 3 sale attempts with the ask held roughly flat each time — persistent listings suggest the price (not the market) is what's stuck; bring a comps-based counter.
Risks & watch-outs
- Climate carrying-cost: major wind risk, 66% chance of damaging wind over 30y; extreme-heat days projected 7→24/yr by 2055 (HVAC capex compounding) — expect insurance premiums to compound above CPI over the hold.
Questions for the listing agent
- What do current leases actually rent for vs. the listed asking? Can we see a recent rent roll and the last 12 months of T-12 income?
- It's been on market 71 days. Have you received any prior offers? Is the seller open to a 11% concession, seller financing, or rate buy-down credit?
- What does the HOA fee cover, when was the last increase, and are there any pending special assessments or reserve-fund shortfalls?
- Why hasn't it sold? Are there any deal-killer items the seller is aware of (foundation, flood, title, zoning, code violations)?
- Is there a deadline driving the sale (1031 exchange, divorce, estate, relocation)? That informs how much negotiation room exists.
- Schools are D-rated, which usually means shorter tenancies and higher turnover. Who's the typical renter profile here, and what's been the actual vacancy rate?
- Crime grade is D in this area — have there been break-ins, vandalism, or insurance claims at this property in the last 3 years? What carrier currently insures it and at what premium?
- The area grade is low — what's the realistic commute time and amenity access for the typical tenant pool here? Any planned neighborhood developments (good or bad) we should know about?
- What's the average days-on-market for RENTAL listings here right now (not sales)? A rising rental-DOM trend means longer vacancies and softer asking-rent achievability than the comps imply.
- What's the recent tenant-quality profile in this submarket — average credit score on applications, eviction rate, late-payment / NSF rate, and stable-employment percentage? A property-management company in the area should have these aggregated.
- How much new for-sale + rental construction is in the pipeline within 1–3 miles? Heavy new supply typically softens prices + rents 12–24 months out; constrained supply supports both.
Investment metrics
- 1% rule
- 0.89% ✗
- Cap rate
- 5.63%
- Cash-on-cash
- -2.37%
- DSCR
- 0.89
- GRM
- 9.4
CMA / ARV
No comps found within radius.
Projected returns pro-forma
-3.0% appreciation · 3.0% rent growth · sell at horizon
- IRR
- -20.2%
- Equity multiple
- 0.30×
- Total profit
- $-57,033
- Equity at exit
- $43,240
- IRR
- -13.0%
- Equity multiple
- 0.23×
- Total profit
- $-62,169
- Equity at exit
- $25,074
Cash invested: $81,200 (down + closing). Projections, not guarantees.
Landlord ↔ Tenant lean methodology
- Overall (STATE)
- 87 Strongly Landlord-Friendly
- State Texas
- 87 Strongly Landlord-Friendly · R+5
- County
- — inherits STATE
- City
- — inherits STATE
ZIP-level market 76655
- Home prices YoY
- -31.3%
- Active inventory
- 265
- Price-to-rent
- 9.4×
Monthly cashflow live
- Estimated rent
- $2,568 high interval (Pro) →
- Mortgage (P&I)
- −$1,521
- Tax from tax record
- −$532 /mo · $6,388/yr
- Insurance
- −$121
- HOA
- −$15
- Vacancy / Maint / Mgmt
- −$539
- Net cashflow
- $-160
Break-even live
UW: 25.0% down · 7.5% · 30yr · 1.5% tax · 5.0% vac · 8.0% maint · 8.0% mgmt
Financing live
Cash to close
- Down payment
- $72,500
- Closing costs
- $8,700
- Reserves months
- —
- Total cash needed
- —
Loan-product check · same deal, 3 products live
Conventional
25% down · 7.5% · 30yr
- Down + closing
- —
- Monthly P&I
- —
- Monthly cashflow
- —
- DSCR
- —
- Eligible?
- —
Personal DTI + credit; lowest rate.
DSCR
20% down · 8.5% · 30yr
- Down + closing
- —
- Monthly P&I
- —
- Monthly cashflow
- —
- DSCR
- —
- Eligible?
- —
No personal income docs; deal must DSCR.
Hard money
10% down · 12.0% · 12mo
- Down + closing
- —
- Monthly P&I
- —
- Monthly cashflow
- —
- DSCR
- —
- Eligible?
- —
Short-term bridge; refi at stabilization.
Rent comps 8 comps
| Address | Beds | Baths | Sqft | Rent | $/sqft | DOM | Units | Dist |
|---|---|---|---|---|---|---|---|---|
| 3225 Marston Rd Lorena, TX | 4.0 | 2.0 | 1850 | $2,800 | $1.51 | 43d | 1 | 0.16mi |
| 3128 Brosnan Rd Lorena, TX | 3.0 | 2.0 | 1717 | $2,350 | $1.37 | 43d | 1 | 0.25mi |
| 3217 Jackal Dr Lorena, TX | 4.0 | 2.0 | 1840 | $2,400 | $1.30 | 21d | 1 | 0.33mi |
| 3117 Sherco Rd Lorena, TX | 3.0 | 2.0 | 1469 | $2,000 | $1.36 | 43d | 1 | 0.34mi |
| 2809 Keathley Dr Lorena, TX | 3.0 | 2.0 | 1565 | $2,100 | $1.34 | 43d | 1 | 0.48mi |
| 2813 Gilchrist Dr Lorena, TX | 3.0 | 2.0 | 1529 | $2,200 | $1.44 | 43d | 1 | 0.53mi |
| 2701 Skinner Dr Lorena, TX | 3.0 | 2.0 | 1573 | $2,400 | $1.53 | 43d | 1 | 0.68mi |
| 10312 Sierra West Dr Waco, TX | 3.0 | 2.0 | 1560 | $2,300 | $1.47 | 21d | 1 | 0.99mi |
HOA detail
- Monthly dues
- $15 · $180/yr
Listing history 16 events
-
2026-06-18days on market $290,000 Active 71 DOM
-
2026-06-17days on market $290,000 Active 70 DOM
-
2026-06-16days on market $290,000 Active 69 DOM
-
2026-06-15days on market $290,000 Active 68 DOM
-
2026-06-15days on market $290,000 Active 67 DOM
-
2026-06-13days on market $290,000 Active 66 DOM
-
2026-06-12days on market $290,000 Active 65 DOM
-
2026-06-10days on market $290,000 Active 62 DOM
-
2026-06-08days on market $290,000 Active 61 DOM
-
2026-06-08days on market $290,000 Active 60 DOM
-
2026-06-07days on market $290,000 Active 59 DOM
-
2026-06-03days on market $290,000 Active 56 DOM
-
2026-06-02days on market $290,000 Active 55 DOM
-
2026-06-01days on market $290,000 Active 54 DOM
-
2026-05-31remarks 699-char remark
-
2026-05-31$290,000 Active 53 DOM
ⓘ Source: listings_history table (triggers on properties + properties_extension) + one-shot
backfill from property_details.listing_events for pre-trigger history.
Tax reassessment forecast TX · Resets to sale price
- Current annual tax
- $6,388 · $532/mo
- Projected year-2 tax
- $6,388 · $532/mo
- Expected delta
- $0/yr ($0/mo · 0.0%)
ⓘ Screening estimate from a state-policy table — verify with the county assessor before closing.
Climate risk First Street
- Flood 1/10 Low FEMA zone X (unshaded) · 0% chance over 30 yrs
- Wildfire 3/10 Moderate
- Heat 7/10 Severe 7 d/yr ≥108°F today · 24 d/yr by 30 yrs out
- Wind 6/10 Major 66% chance of damaging wind over 30 yrs
- Air quality 2/10 Low 0 unhealthy d/yr today · 1 by 30 yrs out
Nearby sold comps map
Loading sold comps map…
Walkable amenities ~0.75 mi
Loading nearby amenities…
Taxation est. · year 1
- Rental income
- $30,819
- − Mortgage interest
- −$16,245
- − Property taxes
- −$6,388
- − Insurance
- −$1,450
- − Repairs & maintenance
- −$2,466
- − Management
- −$2,466
- − HOA
- −$180
- − Depreciation
- −$8,436
- Taxable loss
- −$6,811
- Est. tax savings @ 24.0%
- +$1,635
- After-tax cash flow
- $-286/yr
For passive investors: Depreciation is non-cash, so a rental often shows a tax loss while cash-flowing — sheltering income. Rental losses are passive: they offset passive income freely, and up to $25,000/yr can offset ordinary (W-2) income if you actively participate and your MAGI is under $100k (phasing out to $0 by $150k); unused losses carry forward. On sale, claimed depreciation is recaptured at up to 25%, and gains may owe capital-gains tax (a 1031 exchange can defer both). Figures are a year-1 estimate at your 24.0% rate — not tax advice; consult a CPA.
Condition & rehab AI · 1 photo
This 2020-built single-family home in the Park Meadows neighborhood of Lorena is in good condition with minimal maintenance needed. It offers a good return on investment with updates that can significantly increase its value.
Value-add opportunities
- Both Paint exterior trim — Enhances curb appeal and can increase both resale and rental value
- Both Upgrade landscaping — Improves curb appeal and can increase both resale and rental value
- Both Install smart home features — Enhances home's modern appeal and can increase both resale and rental value
Renovation cost estimate screening
Value-add ROI direction
- Both Paint exterior trim — Enhances curb appeal and can increase both resale and rental value ↑
- Both Upgrade landscaping — Improves curb appeal and can increase both resale and rental value ↑
- Both Install smart home features — Enhances home's modern appeal and can increase both resale and rental value ↑
ⓘ Cost ranges are severity-bucket heuristics (US national rule-of-thumb). Get contractor quotes + a written scope before underwriting a rehab budget.
Schools (NCES district)
- District
- Midway ISD
- NCES district ID
- 4830640
- Math proficiency
- 61% ▼ -8.00%
- Reading proficiency
- 58% ▼ -7.00%
- Median HH income
- $67,076
- Composite
- 52.32/100
- National rank
- #1593
- State rank
- #56 of 826 in TX
Livability — Waco
- Score
- 74/100
- State rank
- #166
- US rank
- #4378
Category grades
Schools grade is shown separately in the Schools card above.
Census & demographics
- Census place
- Waco, TX
- County
- McLennan County · 213,088 people
- City population
- 125,319
- Metro
- Waco, TX
- Population (ZIP)
- 10,603
- Household income
- $99,917
- Rent vs Own
- Severe rent burden
- 62.0
Population outlook (McLennan County) Hauer SSP2
- Today (2025)
- 264,191 people
- By 2030
- 273,578 · +3.6%
- By 2040
- 291,506 · +10.3%
- By 2050
- 308,044 · +16.6%
- By 2075
- 349,648 · +32.3%
- By 2100
- 364,779 · +38.1%
Race, ethnicity, and origin ACS 2023
- Neighborhood character
- Predominantly White (76%)
- Race & ethnicity
- White 76% Hispanic / Latino 17% Two or more races 12% Black 3%
- Hispanic origin (detail)
- Mexican 14%
- Common ancestry
- Lithuanian 3% Slovak 3% Serbian 2%
- Foreign-born
- 2% · Canada
- Languages at home
- 93% English-only · Spanish 5% Arabic 2%
Political lean MEDSL · McLennan
- 2024 margin
- Solid R (+30.9) · D 34.0% · R 64.9% · Other 1.0%
- 2008→2024 swing
- -7.0pp toward R · 2008: -23.9pp · 2024: -30.9pp
- All cycles
- 2024: R+30.9 2020: R+23.4 2016: R+27.1 2012: R+29.8 2008: R+23.9
Not yet ingested
- Civics
- —
Market trends
- HPI YoY
- ▼ -105.10%
- Current HPI
- 230.4333
- Rent YoY
- —
- Metro
- Waco, TX
- State GDP YoY
- ▲ 3.95%
- F500 in state
- 110
Industry mix (Fortune 500 HQ in TX)
| Industry | F500 HQs | Revenue |
|---|---|---|
| Energy | 16 | $1,198B |
|
||
| Technology | 5 | $198B |
|
||
| Engineering / Construction | 4 | $72B |
|
||
| Energy Services | 3 | $60B |
|
||
| Utilities | 3 | $41B |
|
||
| Healthcare | 2 | $330B |
|
||
Price history
-7.9% since first listed6 events — show timeline
- 2026-05-02 Relisted — NTREIS
- 2026-04-30 Contingent — NTREIS
- 2026-04-08 Listed $290,000 NTREIS
- 2025-07-29 Price Changed $299,000 NTREIS
- 2025-06-10 Price Changed $308,000 NTREIS
- 2025-05-22 Listed $315,000 NTREIS
Property tax history
+22.8%/yrLatest (2025): $6,388 · -3.9% YoY. Source: county tax records.
Cash-flow waterfall
monthlySold comps — $/sqft
last 12 mo · ≤1 miLoading sold comps…