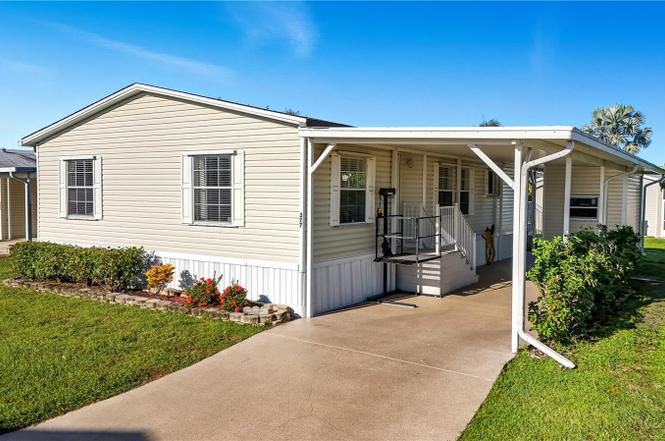
1000 Kings Hwy #377 · Port Charlotte, FL
Flood risk 1/10 · Minimal
- FEMA flood zone
- X (unshaded)
- Chance of flooding over 30 yrs
- 0.0%
- Est. flood insurance / yr
- $507 – $1,088
Fire risk 1/10 · Minimal
- Est. fire insurance / yr
- $947 – $1,759
Heat risk 10/10 · Severe
- Hot days now (above 107°F)
- 7 days/yr
- Hot days in 30 yrs
- 27 days/yr
Wind risk 10/10 · Severe
- Chance of severe wind over 30 yrs
- 99.0%
Air-quality risk 2/10 · Minimal
- Unhealthy air days now
- 2 days/yr
- Unhealthy air days in 30 yrs
- 2 days/yr
Risk factors via First Street. Map © Google.
Why this score? — see what drove the C+ grade
The composite is a weighted blend of 9 inputs, each scored 0–100. Each bar is that input's sub-score; the figure is the points it added to the 100-point composite (weight × sub-score).
- Cash flow +25.4/30.0
- 1% rule +9.5/10.0
- ARV discount +8.7/15.0
- DSCR +8.4/10.0
- Schools +4.6/10.0
- Livability +3.2/5.0
- Condition / age +2.5/5.0
- Rent growth +1.5/5.0
- Appreciation +0.0/10.0
$149,000
🖨 Deal sheet 📄 Offer letter ✓ Due diligence
Listing remarks
Discover the relaxed Florida lifestyle at Port Charlotte Village a 55+ community, where this 3-bedroom, 2-bath manufactured home offers both comfort and convenience with a water view. No need to hop on your golf cart to enjoy the lake, but you can! Enjoy your days overlooking the community lake from your private lanai. Step inside to find a bright and open layout designed for easy living, with plenty of space to gather, unwind, and enjoy time with family and friends. A private primary bedroom with esuite, flexible guest rooms, a laundry room off the kitchen and thoughtful details throughout make this home a welcoming retreat. Also make use of your covered car port and oversized shed for yo
Key facts
- Oversized shed
- Community lake
- Covered car port
Tags
Property features AI
Finance
- Other: Unit located in a manufactured home park (MHP)
- Financial info: Monthly community fees $300 / $3,600 annually; Lease restrictions apply
- HOA & community: Has HOA; monthly fee $300 (includes cable TV, internet, pool, grounds maintenance, management, private road, recreational facilities, sewer, trash, water); Association approval required; Buyer approval required; Senior community; Pets allowed (max 25 lbs); Dog park; Pool; Golf carts allowed
Exterior
- Parking: Carport with 1 space
- Utilities: Public water; Public sewer; Electricity connected; Water connected; Sewer connected; Cable available
- Home design: Manufactured home (double wide); One story; East facing
- Construction: Vinyl siding; Tile roof; Stem wall foundation; Built as a double wide manufactured home
- Exterior features: Exterior lighting; Paved road access
Interior
- Kitchen: Dishwasher; Range; Microwave; Refrigerator
- Bedrooms: 3 bedrooms
- Flooring: Carpet; Linoleum
- Bathrooms: 2 full bathrooms
- Heating & cooling: Central heating; Central air conditioning
- Interior features: Ceiling fans
- Laundry & utility: Dedicated laundry room; Washer; Dryer
Neighborhood map
What this means for you Summary
Snapshot
- This is a 3-bed/2.0-bath manufactured listed at $149k.
Deal economics
- At list price, monthly cash flow is $342 ($4k/yr) — positive.
- The deal already cash-flows at list — no discount required.
- Meets the 1% rule at list price ($2k rent vs $149k).
- Recommended offer: $131k (12.0% below list) — sets the bar for market timing.
- Cap rate 9.0% vs local median 4.4% in Port Charlotte — top-decile yield for the area; either an underpriced asset or a hidden risk that comps aren't pricing in. Stress-test before assuming the spread holds.
Location & tenants
- Location reads 65/100 on livability (#655 in FL) — a middle-class / working-renter tenant base. Strengths: cost of living A+, housing A+; Watch: schools D+, employment D, amenities F.
- Charlotte (suburban): math 54% / reading 54% proficiency, ranked #22 of 73 in FL (top 30%) — acceptable for families but not a draw, mixed tenant base, ~2y average lease.
- Market conditions: Rents falling (-4.0%/yr); 600 active listings in the ZIP; 26 comparable units currently listed for rent nearby; rentals at typical pace (median 22d on market — plan ~3-4 weeks tenant-placement turnaround); 4,585 units permitted in Charlotte County in 2024 (703 in 5+ unit buildings).
- This rent runs 41% of the median local income ($64k/yr) — at the standard rent-burdened threshold; future hikes will face affordability resistance.
Forward outlook
- Local home prices are declining (-3.0%/yr); year-one equity from $1k of loan paydown is wiped out by about $4k of value loss. Plan a longer hold.
- Charlotte County population projected at +24% by 2050 — long-run rental-demand tailwind backs the buy-and-hold thesis.
Negotiation context
- It's been on market 209 days — a 12% lower offer ($131k) is reasonable based on typical stale-listing flexibility.
- 6 sale attempts since 2y ago; this cycle's ask has dropped $10k (6%) from the opening price — seller is motivated, your offer sets the floor, not the list.
Risks & watch-outs
- Climate carrying-cost: severe wind risk, 99% chance of damaging wind over 30y; extreme-heat days projected 7→27/yr by 2055 (HVAC capex compounding) — expect insurance premiums to compound above CPI over the hold.
Questions for the listing agent
- It's been on market 209 days. Have you received any prior offers? Is the seller open to a 12% concession, seller financing, or rate buy-down credit?
- What does the HOA fee cover, when was the last increase, and are there any pending special assessments or reserve-fund shortfalls?
- Why hasn't it sold? Are there any deal-killer items the seller is aware of (foundation, flood, title, zoning, code violations)?
- Is there a deadline driving the sale (1031 exchange, divorce, estate, relocation)? That informs how much negotiation room exists.
- Schools are D-rated, which usually means shorter tenancies and higher turnover. Who's the typical renter profile here, and what's been the actual vacancy rate?
- What's the average days-on-market for RENTAL listings here right now (not sales)? A rising rental-DOM trend means longer vacancies and softer asking-rent achievability than the comps imply.
- What's the recent tenant-quality profile in this submarket — average credit score on applications, eviction rate, late-payment / NSF rate, and stable-employment percentage? A property-management company in the area should have these aggregated.
- How much new for-sale + rental construction is in the pipeline within 1–3 miles? Heavy new supply typically softens prices + rents 12–24 months out; constrained supply supports both.
Investment metrics
- 1% rule
- 1.45% ✓
- Cap rate
- 9.05%
- Cash-on-cash
- 9.83%
- DSCR
- 1.44
- GRM
- 5.8
CMA / ARV
- ARV (on-the-fly)
- $152,928
- Comps found
- 4
Show comp detail 4 sales within ~0.75 mi
| Address | Dist | Beds/Ba | Sqft | Sold | Price | $/sf | Match |
|---|---|---|---|---|---|---|---|
| 1000 Kings Hwy #373 | 0.02mi | 2/2.0 (-1) | 1,248 (-4%) | 2mo | $170,000 | $136 | 86 |
| 1000 Kings Hwy #389 | 0.07mi | 2/2.0 (-1) | 1,269 (-2%) | 10mo | $150,000 | $118 | 80 |
| 1000 Kings Hwy #181 | 0.35mi | 2/2.0 (-1) | 1,344 (+4%) | 9mo | $145,000 | $108 | 65 |
| 1000 Kings Hwy #207 | 0.38mi | 3/2.0 | 1,404 (+8%) | 12mo | $150,000 | $107 | 58 |
Match score weights: distance 35% · size 25% · config 20% · recency 20%. Top-matched comps best support the ARV.
Projected returns pro-forma
-3.0% appreciation · 0.0% rent growth · sell at horizon
- IRR
- -5.7%
- Equity multiple
- 0.80×
- Total profit
- $-8,455
- Equity at exit
- $22,216
- IRR
- -1.2%
- Equity multiple
- 0.93×
- Total profit
- $-2,782
- Equity at exit
- $12,883
Cash invested: $41,720 (down + closing). Projections, not guarantees.
Landlord ↔ Tenant lean methodology
- Overall (STATE)
- 87 Strongly Landlord-Friendly
- State Florida
- 87 Strongly Landlord-Friendly · R+3
- County
- — inherits STATE
- City
- — inherits STATE
ZIP-level market 33980
- Home prices YoY
- -5.0%
- Rents YoY
- -4.0%
- Active inventory
- 600
- Price-to-rent
- 5.8×
Monthly cashflow live
- Estimated rent
- $2,155 high interval (Pro) →
- Mortgage (P&I)
- −$781
- Tax from tax record
- −$218 /mo · $2,610/yr
- Insurance
- −$62
- HOA
- −$300
- Vacancy / Maint / Mgmt
- −$453
- Net cashflow
- $342
Break-even live
UW: 25.0% down · 7.5% · 30yr · 1.5% tax · 5.0% vac · 8.0% maint · 8.0% mgmt
Financing live
Cash to close
- Down payment
- $37,250
- Closing costs
- $4,470
- Reserves months
- —
- Total cash needed
- —
Loan-product check · same deal, 3 products live
Conventional
25% down · 7.5% · 30yr
- Down + closing
- —
- Monthly P&I
- —
- Monthly cashflow
- —
- DSCR
- —
- Eligible?
- —
Personal DTI + credit; lowest rate.
DSCR
20% down · 8.5% · 30yr
- Down + closing
- —
- Monthly P&I
- —
- Monthly cashflow
- —
- DSCR
- —
- Eligible?
- —
No personal income docs; deal must DSCR.
Hard money
10% down · 12.0% · 12mo
- Down + closing
- —
- Monthly P&I
- —
- Monthly cashflow
- —
- DSCR
- —
- Eligible?
- —
Short-term bridge; refi at stabilization.
Rent comps 26 comps
| Address | Beds | Baths | Sqft | Rent | $/sqft | DOM | Units | Dist |
|---|---|---|---|---|---|---|---|---|
| 24484 Zephyr Ct Unit 24484 Punta Gorda, FL | 3.0 | 2.0 | 1255 | $1,695 | $1.35 | 21d | 1 | 0.21mi |
| 1717 Sunderland Dr Punta Gorda, FL | 2.0 | 2.0 | 1402 | $2,800 | $2.00 | 21d | 1 | 0.26mi |
| 1670 Royal Ct Punta Gorda, FL | 2.0 | 2.0 | 1393 | $2,400 | $1.72 | 21d | 1 | 0.28mi |
| 1829 Knights Bridge Trl Punta Gorda, FL | 2.0 | 2.0 | 1509 | $2,000 | $1.33 | 21d | 1 | 0.36mi |
| 24401 Manchester Trl Punta Gorda, FL | 2.0 | 2.0 | 1382 | $2,000 | $1.45 | 21d | 1 | 0.39mi |
| 1867 Nottingham Trl Punta Gorda, FL | 3.0 | 2.0 | 1646 | $2,000 | $1.22 | 21d | 1 | 0.41mi |
| 24472 Manchester Trl Punta Gorda, FL | 2.0 | 2.0 | 1373 | $1,900 | $1.38 | 21d | 1 | 0.50mi |
| 1471 Capricorn Blvd Unit A Punta Gorda, FL | 3.0 | 2.0 | 1450 | $1,900 | $1.31 | 14d | 1 | 0.59mi |
| 1499 Capricorn Blvd Port Charlotte, FL | 2.0 | 2.0 | 980 | $1,495 | $1.53 | 21d | 1 | 0.63mi |
| 25050 Sandhill Blvd Unit 5B1 Punta Gorda, FL | 2.0 | 2.0 | 900 | $1,500 | $1.67 | 21d | 1 | 0.68mi |
| 1200 Loveland Blvd Punta Gorda, FL | 1.0–3.0 | 1.0–2.0 | 1151 | $2,660 | $2.31 | 14d | 276 | 0.69mi |
| 1999 Kings Hwy Port Charlotte, FL | 2.0 | 1.0–2.0 | 906 | $1,800 | $1.99 | 21d | 2 | 0.76mi |
| 24151 Beatrix Blvd Port Charlotte, FL | 3.0 | 1.0–2.0 | 990 | $2,272 | $2.29 | 14d | 28 | 0.78mi |
| 25225 Rampart Blvd Punta Gorda, FL | 2.0 | 2.0 | 886 | $1,925 | $2.17 | 21d | 5 | 0.91mi |
| 24150 Beatrix Blvd Port Charlotte, FL | 3.0 | 1.0–2.0 | 866 | $1,978 | $2.28 | 14d | 42 | 1.02mi |
| 24001 Madaca Ln Port Charlotte, FL | 1.0–3.0 | 1.0–2.0 | 1179 | $1,944 | $1.65 | 14d | 26 | 1.10mi |
| 175 Kings Hwy Port Charlotte, FL | 2.0 | 2.0 | 1219 | $1,398 | $1.15 | 21d | 3 | 1.17mi |
| 25230 Campos Dr Punta Gorda, FL | 3.0 | 2.0 | 1460 | $1,750 | $1.20 | 21d | 1 | 1.27mi |
| 175 Kings Hwy Unit A8 Punta Gorda, FL | 2.0 | 2.0 | 1228 | $1,700 | $1.38 | 21d | 1 | 1.28mi |
| 2060 Willow Hammock Cir Unit D304 Punta Gorda, FL | 2.0 | 2.0 | 924 | $1,600 | $1.73 | 21d | 1 | 1.29mi |
| 25583 Deep Creek Blvd Punta Gorda, FL | 4.0 | 2.0 | 1810 | $2,300 | $1.27 | 14d | 1 | 1.37mi |
| 2121 Heron Lake Dr #204 Punta Gorda, FL | 2.0 | 2.0 | 996 | $1,500 | $1.51 | 21d | 1 | 1.37mi |
| 25599 Deep Creek Blvd Punta Gorda, FL | 4.0 | 2.0 | 1806 | $1,995 | $1.10 | 14d | 1 | 1.40mi |
| 23184 Glory Ave Port Charlotte, FL | 2.0 | 2.0 | 1370 | $2,000 | $1.46 | 21d | 1 | 1.45mi |
| 1472 Neapolitan Rd Punta Gorda, FL | 3.0 | 2.0 | 1820 | $2,100 | $1.15 | 14d | 1 | 1.47mi |
| 1196 Rio de Janeiro Ave #206 Punta Gorda, FL | 2.0 | 2.5 | 1154 | $1,325 | $1.15 | 21d | 1 | 1.47mi |
HOA detail
- Monthly dues
- $300 · $3,600/yr
- Likely covers
- water
Listing history 33 events
-
2026-06-18days on market $149,000 Active 209 DOM
-
2026-06-17days on market $149,000 Active 208 DOM
-
2026-06-16days on market $149,000 Active 207 DOM
-
2026-06-15days on market $149,000 Active 206 DOM
-
2026-06-14pricedays on market $149,000 Active 204 DOM
-
2026-06-13days on market $159,000 Active 203 DOM
-
2026-06-10days on market $159,000 Active 201 DOM
-
2026-06-09days on market $159,000 Active 200 DOM
-
2026-06-08days on market $159,000 Active 199 DOM
-
2026-06-05days on market $159,000 Active 195 DOM
-
2026-06-02days on market $159,000 Active 193 DOM
-
2026-06-01days on market $159,000 Active 192 DOM
-
2026-05-31days on market $159,000 Active 191 DOM
-
2026-05-30days on market $159,000 Active 190 DOM
-
2026-04-23status Active
-
2026-03-31historical
-
2025-12-30status Active
-
2025-12-07status Pending
-
2025-11-15status Active
-
2025-11-07status Pending
-
2025-09-27$159,000 Active
-
2025-05-31historical
-
2025-04-07price $179,900
-
2025-03-30price $184,000
-
2025-03-07price $189,000
-
2025-01-29price $199,900
-
2025-01-04price $215,000
-
2025-01-04price $199,900
-
2025-01-01status Active
-
2024-12-31historical
-
2024-11-13price $225,000
-
2024-07-02$250,000 Active
-
2021-12-17soldstatus $170,100
ⓘ Source: listings_history table (triggers on properties + properties_extension) + one-shot
backfill from property_details.listing_events for pre-trigger history.
Tax reassessment forecast FL · Resets to sale price
- Current annual tax
- $2,610 · $218/mo
- Projected year-2 tax
- $2,610 · $218/mo
- Expected delta
- $0/yr ($0/mo · 0.0%)
ⓘ Screening estimate from a state-policy table — verify with the county assessor before closing.
Climate risk First Street
- Flood 1/10 Low FEMA zone X (unshaded) · 0% chance over 30 yrs
- Wildfire 1/10 Low
- Heat 10/10 Extreme 7 d/yr ≥107°F today · 27 d/yr by 30 yrs out
- Wind 10/10 Extreme 99% chance of damaging wind over 30 yrs
- Air quality 2/10 Low 2 unhealthy d/yr today · 2 by 30 yrs out
Nearby sold comps map
Loading sold comps map…
Walkable amenities ~0.75 mi
Loading nearby amenities…
Taxation est. · year 1
- Rental income
- $25,865
- − Mortgage interest
- −$8,346
- − Property taxes
- −$2,610
- − Insurance
- −$745
- − Repairs & maintenance
- −$2,069
- − Management
- −$2,069
- − HOA
- −$3,600
- − Depreciation
- −$4,335
- Taxable income
- $2,091
- Est. tax owed @ 24.0%
- −$502
- After-tax cash flow
- $3,600/yr
For passive investors: Depreciation is non-cash, so a rental often shows a tax loss while cash-flowing — sheltering income. Rental losses are passive: they offset passive income freely, and up to $25,000/yr can offset ordinary (W-2) income if you actively participate and your MAGI is under $100k (phasing out to $0 by $150k); unused losses carry forward. On sale, claimed depreciation is recaptured at up to 25%, and gains may owe capital-gains tax (a 1031 exchange can defer both). Figures are a year-1 estimate at your 24.0% rate — not tax advice; consult a CPA.
Schools (NCES district)
- District
- Charlotte
- NCES district ID
- 1200240
- Math proficiency
- 54% ▼ -6.00%
- Reading proficiency
- 54% ▼ -1.00%
- Median HH income
- $44,864
- Composite
- 45.62/100
- National rank
- #2586
- State rank
- #22 of 73 in FL
Livability — Port Charlotte
- Score
- 65/100
- State rank
- #655
- US rank
- #13081
Category grades
Schools grade is shown separately in the Schools card above.
Census & demographics
- County
- Charlotte County · 196,994 people
- City population
- 102,180
- Metro
- Punta Gorda, FL
- Population (ZIP)
- 13,120
- Household income
- $63,591
- Rent vs Own
- Severe rent burden
- 612.0
Population outlook (Charlotte County) Hauer SSP2
- Today (2025)
- 198,646 people
- By 2030
- 210,507 · +6.0%
- By 2040
- 230,857 · +16.2%
- By 2050
- 247,148 · +24.4%
- By 2075
- 281,777 · +41.8%
- By 2100
- 293,609 · +47.8%
Race, ethnicity, and origin ACS 2023
- Neighborhood character
- Predominantly White (75%)
- Race & ethnicity
- White 75% Hispanic / Latino 10% Two or more races 10% Black 9%
- Hispanic origin (detail)
- Puerto Rican 3% Cuban 2% Dominican 2%
- Common ancestry
- Romanian 5% Hispanic 4% Slovak 3%
- Foreign-born
- 16% · Canada, Jamaica
- Languages at home
- 85% English-only · Spanish 8% French/Haitian/Cajun 5% German/W. Germanic 1%
Political lean MEDSL · Charlotte
- 2024 margin
- Solid R (+34.0) · D 32.7% · R 66.7%
- 2008→2024 swing
- -26.7pp toward R · 2008: -7.2pp · 2024: -34.0pp
- All cycles
- 2024: R+34.0 2020: R+26.6 2016: R+27.8 2012: R+14.3 2008: R+7.2
Not yet ingested
- Civics
- —
Market trends
- HPI YoY
- ▼ -16.02%
- Current HPI
- 306.3331
- Rent YoY
- ▼ -4.04%
- Metro
- Punta Gorda, FL
- State GDP YoY
- ▲ 3.28%
- F500 in state
- 36
Industry mix (Fortune 500 HQ in FL)
| Industry | F500 HQs | Revenue |
|---|---|---|
| Industrial Technology | 2 | $29B |
|
||
| Insurance | 2 | $17B |
|
||
| Retail | 1 | $60B |
|
||
| Technology Distribution | 1 | $58B |
|
||
| Homebuilding | 1 | $35B |
|
||
| Technology Manufacturing | 1 | $35B |
|
||
Price history
-6.5% since first listed19 events — show timeline
- 2026-04-23 Relisted — Stellar MLS as Distributed by MLS Grid
- 2026-03-31 Listing Removed — Stellar MLS as Distributed by MLS Grid
- 2025-12-30 Relisted — Stellar MLS as Distributed by MLS Grid
- 2025-12-07 Pending — Stellar MLS as Distributed by MLS Grid
- 2025-11-15 Relisted — Stellar MLS as Distributed by MLS Grid
- 2025-11-07 Pending — Stellar MLS as Distributed by MLS Grid
- 2025-09-27 Listed $159,000 Stellar MLS as Distributed by MLS Grid
- 2025-05-31 Listing Removed — Stellar MLS as Distributed by MLS Grid
- 2025-04-07 Price Changed $179,900 Stellar MLS as Distributed by MLS Grid
- 2025-03-30 Price Changed $184,000 Stellar MLS as Distributed by MLS Grid
- 2025-03-07 Price Changed $189,000 Stellar MLS as Distributed by MLS Grid
- 2025-01-29 Price Changed $199,900 Stellar MLS as Distributed by MLS Grid
- 2025-01-04 Price Changed $215,000 Stellar MLS as Distributed by MLS Grid
- 2025-01-04 Price Changed $199,900 Stellar MLS as Distributed by MLS Grid
- 2025-01-01 Relisted — Stellar MLS as Distributed by MLS Grid
- 2024-12-31 Listing Removed — Stellar MLS as Distributed by MLS Grid
- 2024-11-13 Price Changed $225,000 Stellar MLS as Distributed by MLS Grid
- 2024-07-02 Listed $250,000 Stellar MLS as Distributed by MLS Grid
- 2021-12-17 Sold (Public Records) $170,100 Public Records
Property tax history
+4.1%/yrLatest (2025): $2,610 · -11.1% YoY. Source: county tax records.
Cash-flow waterfall
monthlySold comps — $/sqft
last 12 mo · ≤1 miLoading sold comps…